Search test library by skills or roles
⌘ K

About the test:

このテストは、データストーリーテリング、データ解釈、ビジネスインテリジェンス開発、データ分析の分野での候補者の知識とスキルを評価します。

Covered skills:

  • グラフとチャート
  • コミュニケーションスキル
  • データ解釈
  • データ分析
  • 構造的な思考。
  • プレゼンテーション能力
  • 批判的思考

Try practice test
9 reasons why
9 reasons why

Adaface Data Storytelling Assessment Test is the most accurate way to shortlist データアナリストs


Reason #1

Tests for on-the-job skills

The Data Storytelling Test helps recruiters and hiring managers identify qualified candidates from a pool of resumes, and helps in taking objective hiring decisions. It reduces the administrative overhead of interviewing too many candidates and saves time by filtering out unqualified candidates at the first step of the hiring process.

The test screens for the following skills that hiring managers look for in candidates:

  • データを解釈して分析して、意味のある洞察を引き出します
  • ストーリーテリング技術を通じてデータを効果的に提示します
  • 批判的思考スキルを適用して、複雑なデータシナリオを分析します
  • データ分析を実施して、傾向とパターンを特定します
Reason #2

No trick questions

no trick questions

Traditional assessment tools use trick questions and puzzles for the screening, which creates a lot of frustration among candidates about having to go through irrelevant screening assessments.

View sample questions

The main reason we started Adaface is that traditional pre-employment assessment platforms are not a fair way for companies to evaluate candidates. At Adaface, our mission is to help companies find great candidates by assessing on-the-job skills required for a role.

Why we started Adaface
Try practice test
Reason #3

Non-googleable questions

We have a very high focus on the quality of questions that test for on-the-job skills. Every question is non-googleable and we have a very high bar for the level of subject matter experts we onboard to create these questions. We have crawlers to check if any of the questions are leaked online. If/ when a question gets leaked, we get an alert. We change the question for you & let you know.

How we design questions

これらは、10,000以上の質問のライブラリからのわずかなサンプルです。これに関する実際の質問 データストーリーテリングテスト グーグルできません.

🧐 Question

Medium

Dividends
Financial Analysis
Percentage and Average Calculations
Try practice test
Consider the following line chart which shows the money invested by a company in production each year and the sales made by the company each year. If the pie chart shows the shareholding pattern of the company and the company gives 10% of the profit as dividends to its share holders then what is the average dividend received by retail investors from 2000 to 2004?
 image
 image

Medium

Laptop Brands
Proportions and Percentages
Financial Reasoning
Try practice test
Given below is the list of laptop brands and their details in which some data is missing. If the cost price of Dell is 3/5 of the cost price of Lenovo, then what will be the %profit of Dell?
 image

Hard

Median
Trend Analysis
Statistical Reasoning
Try practice test
 Consider the following line chart which shows the sales of five different companies from 2000 to 2009. Which of the following companies has the maximum percentage increase in the median from 2000 to 2004 and 2005 to 2009.
 image

Medium

Claims for a new drug Xylanex
Critical Thinking
Evaluating Arguments
Identifying Assumptions
Try practice test
A pharmaceutical company claims that their new drug, Xylanex, is highly effective in treating a specific medical condition. They provide statistical data from a clinical trial to support their claim. However, a group of scientists has raised concerns about the validity of the study design and potential bias in the data collection process. They argue that the results may be inflated and not truly representative of the drug's effectiveness.

Which of the following assumptions is necessary to support the pharmaceutical company's claim?
A: The clinical trial participants were randomly selected and representative of the target population.
B: The scientists raising concerns have a conflict of interest and are biased against the pharmaceutical company.
C: The statistical analysis of the clinical trial data was conducted by independent experts.
D: The medical condition being treated by Xylanex is widespread and affects a large number of individuals.
E: The pharmaceutical company has a proven track record of developing effective drugs for similar medical conditions.

Medium

Emma's cafe business
Try practice test
Emma's cafe has been operating successfully for the last 6 years. Profits have been growing every year, with this year (2020) being their best year so far. As a thank you, Emma treated her staff to a meal at a Michelin star restaurant. 
 image
Below are 3 statements about Emma, her staff and her cafe. Can you help us decide whether the 3 statements are "True", "Probably True", "Insufficient Data to Say True or False", "Probably False", or "False".

1. Emma's staff members are happy.
2. Emma's cafe did well in 2016.
3. Emma is rich.

A: True
B: False
C: Probably True
D: Probably False
E: Insufficient Data

Medium

Ivory's new startup
Try practice test
Statement: Ivory started a new startup. We know for a fact that almost all startups fail within the first 2 years. 
Conclusion: Ivory's startup will fail.
Does the conclusion follow from the statement?

Medium

Hiring Developer
Skewed Data
Graph
Try practice test
Two companies A and B hired developers from the year 2001 to 2005. The given bar graph shows the hiring details. 
 image
 image
Now select the statements that are true based on the given details.

A: The data given for Company A is skewed to the left.
B: The data given for Company B is skewed to the right.
C: The data given for Company A is skewed to the right.
D: For Company B, mean and mode are equal.
E: For Company B, mean is equal to median but less than mode.
F: For Company A, median is less than mode but greater than mean.

Medium

Negative correlation
Try practice test
Saffi, one of the popular schools in San Francisco did a school wide study of the students in middle school. The study found that there is a negative correlation between the time spent on Facebook per day by students and their academic achievement. How can we understand the results of this study?
A: An increase in time spent on Facebook per day causes a drop in the academic achievement of students at the middle school level.

B: There is an association between an increase in time spent on Facebook per day and the drop in the academic achievement of students at Saffi. 

C: An increase in the time spent on Facebook per day causes a drop in the academic achievement of students at Saffi. 

D: There is an association between an increase in time spent on Facebook per day and the drop in the academic achievement of students at the middle school level.
🧐 Question🔧 Skill

Medium

Dividends
Financial Analysis
Percentage and Average Calculations

3 mins

Data Interpretation
Try practice test

Medium

Laptop Brands
Proportions and Percentages
Financial Reasoning

2 mins

Data Interpretation
Try practice test

Hard

Median
Trend Analysis
Statistical Reasoning

3 mins

Data Interpretation
Try practice test

Medium

Claims for a new drug Xylanex
Critical Thinking
Evaluating Arguments
Identifying Assumptions

2 mins

Critical Thinking
Try practice test

Medium

Emma's cafe business

2 mins

Critical Thinking
Try practice test

Medium

Ivory's new startup

2 mins

Critical Thinking
Try practice test

Medium

Hiring Developer
Skewed Data
Graph

3 mins

Data Analysis
Try practice test

Medium

Negative correlation

2 mins

Data Analysis
Try practice test
🧐 Question🔧 Skill💪 Difficulty⌛ Time
Dividends
Financial Analysis
Percentage and Average Calculations
Data Interpretation
Medium3 mins
Try practice test
Laptop Brands
Proportions and Percentages
Financial Reasoning
Data Interpretation
Medium2 mins
Try practice test
Median
Trend Analysis
Statistical Reasoning
Data Interpretation
Hard3 mins
Try practice test
Claims for a new drug Xylanex
Critical Thinking
Evaluating Arguments
Identifying Assumptions
Critical Thinking
Medium2 mins
Try practice test
Emma's cafe business
Critical Thinking
Medium2 mins
Try practice test
Ivory's new startup
Critical Thinking
Medium2 mins
Try practice test
Hiring Developer
Skewed Data
Graph
Data Analysis
Medium3 mins
Try practice test
Negative correlation
Data Analysis
Medium2 mins
Try practice test
Reason #4

1200+ customers in 75 countries

customers in 75 countries
Brandon

Adaface を使用することで、最初の選考プロセスを 75% 以上最適化することができ、採用担当マネージャーと人材獲得チームの両方にとって貴重な時間を同様に解放することができました。


Brandon Lee, 人々の責任者, Love, Bonito

Try practice test
Reason #5

Designed for elimination, not selection

The most important thing while implementing the pre-employment データストーリーテリングテスト in your hiring process is that it is an elimination tool, not a selection tool. In other words: you want to use the test to eliminate the candidates who do poorly on the test, not to select the candidates who come out at the top. While they are super valuable, pre-employment tests do not paint the entire picture of a candidate’s abilities, knowledge, and motivations. Multiple easy questions are more predictive of a candidate's ability than fewer hard questions. Harder questions are often "trick" based questions, which do not provide any meaningful signal about the candidate's skillset.

Science behind Adaface tests
Reason #6

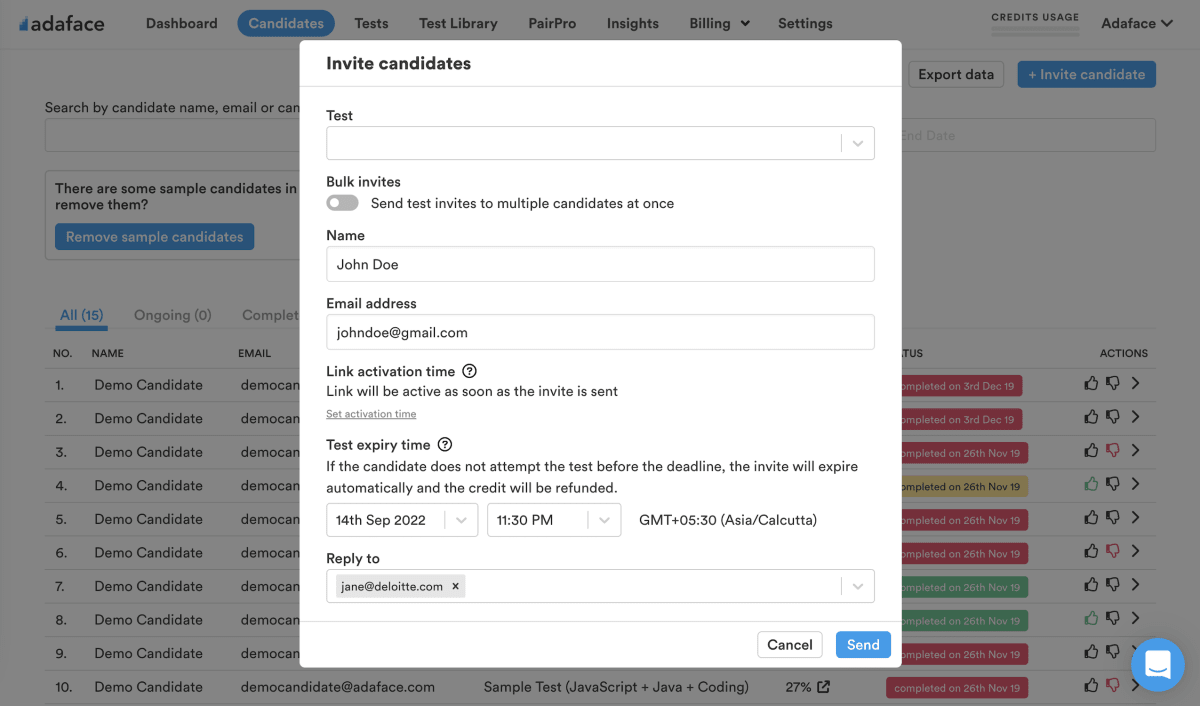
1 click candidate invites

Email invites: You can send candidates an email invite to the データストーリーテリングテスト from your dashboard by entering their email address.

Public link: You can create a public link for each test that you can share with candidates.

API or integrations: You can invite candidates directly from your ATS by using our pre-built integrations with popular ATS systems or building a custom integration with your in-house ATS.

invite candidates
Reason #7

Detailed scorecards & benchmarks

サンプルスコアカードを表示します
Try practice test
Reason #8

High completion rate

Adaface tests are conversational, low-stress, and take just 25-40 mins to complete.

This is why Adaface has the highest test-completion rate (86%), which is more than 2x better than traditional assessments.

test completion rate
Reason #9

Advanced Proctoring


Learn more

About the Data Storytelling Online Test

Why you should use Pre-employment Data Storytelling Test?

The データストーリーテリングテスト makes use of scenario-based questions to test for on-the-job skills as opposed to theoretical knowledge, ensuring that candidates who do well on this screening test have the relavant skills. The questions are designed to covered following on-the-job aspects:

  • ストーリーのコンテキストでデータを解釈および分析する能力
  • グラフとチャートの作成と提示の習熟度
  • データを効果的に整理および伝達するための構造化された思考スキル
  • データの洞察を効果的に伝えるための強力なコミュニケーションスキル
  • データの解釈と分析に批判的思考を適用する能力
  • データ分析の手法と方法論の習熟度
  • さまざまなデータ視覚化手法の理解と利用
  • さまざまな利害関係者にデータ結果を効果的に提示する能力
  • 統計分析の知識とデータ解釈のためのツール
  • データストーリーテリングフレームワークを使用して、関与および説得する習熟度

Once the test is sent to a candidate, the candidate receives a link in email to take the test. For each candidate, you will receive a detailed report with skills breakdown and benchmarks to shortlist the top candidates from your pool.

What topics are covered in the Data Storytelling Test?

  • グラフとチャート

    グラフとチャートは、情報の理解と比較を簡単にできるデータの視覚的表現です。テストでこのスキルを測定することで、候補者がさまざまなタイプのグラフやチャートの作成と解釈に熟練することが保証されます。これは、効果的なデータ分析とプレゼンテーションに不可欠です。

  • 構造化された思考

    構造化された思考体系的な方法で情報を整理して論理的に分析する能力です。テストでこのスキルを評価することで、候補者は、データ駆動型の決定を下すために重要であり、明確で組織化された思考プロセスで複雑な問題にアプローチできるようになります。

  • コミュニケーションスキル

    コミュニケーションスキルを参照情報やアイデアを他の人に効果的に伝える能力に。テストでこのスキルを測定することで、候補者はデータ分析から導き出された洞察を明確かつ簡潔に伝え、チームメンバー間の効果的なコラボレーションと理解を可能にすることができます。

  • プレゼンテーションスキル

    プレゼンテーションスキルに明確で魅力的で視覚的に魅力的な方法で情報を提供する能力。テストのこのスキルを評価することにより、候補者は複雑なデータを効果的に伝達し、視聴者のエンゲージメントと理解を促進する説得力のあるプレゼンテーションを作成できます。意味のある洞察を抽出するデータの感覚。テストでこのスキルを測定することで、候補者がデータを正確に解釈し、パターンと傾向を特定し、データ駆動型の意思決定に不可欠な関連する結論を導き出すことができます。 >批判的思考とは、さまざまな視点と潜在的なバイアスを考慮して、情報と議論を論理的かつ客観的に評価する能力を指します。テストのこのスキルを評価することで、候補者がデータを批判的に分析し、情報に基づいた判断を下し、データ分析の潜在的な欠陥または制限を特定できるようになります。

  • データ分析

    データ分析には、データと洞察を明らかにするために、データを検査、クリーニング、変換、およびモデリングします。テストでこのスキルを測定することで、候補者がさまざまな分析技術とツールを使用し、データを効果的に分析し、意味のある結論を引き出すことができるようになります。

  • Full list of covered topics

    The actual topics of the questions in the final test will depend on your job description and requirements. However, here's a list of topics you can expect the questions for データストーリーテリングテスト to be based on.

    ラインチャート
    棒グラフ
    円グラフ
    プロットを散布します
    エリアチャート
    バブルチャート
    ヒストグラム
    積み重ねられたチャート
    ボックスプロット
    ツリーマップ
    滝チャート
    ガントチャート
    パレートチャート
    サンキー図
    ヒートマップ
    データ視覚化の原則
    データソースの理解
    データフォーマット
    データクリーニング
    データ変換
    データ集約
    データフィルタリング
    データ検証
    データ解釈手法
    データ駆動型のストーリーテリング
    効果的なデータ通信
    適切なビジュアルの選択
    データの物語を提示します
    構造化された思考
    問題解決
    意思決定
    データのバイアスの識別
    データ分析手法
    統計分析
    データモデリング
    データマイニング
    回帰分析
    相関分析
    仮説テスト
    データ視覚化ツール
    データ分析ソフトウェア
    データストーリーテリングフレームワーク
    データストーリーテリングの例
    データ駆動型の意思決定
    データ解釈のベストプラクティス
    データ分析における批判的思考
    複雑なデータシナリオの分析
    データの傾向の解釈
    データパターンの識別
    意味のある洞察を描く
    データ品質評価
    データ視覚化ケーススタディ
    データ分析ケーススタディ
    データストーリーテリングケーススタディ
Try practice test

What roles can I use the Data Storytelling Test for?

  • データアナリスト
  • ビジネスインテリジェンス開発者
  • ビジネスアナリスト
  • データサイエンティスト
  • コンテンツストラテジスト
  • データエンジニア
  • データウェアハウスマネージャー
  • HRマネージャー
  • リクルーター

How is the Data Storytelling Test customized for senior candidates?

For intermediate/ experienced candidates, we customize the assessment questions to include advanced topics and increase the difficulty level of the questions. This might include adding questions on topics like

  • 意思決定のためにデータ駆動型分析を実施した経験
  • 複雑なデータセットから関連する洞察を識別して抽出する能力
  • データ操作と変換技術の知識
  • データの視覚化ツールとソフトウェアに精通しています
  • インパクトのある物語を作成するためのデータストーリーテリングテクニックの習熟度
  • データソースを批判的に評価し、データの整合性を確保する能力
  • 仮説検査の経験と統計的有意性
  • データクレンジングおよび前処理技術の習熟度
  • データマイニングと抽出技術の知識
  • データ駆動型の推奨事項を効果的に伝達する能力
Singapore government logo

採用担当者は、パネル面接中に尋ねる専門的な質問を通じて、どの候補者がより良いスコアを持っているかを判断し、スコアがそれほど高くない候補者と区別できると感じました。彼らです 非常に満足 Adaface のスクリーニングで最終候補者リストに選ばれた候補者の質を重視します。


85%
スクリーニング時間の短縮

Data Storytelling Hiring Test よくある質問

複数のスキルを1つのカスタム評価に組み合わせることはできますか?

そのとおり。カスタム評価は、職務内容に基づいて設定され、指定したすべての必須スキルに関する質問が含まれます。

アンチチートまたは監督の機能はありますか?

次のアンチチート機能があります。

  • グーグル不可能な質問
  • IP監督
  • Webの提案
  • ウェブカメラの監督
  • 盗作の検出
  • 安全なブラウザ

[プロクチャリング機能](https://www.adaface.com/proctoring)の詳細をご覧ください。

テストスコアを解釈するにはどうすればよいですか?

留意すべき主なことは、評価が選択ツールではなく排除ツールであることです。スキル評価が最適化され、技術的にその役割の資格がない候補者を排除するのに役立ちます。これは、役割の最良の候補者を見つけるのに役立つために最適化されていません。したがって、評価を使用する理想的な方法は、しきい値スコア(通常は55%、ベンチマークを支援します)を決定し、インタビューの次のラウンドのしきい値を超えてスコアを上回るすべての候補者を招待することです。

このテストを使用できますか?

各ADAFACE評価は、職務記述書/理想的な候補者のペルソナにカスタマイズされます(当社の主題の専門家は、10000以上の質問のライブラリからあなたの評価に適切な質問を選択します)。この評価は、あらゆる経験レベルでカスタマイズできます。

すべての候補者は同じ質問を受け取りますか?

私は候補者です。練習テストを試すことはできますか?

いいえ。残念ながら、現時点では練習テストをサポートしていません。ただし、[サンプルの質問](https://www.adaface.com/questions)を使用するには、練習できます。

このテストを使用するコストはいくらですか?

無料トライアルを受けることはできますか?

私はちょうど有料プランに移りました。カスタム評価をリクエストするにはどうすればよいですか?

customers across world
Join 1200+ companies in 75+ countries.
今日、最も候補者のフレンドリーなスキル評価ツールをお試しください。
g2 badges
Ready to use the Adaface データストーリーテリングテスト?
私たちとしゃべる
ada
Ada
● Online
✖️