
Probability interview questions for freshers
1. Imagine you have a bag with red and blue balls. If you pick one without looking, which color are you more likely to pick?
2. If you flip a coin, what are the chances it lands on heads?
3. You have a spinner with equal sections of different colors. What's the chance it lands on your favorite color?
4. What does probability even mean? Can you explain it in simple words?
5. Let's say you roll a six-sided die. What is the probability of rolling a four?
6. If you have two dice, what's the probability that both dice show the same number?
7. You have a standard deck of playing cards. What's the probability of drawing an ace?
8. There are five different doors, and only one leads to candy. If you pick a door at random, what's the chance you get candy?
9. If you keep flipping a coin many times, will you always get exactly half heads and half tails?
10. Is it possible for something to have a 0% chance of happening? What about a 100% chance?
11. You are guessing a number between one and ten. What are your odds of guessing correctly on the first try?
12. What is more likely: flipping a coin three times and getting heads every time, or flipping it five times and getting heads every time?
13. You have two bags. One has five red balls, and the other has five blue balls. If you pick one ball from each bag without looking, what is the chance you'll get one red and one blue ball?
14. A weather forecast says there is a 60% chance of rain tomorrow. What does that mean to you?
15. Explain the difference between something being "likely" and something being "certain."
16. If a lottery has a very low chance of winning, why do people still play?
17. If you draw two cards from a deck, is getting an ace on the first draw independent of getting an ace on the second draw?
18. Imagine you're playing a game where you need to roll a die and get a number greater than four. What is the chance of that happening?
19. If you have two spinners, each divided into equal sections of red, blue, and green, what are the chances that both spinners land on the same color?
20. What's the difference between probability and possibility?
21. Is it possible to predict the future with certainty? How does probability relate to that?
22. Suppose there's a promotion where a store gives a free gift to every tenth customer. What's the probability you'll be the lucky customer to get a free gift?
23. A teacher tells you that half of the class will get an A on a test. Does this mean that if you study really hard, you are guaranteed to get an A?
24. Let us say there are two friends, Sam and Mary. Sam says 'the chance of rain is 50% today and 50% tomorrow, so it WILL rain!' and Mary says 'That is wrong!'. Who do you think is right and why?
Probability interview questions for juniors
1. Imagine you have a bag with only red and blue marbles. If you pick one without looking, which color are you more likely to pick, and why?
2. If you flip a coin, what are the chances it lands on heads?
3. You have a spinner with equal sections of different colors. What's the chance it lands on your favorite color?
4. There are different toys in a box. If you close your eyes and pick one, which toy is least likely to be picked?
5. If it rained a lot yesterday, is it more or less likely to rain today? Why do you think so?
6. If you roll a die, what numbers could you possibly get?
7. You have a jar of candies, mostly lollipops. Are you more likely to pick a lollipop or a gummy bear?
8. If you're playing a game, and you need to roll a '6' to win, is it likely you'll win on your next turn?
9. Let's say you have a deck of cards. What's the probability of drawing a heart suit card?
10. You have two bags. One with a few chocolates, the other with many. Which bag gives you a better chance of grabbing a chocolate?
11. If you have a row of cats and dogs, and you close your eyes and point, are you more likely to point at a cat or a dog?
12. You're throwing darts at a balloon. How likely are you to pop the balloon on your first try?
13. If you are picking a random shape from a mix of circles and triangles, which shape will you choose if there are more triangles?
14. What are the odds of picking a Monday if someone asks you to randomly pick a day of the week?
15. If you are about to pick an object out of a box of balls, what information would help you know the probability of picking a red ball?
16. What is more probable: Picking the only apple in a box of oranges, or picking one of the oranges?
17. You have a set of building blocks with many triangles and very few squares. If someone asks you to close your eyes and pick one, which one are you more likely to pick?
18. What is more likely: That you pick a red sock from a drawer full of blue socks, or that you pick a blue sock?
19. If there are clouds gathering, does that mean it will definitely rain?
20. You have a bunch of toys. Some are big and some are small. If there are more small toys, which kind are you more likely to grab?
21. If you have a box full of different kinds of candies, and you are asked to pick a yellow candy, what do you need to know to estimate this probability?
22. What is more likely, to randomly pick your favorite toy out of a pile of toys, or to not pick your favorite toy?
23. Imagine you are choosing a ball in a group of different colored balls. What must be true about the number of balls to ensure there is a high likelihood of you picking a blue ball?
24. What is more probable, that your friend chooses vanilla over chocolate, if you know most of their friends like chocolate?
25. If you see a lot of birds flying south, does it mean that winter is definitely coming?
26. You have a set of dolls with different colors. Is it more likely that you pick a red doll or any other colored doll?
Probability intermediate interview questions
1. You have two coins. One is fair, and the other always lands on heads. If you pick a coin at random and flip it twice, and it lands heads both times, what is the probability you picked the unfair coin?
2. There are 100 lockers and 100 students. The first student opens all the lockers. The second student closes every second locker. The third student changes every third locker (closes if open, opens if closed). The fourth student changes every fourth locker, and so on. After all 100 students have gone through, how many lockers are open?
3. A stick is broken randomly into three pieces. What is the probability that you can form a triangle out of those three pieces?
4. You have 25 horses, and you want to find the fastest 3 horses. You can race 5 horses at a time. What is the minimum number of races required to determine the fastest 3?
5. A city has two taxi companies: Blue and Green. 85% of the taxis are Green and 15% are Blue. A witness identifies a taxi as Blue. The court tests the witness and finds they correctly identify the color 80% of the time and misidentify it 20% of the time. What is the probability that the taxi was actually Blue?
6. You are given a shuffled deck of cards. You turn over the cards one by one. At any point, you can guess that the next card is the Ace of Spades. What strategy maximizes your probability of guessing correctly, and what is the probability of success with that strategy?
7. Two players take turns flipping a fair coin. The first player to flip heads wins. What is the probability that the first player wins?
8. You have two light bulbs and a 100-story building. You want to find the highest floor from which a bulb will not break when dropped. What is the optimal strategy to minimize the worst-case number of drops?
9. A bag contains one counter, known to be either white or black. A white counter is put in, and then a counter is drawn at random which proves to be white. What is the probability that the original counter was white?
10. You have two ropes. Each rope takes exactly one hour to burn completely, but they don't burn at a constant rate. How can you measure exactly 45 minutes using only these two ropes and a lighter?
11. Two cars start at the same point and travel in perpendicular directions. One car travels at 40 mph and the other at 30 mph. How far apart are they after 2 hours?
12. You have a drawer with 12 black socks and 12 white socks. You randomly pull out socks without looking. What is the minimum number of socks you must pull out to guarantee you have a matching pair?
13. What is the probability that a randomly chosen leap year contains 53 Sundays?
14. You have a circular pizza. You make three straight cuts across the pizza. What is the maximum number of pieces you can create?
15. A fair coin is flipped 10 times. What is the probability of getting exactly 5 heads?
16. You roll two fair six-sided dice. What is the probability that the sum of the numbers rolled is 7?
17. You have two jars. One jar contains 50 red marbles and 50 blue marbles. The other jar contains 100 red marbles. How can you distribute the marbles into the two jars to maximize your chance of picking a red marble if you randomly choose a jar and then randomly choose a marble from that jar?
18. You are given a biased coin that lands heads with probability 0.7. You flip it twice. What is the probability of getting one head and one tail?
19. There are three boxes. One contains only apples, one contains only oranges, and one contains both apples and oranges. The boxes are labeled incorrectly such that no label identifies the actual contents of the box it describes. By opening just one box, and without looking into the box, you take out one piece of fruit. By looking at the fruit, how can you immediately label all of the boxes correctly?
20. A drunk man is standing in the middle of a bridge. He takes a step forward or backward with equal probability. He will fall off the bridge if he takes N steps in either direction. What is the probability he survives after taking K steps, where K < N?
21. Given 12 balls, 11 of which are of equal weight and one of which is of different weight. How can you identify the different ball and determine whether it is lighter or heavier in just 3 weighings using a balance scale?
22. You have a bag with n balls. You pick a ball, look at it and return it to the bag. You do this k times. What is the probability that you have seen every ball at least once?
23. There are two envelopes. One contains twice the amount of money as the other. You choose one envelope at random and open it, finding $100. You are then given the option to switch to the other envelope. Should you switch? Explain your reasoning.
Probability interview questions for experienced
1. How would you model the probability of a user clicking on an ad, given various user features and ad characteristics?
2. Describe a scenario where Bayesian A/B testing would be preferred over frequentist A/B testing, and why?
3. Explain how you would estimate the probability of a rare event, given a limited dataset.
4. How do you approach a probability problem when the underlying distribution is unknown?
5. Design a system to detect fraudulent transactions using probabilistic methods.
6. What are some common biases in probability estimation, and how can you mitigate them?
7. How would you explain the concept of a p-value to a non-technical audience?
8. Discuss the trade-offs between precision and recall in the context of a probabilistic classification model.
9. How can Markov Chain Monte Carlo (MCMC) methods be used to solve complex probability problems?
10. Describe a situation where you would use a Hidden Markov Model (HMM) to model a sequence of events.
11. Explain the difference between conditional probability and joint probability, and provide examples.
12. How would you handle missing data when calculating probabilities?
13. Design a probabilistic model to predict customer churn.
14. How do you validate a probabilistic model to ensure its accuracy and reliability?
15. Explain the concept of entropy and its relevance in information theory and probability.
16. How would you simulate a real-world process using Monte Carlo simulation?
17. Describe the limitations of using probability to make decisions in uncertain environments.
18. How would you combine multiple probabilistic models to improve prediction accuracy?
19. Explain how you would use probability to optimize a supply chain.
20. Design a system to estimate the probability of equipment failure in a manufacturing plant.
21. How do you deal with non-stationary data when building probabilistic models?
22. Describe a situation where you would use a Bayesian network to model dependencies between variables.
23. How would you use probability to personalize recommendations for users on an e-commerce website?
24. Explain the concept of a confidence interval and its interpretation.
25. How would you design an experiment to measure the effectiveness of a new drug using probabilistic methods?
26. Describe the challenges of applying probability theory to real-world problems.
27. How would you use probability to detect anomalies in a network security system?
28. Explain how the law of large numbers applies in practical scenarios.
29. How can probability theory be used to enhance machine learning algorithms?

When evaluating candidates, especially for roles in data science or analytics, understanding their grasp of probability is critical. Probability skills, like importance of problem solving skills in the workplace, enable professionals to make informed decisions and predictions based on data.
This blog post provides a curated list of probability interview questions, spanning from freshers to experienced candidates. These questions are designed to assess a candidate's understanding of probability concepts and their ability to apply these concepts in real-world scenarios.
By using these questions, you can ensure that you are hiring candidates with a solid foundation in probability. For a data-driven way to assess candidates, consider using Adaface's probability online test before interviews.
Table of contents
Probability interview questions for freshers
Probability interview questions for juniors
Probability intermediate interview questions
Probability interview questions for experienced
Probability MCQ
Which Probability skills should you evaluate during the interview phase?
Ace Your Hiring with Probability Skills Tests and Targeted Interview Questions
Download Probability interview questions template in multiple formats
Probability interview questions for freshers
1. Imagine you have a bag with red and blue balls. If you pick one without looking, which color are you more likely to pick?
It depends on the number of red and blue balls in the bag. If there are more red balls, you are more likely to pick a red ball. If there are more blue balls, you are more likely to pick a blue ball. If there are an equal number of red and blue balls, you have an equal chance of picking either color.
2. If you flip a coin, what are the chances it lands on heads?
Assuming it's a fair coin, the chances of it landing on heads are 50%, or 1/2. This is based on the principle that a fair coin has two equally likely outcomes: heads or tails.
3. You have a spinner with equal sections of different colors. What's the chance it lands on your favorite color?
The chance of the spinner landing on your favorite color depends on the number of sections on the spinner. Assuming each section has an equal chance of being landed on, the probability is calculated as follows:
Probability = (Number of sections with your favorite color) / (Total number of sections). If there's only one section with your favorite color, then Probability = 1 / (Total number of sections).
4. What does probability even mean? Can you explain it in simple words?
Probability, in simple terms, is how likely something is to happen. It's a way of measuring uncertainty. We often express it as a number between 0 and 1, where 0 means it's impossible, and 1 means it's certain. For example, if you flip a fair coin, the probability of getting heads is 0.5, meaning there's a 50% chance it will happen.
Think of it as the ratio of favorable outcomes to the total possible outcomes. If you roll a six-sided die, the probability of rolling a '4' is 1/6, because there's only one '4' on the die, and there are six possible numbers you could roll.
5. Let's say you roll a six-sided die. What is the probability of rolling a four?
The probability of rolling a four on a standard six-sided die is 1/6.
This is because there is only one face with a four, and there are six equally likely possible outcomes (1, 2, 3, 4, 5, or 6). Probability is calculated as (number of favorable outcomes) / (total number of possible outcomes).
6. If you have two dice, what's the probability that both dice show the same number?
There are 6 possible outcomes where both dice show the same number: (1,1), (2,2), (3,3), (4,4), (5,5), and (6,6). A standard six-sided die has 6 possible outcomes. When rolling two dice, there are 6 * 6 = 36 total possible outcomes. Therefore, the probability that both dice show the same number is 6/36, which simplifies to 1/6.
7. You have a standard deck of playing cards. What's the probability of drawing an ace?
There are 52 cards in a standard deck. There are 4 aces (one in each suit: hearts, diamonds, clubs, and spades). Therefore, the probability of drawing an ace is the number of aces divided by the total number of cards.
The probability is 4/52, which simplifies to 1/13 or approximately 7.69%.
8. There are five different doors, and only one leads to candy. If you pick a door at random, what's the chance you get candy?
The chance of picking the door that leads to candy is 1 out of 5. Since there is only one correct door out of five total doors, the probability is simply 1/5 or 20%.
9. If you keep flipping a coin many times, will you always get exactly half heads and half tails?
No, you won't always get exactly half heads and half tails. While the probability of getting heads or tails on a single coin flip is close to 50% (assuming a fair coin), this probability applies to each individual flip. Over a large number of flips, the law of large numbers suggests that the proportion of heads and tails will approach 50%, but it doesn't guarantee an exact split.
Randomness implies variation. It's entirely possible to have deviations, such as getting slightly more heads than tails, even with many flips. The more flips you do, the closer the proportions are likely to be to 50/50, but it's not guaranteed. The absolute difference between the number of heads and tails might even increase, even as the relative difference (the proportion) decreases.
10. Is it possible for something to have a 0% chance of happening? What about a 100% chance?
Yes, it's theoretically possible for something to have a 0% chance of happening and also a 100% chance.
A 0% chance means the event is impossible under the given conditions or assumptions. For instance, drawing a red card from a standard deck of cards and it being the queen of spades is impossible in a single draw. A 100% chance means the event is certain to happen under those conditions. For example, drawing any card from a standard deck of cards will always happen when a card is drawn.
11. You are guessing a number between one and ten. What are your odds of guessing correctly on the first try?
Your odds of guessing correctly on the first try are 1 in 10, or 10%. Since there are ten possible numbers (1 through 10), and only one of them is the correct answer, you have a one-tenth chance of guessing it right away.
12. What is more likely: flipping a coin three times and getting heads every time, or flipping it five times and getting heads every time?
Getting heads three times in a row is more likely. The probability of getting heads three times in a row is (1/2) * (1/2) * (1/2) = 1/8. The probability of getting heads five times in a row is (1/2) * (1/2) * (1/2) * (1/2) * (1/2) = 1/32. Since 1/8 is greater than 1/32, flipping a coin three times and getting heads every time is more likely.
13. You have two bags. One has five red balls, and the other has five blue balls. If you pick one ball from each bag without looking, what is the chance you'll get one red and one blue ball?
The probability of picking a red ball from the first bag is 5/5 = 1. The probability of picking a blue ball from the second bag is 5/5 = 1. Since these are independent events, the probability of both happening is (5/5) * (5/5) = 1 * 1 = 1 or 100%. Therefore, you are guaranteed to get one red and one blue ball.
Another way to look at it is since the first bag only contains red balls, you must pick a red ball. Similarly, the second bag only contains blue balls, you must pick a blue ball. Thus, you must get one red and one blue.
14. A weather forecast says there is a 60% chance of rain tomorrow. What does that mean to you?
A 60% chance of rain tomorrow means that, based on historical data and current weather patterns, there is a 60% probability of measurable precipitation (usually 0.01 inches or more) occurring at any given point within the forecast area during the specified time period (tomorrow). It doesn't mean that 60% of the area will experience rain, or that it will rain for 60% of the day.
Instead, envision many days with similar weather conditions. In 60 out of 100 of those days, rain would occur somewhere within the forecast area. It’s a probability assessment, not a certainty, meaning there's still a 40% chance it won't rain.
15. Explain the difference between something being "likely" and something being "certain."
"Likely" implies a high probability of something occurring, but it's not guaranteed. There's a chance, however small, that it won't happen. "Certain," on the other hand, means there is absolutely no doubt; the event will occur. It's a definitive outcome.
For instance, a weather forecast might say it's "likely" to rain, meaning there's a strong chance of precipitation. But it's not "certain" to rain; conditions could change, and the rain might not materialize. However, it is "certain" that if you divide a number by itself (excluding zero), the result will be 1. No matter what number you pick (e.g., in Python: x / x where x != 0), the result will always be 1.
16. If a lottery has a very low chance of winning, why do people still play?
People play the lottery despite the low odds due to a few key psychological factors. The small cost of a ticket provides the possibility of a life-changing reward, triggering hope and excitement. This hope, combined with the availability heuristic (easily imagining winning because of media coverage), makes the improbable seem more attainable.
Furthermore, the lottery can be a form of entertainment or escapism. For a brief period, players can dream about what they would do with the winnings, offering a temporary relief from everyday concerns. The potential gains far outweigh the relatively minor financial loss for many individuals.
17. If you draw two cards from a deck, is getting an ace on the first draw independent of getting an ace on the second draw?
No, getting an ace on the first draw is not independent of getting an ace on the second draw (without replacement). These events are dependent.
Here's why: The outcome of the first draw changes the composition of the remaining deck. If an ace is drawn on the first draw, there are fewer aces left for the second draw, thereby changing the probability of getting an ace on the second draw. If an ace is not drawn on the first draw, there are the same number of aces still left, changing the probability of getting an ace on the second draw, albeit in the opposite direction. Independence requires that the probability of the second event remains unchanged regardless of the first event's outcome.
18. Imagine you're playing a game where you need to roll a die and get a number greater than four. What is the chance of that happening?
A standard die has six sides, numbered 1 through 6. To roll a number greater than four, you need to roll either a 5 or a 6. That's two favorable outcomes. The probability is calculated as (number of favorable outcomes) / (total number of possible outcomes). Therefore, the chance of rolling a number greater than four is 2/6, which simplifies to 1/3 or approximately 33.33%.
19. If you have two spinners, each divided into equal sections of red, blue, and green, what are the chances that both spinners land on the same color?
Each spinner has three equally likely outcomes: red, blue, or green. For the first spinner, the color doesn't matter. We only care that the second spinner matches the first. The probability of the second spinner matching the color of the first spinner is 1/3. This is because there are three possible colors, and only one of them will match.
Therefore, the probability of both spinners landing on the same color is 1/3.
20. What's the difference between probability and possibility?
Probability quantifies the likelihood of an event occurring, assigning a numerical value between 0 and 1 (or 0% to 100%). It deals with how likely something is to happen based on observed frequencies or theoretical models. A probability of 0 means the event is impossible, and a probability of 1 means the event is certain.
Possibility, on the other hand, simply indicates whether an event can occur. It's a binary concept: something is either possible or it isn't. Possibility doesn't assign a degree of likelihood; it only states that the event is not ruled out. For example, it's possible to win the lottery, even though the probability is extremely low. Essentially, if the probability of an event is greater than 0, it is possible.
21. Is it possible to predict the future with certainty? How does probability relate to that?
No, it is generally not possible to predict the future with certainty. The world is complex and influenced by countless factors, many of which are unknown or inherently unpredictable due to chaos theory and emergent behavior.
Probability provides a framework for dealing with this uncertainty. Instead of claiming to know the future, we can estimate the likelihood of different outcomes based on available data and models. A higher probability suggests a greater likelihood, but it never guarantees that outcome will occur. Probability allows us to quantify and manage risk, even when certainty is unattainable.
22. Suppose there's a promotion where a store gives a free gift to every tenth customer. What's the probability you'll be the lucky customer to get a free gift?
The probability of being the customer to get a free gift is 1/10, or 10%. This assumes that each customer has an equal chance of being the next customer to enter the store. The promotion states that every tenth customer receives a gift, so the chance of being that lucky customer is simply one in ten.
23. A teacher tells you that half of the class will get an A on a test. Does this mean that if you study really hard, you are guaranteed to get an A?
No, simply studying hard doesn't guarantee an A. The teacher's statement indicates the proportion of students who will receive an A, not a promise for any individual. Many factors influence your grade, including:
- Your inherent understanding of the material.
- The difficulty of the test.
- The performance of other students in the class (as grading might be curved).
- Errors or misinterpretations on the test, regardless of effort.
While studying hard significantly increases your probability of getting an A, it's not a certainty. You might perform well but still fall within the other half of the class.
24. Let us say there are two friends, Sam and Mary. Sam says 'the chance of rain is 50% today and 50% tomorrow, so it WILL rain!' and Mary says 'That is wrong!'. Who do you think is right and why?
Mary is right. Sam's logic is flawed. The probability of rain is independent for each day. Saying it will rain because there's a 50% chance each day is incorrect.
To illustrate, consider flipping a coin twice. There's a 50% chance of heads each time, but that doesn't guarantee you'll get heads at least once. There is a chance you'll get tails both times.
Probability interview questions for juniors
1. Imagine you have a bag with only red and blue marbles. If you pick one without looking, which color are you more likely to pick, and why?
You're more likely to pick the color that has more marbles in the bag. For example, if there are 7 red marbles and 3 blue marbles, you are more likely to pick a red marble because there are more of them. The probability of picking a particular color is directly proportional to the number of marbles of that color relative to the total number of marbles.
2. If you flip a coin, what are the chances it lands on heads?
Assuming a fair coin, the chances of it landing on heads are 50%, or 1/2. This is because a fair coin has two sides, heads and tails, and each side has an equal probability of landing face up. Therefore, one out of two possible outcomes is heads.
3. You have a spinner with equal sections of different colors. What's the chance it lands on your favorite color?
The probability of the spinner landing on your favorite color depends on the number of sections on the spinner. Assuming all sections are of equal size, the probability is calculated as:
1 / (total number of sections)
For example, if the spinner has 4 equal sections, the chance of landing on your favorite color is 1/4 or 25%. If there are 6 sections, the probability is 1/6, and so on.
4. There are different toys in a box. If you close your eyes and pick one, which toy is least likely to be picked?
The toy that appears the least number of times in the box is least likely to be picked. For instance, if there are 10 toy cars and 1 toy truck, the toy truck is least likely to be picked.
More generally, the probability of picking a specific toy is proportional to its frequency within the box. Therefore, a toy with a lower frequency has a lower probability of being selected.
5. If it rained a lot yesterday, is it more or less likely to rain today? Why do you think so?
It's generally neither more nor less likely to rain today simply because it rained yesterday. Weather patterns are complex and influenced by many factors. While a period of consecutive rainy days can happen (due to a persistent weather system), yesterday's rain itself doesn't directly increase or decrease today's chances.
However, depending on the specific meteorological context, there might be a slight tendency. For example, if a large, slow-moving weather system brought the rain yesterday, it might still be in the area today, leading to a slightly higher chance of rain. But if the rain was a short, isolated thunderstorm, then yesterday's event would be unrelated to today's weather.
6. If you roll a die, what numbers could you possibly get?
If you roll a standard six-sided die, you could possibly get the numbers 1, 2, 3, 4, 5, or 6.
The possible outcomes are a discrete set of integers ranging from 1 to 6 inclusive.
7. You have a jar of candies, mostly lollipops. Are you more likely to pick a lollipop or a gummy bear?
You are more likely to pick a lollipop. The question states that the jar is mostly lollipops, implying that lollipops make up a larger proportion of the candies than gummy bears (or any other type of candy). Therefore, the probability of selecting a lollipop is higher.
8. If you're playing a game, and you need to roll a '6' to win, is it likely you'll win on your next turn?
No, it's not particularly likely you'll win on your next turn. Assuming a fair six-sided die, the probability of rolling a 6 is 1/6, or approximately 16.67%. This means there's an approximately 83.33% chance you won't roll a 6.
While every roll is independent, meaning previous rolls don't affect the outcome of the next one, the odds remain the same. So, while it's certainly possible to roll a 6 and win, it's statistically more probable that you won't.
9. Let's say you have a deck of cards. What's the probability of drawing a heart suit card?
There are 52 cards in a standard deck. There are 13 cards that are hearts. The probability of drawing a heart is the number of hearts divided by the total number of cards. Therefore, the probability is 13/52, which simplifies to 1/4 or 25%.
10. You have two bags. One with a few chocolates, the other with many. Which bag gives you a better chance of grabbing a chocolate?
The bag with fewer chocolates gives you a better chance of grabbing a chocolate. Chance is defined as probability of an event happening. If one bag contains a finite number of chocolates and the other contains infinite number of chocolates, the probability of selecting a chocolate from the bag with finite number of chocolates is greater than selecting a chocolate from the bag with infinite number of chocolates, because a probability is always finite.
However, this relies on the specific definition of 'many'. If both bags contain a finite number of chocolates, say Bag A has 3 chocolates and Bag B has 1000 chocolates, then Bag A (with fewer chocolates) gives you a better chance of grabbing a chocolate if your goal is simply to grab a chocolate. Your chances are 100% in either case. If the question implies to have a higher probability of successfully grabbing a chocolate, any potential difficulty in grabbing would be assumed to be equal in both cases.
11. If you have a row of cats and dogs, and you close your eyes and point, are you more likely to point at a cat or a dog?
Without knowing the relative proportions of cats and dogs in the row, you can't determine the probability. If there are equal numbers of cats and dogs, the probability of pointing at either is 50%. If there are significantly more dogs than cats, you're more likely to point at a dog, and vice versa.
Therefore, the answer is: It depends on the ratio of cats to dogs. You need that information to determine the likelihood.
12. You're throwing darts at a balloon. How likely are you to pop the balloon on your first try?
The probability of popping the balloon on the first try is impossible to determine without more information. It depends on several factors, including your skill at throwing darts, the distance to the balloon, the size of the balloon, and the sharpness of the darts. If you're standing very close and are an expert dart thrower, the probability could be near 100%. If you're far away and have never thrown a dart before, it could be near 0%.
13. If you are picking a random shape from a mix of circles and triangles, which shape will you choose if there are more triangles?
If there are more triangles than circles, I would choose a triangle. The question implies a higher probability of selecting a triangle due to its greater abundance within the mix of shapes. Therefore, a random selection would favor the shape with the higher quantity.
To illustrate, imagine 70% of the shapes are triangles and 30% are circles. A random pick would statistically result in selecting a triangle more often than a circle.
14. What are the odds of picking a Monday if someone asks you to randomly pick a day of the week?
There are 7 days in a week. Assuming each day is equally likely to be picked, the probability of picking Monday is 1/7. Therefore the odds of picking a monday if someone asks you to randomly pick a day of the week is 1/7.
15. If you are about to pick an object out of a box of balls, what information would help you know the probability of picking a red ball?
To determine the probability of picking a red ball, I would need to know:
- The total number of balls in the box: This serves as the denominator for calculating the probability.
- The number of red balls in the box: This is the numerator. Knowing the exact count of red balls is crucial.
- If other colours are also present. This would allow calculation of the total population.
16. What is more probable: Picking the only apple in a box of oranges, or picking one of the oranges?
Picking one of the oranges is more probable. Since the box contains only one apple and multiple oranges, the probability of selecting an orange is significantly higher than selecting the single apple. In probability, the more instances of an outcome, the higher the chance of it occurring.
Therefore, P(orange) > P(apple).
17. You have a set of building blocks with many triangles and very few squares. If someone asks you to close your eyes and pick one, which one are you more likely to pick?
You are more likely to pick a triangle. Since there are "many triangles and very few squares", the probability of selecting a triangle is higher than selecting a square. The probability is directly related to the quantity of each shape.
18. What is more likely: That you pick a red sock from a drawer full of blue socks, or that you pick a blue sock?
It is more likely that you pick a blue sock. Since the drawer is full of blue socks, the probability of picking a red sock is 0. Therefore, picking a blue sock is more likely.
19. If there are clouds gathering, does that mean it will definitely rain?
No, clouds gathering do not definitively mean it will rain. Clouds are a necessary but not sufficient condition for rain.
While clouds indicate moisture in the atmosphere and the potential for precipitation, other factors like atmospheric stability, temperature, and the presence of condensation nuclei (particles for water vapor to condense on) are also crucial. For example, stable air might prevent the clouds from developing into rain-producing systems. Without the right conditions, clouds can dissipate without releasing any precipitation.
20. You have a bunch of toys. Some are big and some are small. If there are more small toys, which kind are you more likely to grab?
If there are more small toys, I'm more likely to grab a small toy. This is simply due to probability; a greater number of small toys increases the chance of randomly selecting one.
Think of it like a bag filled with toys. If 70% of the toys are small and 30% are big, reaching in blindly gives you a 70% chance of pulling out a small toy.
21. If you have a box full of different kinds of candies, and you are asked to pick a yellow candy, what do you need to know to estimate this probability?
To estimate the probability of picking a yellow candy, I need to know two things:
- The total number of candies in the box.
- The number of yellow candies in the box.
With this information, the probability can be estimated by dividing the number of yellow candies by the total number of candies in the box. For instance, probability = (number of yellow candies)/(total number of candies). If I don't know these values exactly, I might try to estimate them by taking a sample from the box.
22. What is more likely, to randomly pick your favorite toy out of a pile of toys, or to not pick your favorite toy?
It's more likely to not pick your favorite toy. This is because there's only one favorite toy, and many other toys to choose from. Assuming the selection is random and each toy has an equal chance of being picked, the probability of picking your favorite toy is 1/n, where n is the total number of toys. The probability of not picking it is (n-1)/n, which is always greater than 1/n when n > 1.
23. Imagine you are choosing a ball in a group of different colored balls. What must be true about the number of balls to ensure there is a high likelihood of you picking a blue ball?
To ensure a high likelihood of picking a blue ball, the number of blue balls must be significantly greater than the number of balls of any other single color, and ideally represent a large proportion of the total number of balls. For example, if there are 100 balls, having 80 blue balls and 20 balls of other colors ensures a higher probability than having 20 blue balls and 80 balls of various other colors. The more blue balls there are relative to the total, the better your odds.
24. What is more probable, that your friend chooses vanilla over chocolate, if you know most of their friends like chocolate?
It's difficult to say definitively without more information, but knowing that most of your friend's other friends like chocolate doesn't directly impact your friend's individual preference. Your friend's preference is likely based on their own taste, experiences, and perhaps factors unrelated to their social circle's preferences.
However, some factors could create a slight bias. For example:
- Social influence: If your friend is generally easily influenced by their peer group they might try vanilla to be different, even if they like chocolate more, or if they are new to the group, they might choose Chocolate more often if they feel like they are trying to fit in.
- Availability heuristic: If the other friends like chocolate it is probable that chocolate is more available, and may impact the choice.
25. If you see a lot of birds flying south, does it mean that winter is definitely coming?
No, seeing birds flying south does not definitively mean winter is coming. While southward migration is often associated with the approach of winter, several other factors can trigger this behavior.
For instance, birds might migrate due to a lack of resources (food, water) in their current location, habitat changes (deforestation, fires), or even variations in weather patterns that are not necessarily indicative of the overall season. Therefore, while it's a common sign, it's not a foolproof indicator of the impending winter.
26. You have a set of dolls with different colors. Is it more likely that you pick a red doll or any other colored doll?
It depends on the distribution of colors. If the proportion of red dolls is greater than the proportion of any other single color, then it's more likely to pick a red doll. However, if we consider the probability of picking any non-red doll versus a red doll, it's more complex.
To clarify, consider an example: if 50% of the dolls are red, 20% are blue, 15% are green and 15% are yellow, then picking a red doll (50%) is more likely than picking any single other color. But, the probability of picking a non-red doll is 50% (20 + 15 + 15), so it is equally likely to pick a non-red doll as it is to pick a red doll.
Probability intermediate interview questions
1. You have two coins. One is fair, and the other always lands on heads. If you pick a coin at random and flip it twice, and it lands heads both times, what is the probability you picked the unfair coin?
Let A be the event that you pick the fair coin, and B be the event that you pick the unfair coin. Let H be the event that you get two heads in a row. We want to find P(B|H), the probability that you picked the unfair coin given that you got two heads.
Using Bayes' theorem, P(B|H) = P(H|B) * P(B) / P(H). P(B) = 1/2 since you pick a coin at random. P(H|B) = 1 since the unfair coin always lands on heads. To find P(H), we can use the law of total probability: P(H) = P(H|A) * P(A) + P(H|B) * P(B) = (1/2 * 1/2) * (1/2) + (1) * (1/2) = 1/8 + 1/2 = 5/8. Therefore, P(B|H) = (1 * 1/2) / (5/8) = 4/5.
2. There are 100 lockers and 100 students. The first student opens all the lockers. The second student closes every second locker. The third student changes every third locker (closes if open, opens if closed). The fourth student changes every fourth locker, and so on. After all 100 students have gone through, how many lockers are open?
The lockers that remain open are those with a number that has an odd number of divisors. A number has an odd number of divisors if and only if it is a perfect square. Therefore, we need to count the perfect squares between 1 and 100, inclusive.
The perfect squares are: 1, 4, 9, 16, 25, 36, 49, 64, 81, 100. There are 10 such numbers. So, 10 lockers will be open.
3. A stick is broken randomly into three pieces. What is the probability that you can form a triangle out of those three pieces?
Let the length of the stick be 1. Let the two break points be x and y. Without loss of generality, assume x < y. Then the three pieces have lengths x, y-x, and 1-y. For these to form a triangle, the triangle inequality must hold for all three combinations of sides:
- x + (y-x) > 1-y => y > 1/2
- x + (1-y) > y-x => y - x < 1/2
- (y-x) + (1-y) > x => x < 1/2
Plotting these inequalities on the x-y plane where 0 < x < y < 1 shows that the feasible region is a triangle with vertices (0, 1/2), (1/2, 1/2), and (1/2, 1). The area of this triangle is 1/8. The area of the region 0 < x < y < 1 is 1/2. Therefore, the probability is (1/8) / (1/2) = 1/4.
So, the probability that the three pieces form a triangle is 1/4.
4. You have 25 horses, and you want to find the fastest 3 horses. You can race 5 horses at a time. What is the minimum number of races required to determine the fastest 3?
7 races are required.
First, divide the 25 horses into 5 groups and race them (5 races). Label the winners of each race A1, B1, C1, D1, and E1 (these are potential candidates for the fastest horse). Race these 5 winners against each other (1 race). Let's say A1 wins this race. Therefore, A1 is the fastest horse. The second fastest horse must be either A2 (A1's group), B1, C1, D1, or E1. The third fastest horse must be among A2, A3, B1, B2, C1. Take A2, B1, C1, A3, B2 and race them together (1 race). The first and second place horses of this race are the second and third fastest horses overall. Total races: 5 + 1 + 1 = 7.
5. A city has two taxi companies: Blue and Green. 85% of the taxis are Green and 15% are Blue. A witness identifies a taxi as Blue. The court tests the witness and finds they correctly identify the color 80% of the time and misidentify it 20% of the time. What is the probability that the taxi was actually Blue?
This is a classic application of Bayes' Theorem. We want to find P(Blue | Identified as Blue), the probability the taxi was actually Blue given the witness identified it as Blue.
Using Bayes' Theorem: P(Blue | Identified as Blue) = [P(Identified as Blue | Blue) * P(Blue)] / P(Identified as Blue)
Where:
- P(Blue) = 0.15 (prior probability of a Blue taxi)
- P(Identified as Blue | Blue) = 0.80 (probability witness correctly identifies a Blue taxi)
- P(Identified as Blue) = P(Identified as Blue | Blue) * P(Blue) + P(Identified as Blue | Green) * P(Green) = (0.80 * 0.15) + (0.20 * 0.85) = 0.12 + 0.17 = 0.29
Therefore: P(Blue | Identified as Blue) = (0.80 * 0.15) / 0.29 = 0.12 / 0.29 ≈ 0.4138
So, the probability that the taxi was actually Blue is approximately 41.38%.
6. You are given a shuffled deck of cards. You turn over the cards one by one. At any point, you can guess that the next card is the Ace of Spades. What strategy maximizes your probability of guessing correctly, and what is the probability of success with that strategy?
The optimal strategy is to let a certain number of cards pass before guessing. If the Ace of Spades hasn't appeared by a certain point, you guess it on the next card. To find the optimal point, consider that if you guess on the kth card, you're correct if the Ace of Spades is in the kth position. The probability that the Ace of Spades is in the kth position is 1/52. However, you only guess on the kth position if it wasn't in positions 1 through k-1. This can be calculated recursively but a good approximation is that the probability is maximized when you let about n/e - 1 cards pass where n is total number of cards. In this case, you would let 52/e - 1 ≈ 18 cards pass. Then guess on the 19th card if the ace of spades has not appeared yet.
The probability of success for the optimal strategy is approximately 1/e ≈ 0.368.
7. Two players take turns flipping a fair coin. The first player to flip heads wins. What is the probability that the first player wins?
Let P(A) be the probability that the first player (Player A) wins. Player A can win on their first flip with probability 1/2. If Player A flips tails (with probability 1/2) and Player B also flips tails (with probability 1/2), then the game essentially restarts, and Player A is back in the position of being the first player. Thus, P(A) = 1/2 + (1/2)*(1/2)*P(A).
Solving for P(A): P(A) = 1/2 + (1/4)P(A). Multiplying by 4, we get 4P(A) = 2 + P(A). Therefore, 3P(A) = 2, and P(A) = 2/3. So the probability that the first player wins is 2/3.
8. You have two light bulbs and a 100-story building. You want to find the highest floor from which a bulb will not break when dropped. What is the optimal strategy to minimize the worst-case number of drops?
The optimal strategy involves dropping the first bulb at intervals that decrease linearly. Start by dropping the first bulb from floor 14. If it breaks, you'll need to test floors 1 through 13 linearly using the second bulb. If it doesn't break, move to floor 27 (14 + 13). Continue this pattern (40, 52, 63, 73, 82, 90, 97, 100), decreasing the interval by one each time. If the first bulb breaks at any of these floors, use the second bulb to test the floors linearly between the previous safe floor and the floor where the first bulb broke.
This strategy ensures that the maximum number of drops needed in the worst-case scenario is 14. If the first bulb breaks on the 14th floor, it takes a maximum of 14 drops (1 drop for the first bulb and 13 for the second). Similarly, if the first bulb breaks on the 100th floor after being dropped from 14, 27, 40, 52, 63, 73, 82, 90, 97, and 100; it still takes a maximum of 14 drops (10 drops for the first bulb and at most 10 linear drops between 97 and 100; however, since it broke at 100, only 3 would be needed, making the total 10 + 3 = 13. However, the worst case is at earlier stages).
9. A bag contains one counter, known to be either white or black. A white counter is put in, and then a counter is drawn at random which proves to be white. What is the probability that the original counter was white?
Let W be the event that the original counter was white, and B be the event that the original counter was black. Let D be the event that a white counter is drawn.
We want to find P(W|D). By Bayes' theorem, P(W|D) = P(D|W) * P(W) / P(D). We know P(W) = 1/2 (since the original counter is equally likely to be white or black). If the original counter was white, then there are now two white counters in the bag. So, P(D|W) = 2/2 = 1. If the original counter was black, then there is one white and one black counter. So, P(D|B) = 1/2. P(D) = P(D|W) * P(W) + P(D|B) * P(B) = (1 * 1/2) + (1/2 * 1/2) = 1/2 + 1/4 = 3/4. Thus, P(W|D) = (1 * 1/2) / (3/4) = (1/2) * (4/3) = 2/3.
10. You have two ropes. Each rope takes exactly one hour to burn completely, but they don't burn at a constant rate. How can you measure exactly 45 minutes using only these two ropes and a lighter?
Light both ends of rope A and one end of rope B simultaneously. When rope A burns completely, 30 minutes will have passed (since it burns from both ends). At this point, immediately light the other end of rope B. Rope B now has 30 minutes of burn time remaining, but since we are burning it from both ends, it will burn completely in 15 minutes (30/2 = 15). Therefore, the total time elapsed is 30 minutes (rope A) + 15 minutes (rope B) = 45 minutes.
11. Two cars start at the same point and travel in perpendicular directions. One car travels at 40 mph and the other at 30 mph. How far apart are they after 2 hours?
After 2 hours, the first car travels 40 mph * 2 hours = 80 miles, and the second car travels 30 mph * 2 hours = 60 miles. Since they travel in perpendicular directions, we can use the Pythagorean theorem to find the distance between them. The distance is the square root of (80^2 + 60^2) = square root of (6400 + 3600) = square root of 10000 = 100 miles.
12. You have a drawer with 12 black socks and 12 white socks. You randomly pull out socks without looking. What is the minimum number of socks you must pull out to guarantee you have a matching pair?
You must pull out 3 socks. In the worst-case scenario, you first pull out one black sock, then one white sock. The very next sock you pull out must be either black or white, creating a matching pair with one of the socks you already have.
13. What is the probability that a randomly chosen leap year contains 53 Sundays?
A leap year has 366 days, which is 52 weeks and 2 days. For a leap year to have 53 Sundays, one of those two extra days must be a Sunday. The possible combinations of those two days are:
- (Saturday, Sunday)
- (Sunday, Monday)
- (Monday, Tuesday)
- (Tuesday, Wednesday)
- (Wednesday, Thursday)
- (Thursday, Friday)
- (Friday, Saturday)
Out of these 7 possibilities, 2 of them include a Sunday. Therefore, the probability that a randomly chosen leap year contains 53 Sundays is 2/7.
14. You have a circular pizza. You make three straight cuts across the pizza. What is the maximum number of pieces you can create?
Seven.
The first cut divides the pizza into 2 pieces. The second cut can intersect the first, adding 2 more pieces, for a total of 4. To maximize the pieces with the third cut, it must intersect both of the previous cuts at different points. This adds 3 more pieces (one for each intersection + 1). So, 2 + 2 + 3 = 7.
15. A fair coin is flipped 10 times. What is the probability of getting exactly 5 heads?
The probability of getting exactly 5 heads in 10 coin flips can be calculated using the binomial probability formula. The formula is P(X = k) = (n choose k) * p^k * (1-p)^(n-k), where n is the number of trials (10 flips), k is the number of successes (5 heads), and p is the probability of success on a single trial (0.5 for a fair coin).
So, P(X = 5) = (10 choose 5) * (0.5)^5 * (0.5)^5 = 252 * (0.5)^10 = 252 / 1024 ≈ 0.2461, or about 24.61%.
16. You roll two fair six-sided dice. What is the probability that the sum of the numbers rolled is 7?
There are 6 possible outcomes that result in a sum of 7 when rolling two six-sided dice: (1, 6), (2, 5), (3, 4), (4, 3), (5, 2), and (6, 1). Since there are 6 possible outcomes that result in a sum of 7, and there are a total of 36 possible outcomes (6 sides on the first die * 6 sides on the second die), the probability of rolling a sum of 7 is 6/36, which simplifies to 1/6.
Therefore, the probability is 1/6.
17. You have two jars. One jar contains 50 red marbles and 50 blue marbles. The other jar contains 100 red marbles. How can you distribute the marbles into the two jars to maximize your chance of picking a red marble if you randomly choose a jar and then randomly choose a marble from that jar?
To maximize the probability of picking a red marble, put only 1 red marble in Jar 1 and all the remaining marbles (49 red + 50 blue) into Jar 2.
This strategy works because you're essentially giving yourself a 50% chance of picking Jar 1, which has a 100% chance of yielding a red marble. The probability of picking red from Jar 2 will be lower than 100%, but it contributes to the overall probability. The combined probability will be greater than simply distributing the marbles evenly or having one jar with only red marbles.
18. You are given a biased coin that lands heads with probability 0.7. You flip it twice. What is the probability of getting one head and one tail?
The probability of getting one head and one tail can occur in two ways: Head then Tail (HT) or Tail then Head (TH). The probability of HT is 0.7 * 0.3 = 0.21. The probability of TH is 0.3 * 0.7 = 0.21. Therefore, the total probability of getting one head and one tail is 0.21 + 0.21 = 0.42.
19. There are three boxes. One contains only apples, one contains only oranges, and one contains both apples and oranges. The boxes are labeled incorrectly such that no label identifies the actual contents of the box it describes. By opening just one box, and without looking into the box, you take out one piece of fruit. By looking at the fruit, how can you immediately label all of the boxes correctly?
Pick a fruit from the box labeled "Apples and Oranges". Since all boxes are mislabeled, this box cannot contain both apples and oranges.
- If you pick an apple, this box must contain only apples. This means the box labeled "Oranges" cannot contain only oranges (as that label is incorrect) and it also cannot contain only apples (as the "Apples and Oranges" box contains the apples). Therefore, the box labeled "Oranges" must contain both apples and oranges. This leaves the box labeled "Apples" to contain only oranges.
- If you pick an orange, this box must contain only oranges. This means the box labeled "Apples" cannot contain only apples (as that label is incorrect) and it also cannot contain only oranges (as the "Apples and Oranges" box contains the oranges). Therefore, the box labeled "Apples" must contain both apples and oranges. This leaves the box labeled "Oranges" to contain only apples.
20. A drunk man is standing in the middle of a bridge. He takes a step forward or backward with equal probability. He will fall off the bridge if he takes N steps in either direction. What is the probability he survives after taking K steps, where K < N?
The probability of survival is the probability that the drunk man does not fall off either end of the bridge after K steps. Let's define P(x, k) as the probability of the man being at position x after k steps, where the starting position is 0. The man falls off if he reaches N or -N. Survival means he stays within the range (-N, N). Since each step is independent and equally likely, we need to calculate the number of paths of length K that end at a position x such that -N < x < N, and then divide by the total number of possible paths of length K, which is 2^K.
To compute the probability directly is complex. The question does not allow to derive an exact formula to calculate this value. The probability of survival is 1 only when k = 0. Probability reduces as k increases towards N. An example would be to compute the probability of reaching N before -N (or the other way around), but the question is for surviving AFTER taking K steps.
21. Given 12 balls, 11 of which are of equal weight and one of which is of different weight. How can you identify the different ball and determine whether it is lighter or heavier in just 3 weighings using a balance scale?
Divide the 12 balls into three groups of four: A, B, and C.
Weighing 1: Weigh group A against group B.
- If they balance, the odd ball is in group C. Weigh 3 balls from group A (known good balls) against 3 balls from group C. If they balance, the remaining ball in group C is the odd ball. Weigh it against a known good ball to determine if it's heavier or lighter. If the 3 balls from A and C do not balance, you'll know if the odd ball in C is heavier or lighter. Take the heavier or lighter group of 3 from group C and perform steps similar to Weighing 3 below.
- If group A and B do not balance, this means odd ball is within group A or group B. Note which group is heavier (or lighter).
Weighing 2: From the heavier/lighter group (A or B), take 3 balls and put them on one side of the scale and 3 known good balls from group C on the other side. The group (A or B) you're removing 3 balls from will now contain 1 ball from the suspect group. If the scale balances, then the 1 ball you did not include from the previous weighings is the odd one. Weigh it against a known good ball from group C to determine heavier/lighter. If the scale does not balance, refer to which group was heavier or lighter from the previous weighing and deduce whether the odd ball in the group of 3 is lighter or heavier.
Weighing 3: (Only needed in some cases). If after Weighing 2 you have narrowed it down to 3 balls, and know that if the odd ball is heavier or lighter; place any two of those balls on the scale. If they balance, the third is the odd ball; otherwise, the scale will point to heavier or lighter ball, allowing you to identify it.
22. You have a bag with n balls. You pick a ball, look at it and return it to the bag. You do this k times. What is the probability that you have seen every ball at least once?
Let $n$ be the number of balls and $k$ be the number of draws with replacement. We want to find the probability that after $k$ draws, we have seen every ball at least once. This is a classic problem that can be solved using the inclusion-exclusion principle. The total number of possible outcomes is $n^k$, since each of the $k$ draws can result in any of the $n$ balls.
Let $A_i$ be the event that ball $i$ is not drawn in $k$ trials. We want to find $P(\overline{A_1} \cap \overline{A_2} \cap ... \cap \overline{A_n}) = 1 - P(A_1 \cup A_2 \cup ... \cup A_n)$. Using the inclusion-exclusion principle: $P(A_1 \cup A_2 \cup ... \cup A_n) = \sum_{i=1}^{n} (-1)^{i-1} {n \choose i} (\frac{n-i}{n})^k$ Therefore, the probability that we have seen every ball at least once is: $1 - \sum_{i=1}^{n} (-1)^{i-1} {n \choose i} (\frac{n-i}{n})^k = \sum_{i=0}^{n} (-1)^{i} {n \choose i} (\frac{n-i}{n})^k = \frac{1}{n^k} \sum_{i=0}^{n} (-1)^i {n \choose i} (n-i)^k$
23. There are two envelopes. One contains twice the amount of money as the other. You choose one envelope at random and open it, finding $100. You are then given the option to switch to the other envelope. Should you switch? Explain your reasoning.
This is a classic probability puzzle with a seemingly paradoxical solution. If you find $100, the other envelope contains either $50 or $200. A naive approach might suggest a 50/50 chance, leading to an expected value calculation. However, this is where the common mistake lies.
The flaw is assigning equal probability after knowing the amount in the first envelope. Intuitively, without knowing the amount, switching seems neutral. However, knowing you have $100 changes things. Let's analyze switching. Suppose the smaller amount is x. If you hold the larger envelope, you have 2x = $100 which means the smaller amount is x = $50. If you hold the smaller envelope, you have x = $100 which means the larger amount is 2x = $200. The expected value if you switch is (1/2)$50 + (1/2)$200 = $125, which is more than the current $100. So switching is advantageous. The paradox arises because of subtly incorrect probability assumptions. The key is to more carefully consider the prior distribution of the amounts.
Probability interview questions for experienced
1. How would you model the probability of a user clicking on an ad, given various user features and ad characteristics?
I would model the probability of a user clicking on an ad using a logistic regression model. The user features (e.g., age, location, browsing history) and ad characteristics (e.g., ad copy, image, placement) would be the independent variables, and the click-through rate (CTR) (click or no click) would be the dependent variable. The model outputs the probability of a click, given the input features.
To train the model, I'd use a large dataset of user interactions with ads. The data would need to be preprocessed, including handling missing values and encoding categorical features. Model evaluation would involve metrics such as AUC, log loss, and calibration curves to assess the model's accuracy and reliability. Furthermore, techniques like regularization and cross-validation are crucial to prevent overfitting and ensure generalization to unseen data. Libraries like sklearn or statsmodels in Python can be used for implementation.
2. Describe a scenario where Bayesian A/B testing would be preferred over frequentist A/B testing, and why?
Bayesian A/B testing shines when prior knowledge or beliefs about the performance of the variations exist. For example, imagine testing a new landing page design where historical data suggests a baseline conversion rate around 5%. A frequentist approach treats the null hypothesis (no difference) as the default, requiring significant evidence to reject it. Bayesian testing allows incorporating this prior belief as a probability distribution. This can lead to faster and more informed decisions, particularly when dealing with small sample sizes where frequentist methods might struggle to achieve statistical significance.
Furthermore, Bayesian testing provides probabilities of each variation being better than the others, which offers more intuitive results than p-values. In scenarios with limited traffic or a need to make decisions quickly (e.g., during a flash sale), the ability to update beliefs as new data arrives and to calculate the probability of one version outperforming another becomes invaluable. A frequentist approach requires waiting for a pre-determined sample size, but the Bayesian approach does not.
3. Explain how you would estimate the probability of a rare event, given a limited dataset.
Estimating the probability of a rare event with limited data requires techniques beyond simple frequency counting. We can employ methods like: 1) Resampling techniques such as bootstrapping to create multiple datasets from the original, allowing for more robust probability estimation. 2) Using Bayesian methods, we can incorporate prior knowledge about the event and update our belief based on the limited data. This is particularly useful when prior information is available. 3) Employing extreme value theory which focuses on the tail behavior of distributions, allowing for extrapolation and estimation of probabilities of rare events. 4) Cost-sensitive learning which can be applied if misclassifying the rare event is more costly, which may help bias the model toward correctly predicting the rare event.
The choice of method depends on the specific context and available data. Evaluating model performance using appropriate metrics like precision, recall, F1-score, or AUC is crucial to assess the reliability of the probability estimates, rather than solely relying on accuracy, which is misleading for imbalanced datasets. Cross-validation, especially stratified cross-validation, helps to ensure the model's generalization ability, mitigating overfitting when data is scarce.
4. How do you approach a probability problem when the underlying distribution is unknown?
When faced with a probability problem where the underlying distribution is unknown, I'd typically employ a combination of techniques. First, I'd explore collecting data to empirically estimate the distribution. If possible, I'd gather samples and use them to create a histogram or kernel density estimate, providing a visual and quantitative representation of the data's distribution.
Second, if collecting data isn't feasible, I'd consider making reasonable assumptions about the distribution based on the problem context. For instance, if dealing with waiting times, an exponential distribution might be a plausible assumption. If dealing with sums of independent random variables, I might lean towards a normal distribution (Central Limit Theorem). When making assumptions, I'd acknowledge the potential limitations and perform sensitivity analysis to understand how changes in the assumed distribution might affect the final probabilities.
5. Design a system to detect fraudulent transactions using probabilistic methods.
A probabilistic fraud detection system can be built using Bayesian networks or Hidden Markov Models (HMMs). The system first establishes a baseline of normal transaction behavior by analyzing historical data. Features like transaction amount, location, time, and user profile details are used. Each feature is assigned a probability distribution reflecting its typical values during normal behavior. Bayesian networks model the dependencies between these features, updating probabilities based on new evidence. HMMs are suited for sequential data, like transaction history, and model the probability of transitioning between different behavioral states (normal vs. fraudulent). When a new transaction occurs, its feature values are assessed against the established probability distributions. The system calculates the probability of the transaction being fraudulent based on the observed feature values and dependencies (Bayesian) or sequence of past transactions (HMM). Transactions with probabilities exceeding a predefined threshold are flagged for further investigation.
Enhancements include adaptive thresholding (adjusting the threshold based on overall fraud rates) and incorporating feedback from investigations to refine the probability distributions and feature dependencies. For example, if a specific location consistently flags fraudulent transactions, its associated probabilities can be adjusted. Also, techniques like anomaly detection using Gaussian Mixture Models (GMM) can supplement the primary probabilistic model.
6. What are some common biases in probability estimation, and how can you mitigate them?
Common biases in probability estimation include: Anchoring bias (relying too heavily on an initial piece of information), Availability bias (overestimating the likelihood of events that are easily recalled), and Confirmation bias (seeking out information that confirms pre-existing beliefs). Optimism bias can also lead to underestimating the probability of negative outcomes.
Mitigation strategies involve: Actively seeking diverse perspectives and data sources to counter confirmation bias. Using structured estimation techniques and checklists to reduce reliance on heuristics. Considering base rates and statistical data to avoid availability bias, and challenging initial assumptions to avoid anchoring bias. For example, if initial_estimate > historical_average: adjust_downward can be a programmatic way to address anchoring. Regularly reviewing and updating probability estimates based on new information is crucial.
7. How would you explain the concept of a p-value to a non-technical audience?
Imagine you're trying to prove something, like a new medicine works better than an old one. The p-value is like the probability of seeing the results you got (or even more extreme results) if the new medicine actually didn't work any better than the old one – if the new medicine was useless. Think of it as a measure of how surprising your results are if there's truly no difference.
So, a small p-value (usually less than 0.05) means your results would be pretty surprising if the new medicine was useless. This suggests the new medicine probably does work better. A large p-value, on the other hand, means your results aren't that surprising even if the new medicine is useless, so you don't have strong evidence that it works better.
8. Discuss the trade-offs between precision and recall in the context of a probabilistic classification model.
In probabilistic classification, precision and recall represent a trade-off in how the model balances correctly identifying positive cases versus minimizing false positives and false negatives. Precision measures the proportion of correctly predicted positive instances out of all instances predicted as positive. High precision means the model is good at avoiding false positives, but it might miss some actual positive cases. Recall, on the other hand, measures the proportion of correctly predicted positive instances out of all actual positive instances. High recall means the model is good at identifying most of the actual positive cases, but it might include more false positives.
Adjusting the probability threshold used for classification directly impacts this trade-off. Lowering the threshold increases recall (more true positives are captured), but typically decreases precision (more false positives are included). Conversely, increasing the threshold increases precision (fewer false positives), but decreases recall (more true positives are missed). The optimal balance depends on the specific problem and the relative costs of false positives and false negatives. For example, in medical diagnosis, high recall is often prioritized to avoid missing any potentially sick patients, even if it means more false positives that require further investigation.
9. How can Markov Chain Monte Carlo (MCMC) methods be used to solve complex probability problems?
Markov Chain Monte Carlo (MCMC) methods are used to approximate probability distributions that are difficult to calculate directly. The core idea is to construct a Markov chain whose stationary distribution is the target distribution we want to sample from. By simulating this Markov chain for a sufficiently long time, we can obtain samples that are approximately distributed according to the target distribution.
Specifically, MCMC methods like Metropolis-Hastings and Gibbs sampling iteratively propose new states and accept or reject them based on a carefully designed acceptance probability. This probability ensures that the chain converges to the desired stationary distribution. The generated samples can then be used to estimate properties of the target distribution, such as means, variances, or probabilities of events. MCMC proves especially useful in Bayesian inference for estimating posterior distributions when the likelihood and prior are complex.
10. Describe a situation where you would use a Hidden Markov Model (HMM) to model a sequence of events.
A Hidden Markov Model (HMM) would be suitable for modeling part-of-speech (POS) tagging in natural language processing. In POS tagging, the observed sequence is the sequence of words in a sentence. The hidden states are the POS tags (e.g., noun, verb, adjective). The HMM can learn the probabilities of transitioning between different POS tags (transition probabilities) and the probabilities of observing a particular word given a specific POS tag (emission probabilities). Given a new sentence, the HMM can then predict the most likely sequence of POS tags.
Another scenario is speech recognition. The observed sequence is the acoustic signal, and the hidden states are the phonemes or words. The HMM can model the temporal dependencies between these hidden states and the relationship between the hidden states and the observed acoustic features. This allows the model to infer the most likely sequence of words spoken, given the acoustic input.
11. Explain the difference between conditional probability and joint probability, and provide examples.
Conditional probability is the probability of an event occurring given that another event has already occurred. It's written as P(A|B), meaning "the probability of A given B." An example is the probability that it will rain given that it is cloudy. Joint probability, on the other hand, is the probability of two (or more) events happening simultaneously. It's written as P(A and B) or P(A, B). An example would be the probability that it is both cloudy and raining.
To illustrate further, consider a deck of cards. The conditional probability of drawing a King given that the card is a face card is higher than just drawing a King randomly from the deck. The joint probability of drawing a King and it being a heart is the probability of drawing the King of Hearts, which is 1/52.
12. How would you handle missing data when calculating probabilities?
Handling missing data when calculating probabilities requires careful consideration. One approach is to remove rows with missing data (listwise deletion), but this can lead to biased results if the missingness isn't completely random. Another method is imputation, where you fill in the missing values with estimates such as the mean, median, or mode. More sophisticated imputation techniques involve using regression models or machine learning to predict the missing values based on other variables.
The choice of method depends on the amount and nature of the missing data. If the data is missing completely at random (MCAR) and the amount of missing data is small, listwise deletion might be acceptable. For other situations, imputation is generally preferred. It's crucial to acknowledge the imputation method used and its potential impact on the resulting probabilities. Model based methods such as Expectation-Maximization (EM) are also useful.
13. Design a probabilistic model to predict customer churn.
A suitable probabilistic model for predicting customer churn is a Logistic Regression model. This model estimates the probability of a customer churning (binary outcome: churn or no churn) based on a set of predictor variables. Features like customer tenure, usage frequency, spending habits, customer service interactions, and satisfaction scores can be used as predictors. The model outputs a probability score between 0 and 1, representing the likelihood of churn.
To implement, the logistic regression model can be represented using the following code (Python example using scikit-learn):
from sklearn.linear_model import LogisticRegression

model = LogisticRegression()
model.fit(X_train, y_train)
probabilities = model.predict_proba(X_test)[:, 1] # Probabilities of churning
Thresholding the predicted probabilities allows us to classify customers as likely to churn or not, providing a basis for targeted intervention strategies. Model evaluation metrics, such as AUC-ROC, can be used to assess the model's performance.
14. How do you validate a probabilistic model to ensure its accuracy and reliability?
To validate a probabilistic model, several methods can be employed. A key technique is to split the available data into training and testing sets. The model is trained on the training data and then evaluated on the unseen testing data. Metrics like log-likelihood, Brier score, or calibration curves can be used to assess how well the model's predicted probabilities align with the observed outcomes. Calibration is particularly important; a well-calibrated model's predicted probabilities should reflect the true frequencies of events.
Further validation can involve comparing the model's performance against simpler baseline models or alternative probabilistic models. Cross-validation techniques, such as k-fold cross-validation, provide a more robust estimate of model performance by averaging results across multiple train/test splits. It's also crucial to consider the specific application of the model and evaluate whether the model's predictions are useful and reliable in that context. For example, in medical diagnosis, the cost of false positives and false negatives should be carefully considered when evaluating the model.
15. Explain the concept of entropy and its relevance in information theory and probability.
Entropy, in information theory, quantifies the uncertainty or randomness associated with a random variable. It measures the average amount of information needed to describe the outcome of that variable. Higher entropy signifies greater uncertainty, meaning the outcomes are more unpredictable, while lower entropy indicates more predictable outcomes. In probability, entropy is used to characterize the peakedness or flatness of a probability distribution; a uniform distribution has high entropy, and a distribution concentrated on a single outcome has low entropy.
Relevance: Entropy is a fundamental concept in machine learning, particularly in decision trees and information gain. In decision trees, information gain, calculated using entropy, helps determine the best feature to split the data at each node. It's also used in data compression (e.g., Huffman coding) to minimize the number of bits needed to represent data, based on the probability of each symbol or event.
16. How would you simulate a real-world process using Monte Carlo simulation?
Monte Carlo simulation models real-world processes by using random sampling to obtain numerical results. First, you define the process, identify key variables, and determine their probability distributions (e.g., normal, uniform). Then, you run numerous trials, each time randomly sampling values from these distributions. For each trial, you simulate the process based on those sampled values and record the outcome.
For example, simulating a queuing system at a bank might involve defining the arrival rate of customers (e.g., Poisson distribution) and the service time of tellers (e.g., exponential distribution). The simulation would then randomly sample inter-arrival times and service times for each customer, track the queue length, and record statistics like average waiting time. By running thousands of such trials, we can estimate the expected performance of the system.
17. Describe the limitations of using probability to make decisions in uncertain environments.
While probability provides a framework for quantifying uncertainty, it has limitations in real-world decision-making. First, probabilities are often based on historical data or subjective estimates, which may not accurately reflect future events, especially in novel or rapidly changing environments. This can lead to inaccurate predictions and suboptimal decisions. Also, assigning probabilities to all possible outcomes may be impractical or impossible, particularly when dealing with complex scenarios with numerous interacting factors or when the set of possible outcomes is not well-defined.
Furthermore, focusing solely on probabilities can neglect other crucial aspects, such as the potential impact or consequences of different outcomes. A low-probability event with catastrophic consequences might warrant more attention than a high-probability event with minimal impact. Finally, individuals and organizations may exhibit biases and cognitive limitations that affect how they perceive and interpret probabilities, leading to irrational decisions, even when probabilities are accurately estimated. For instance, risk aversion can cause individuals to overemphasize low-probability negative outcomes.
18. How would you combine multiple probabilistic models to improve prediction accuracy?
Combining multiple probabilistic models can improve prediction accuracy through techniques like ensemble methods. One common approach is model averaging, where predictions from different models are weighted and combined. These weights can be determined based on model performance on a validation set. Another approach is stacking, where a meta-learner is trained to combine the outputs of base-level models. This meta-learner learns which models are more reliable in different regions of the input space.
Specifically, consider using Bayesian Model Averaging (BMA), which uses Bayes' theorem to weight the models based on their posterior probability given the data. Alternatively, techniques like boosting can be employed, which iteratively combines weak learners into a strong learner, weighting models based on their individual performance and focusing on instances where previous models made errors. The choice of technique depends on the nature of the probabilistic models and the characteristics of the dataset. For example, simple averaging works well if the models are diverse and perform similarly.
19. Explain how you would use probability to optimize a supply chain.
Probability can optimize a supply chain by addressing uncertainty in demand, lead times, and other key variables. For example, forecasting demand often involves probability distributions, allowing us to calculate the likelihood of different demand levels. This helps in inventory management by determining optimal safety stock levels; we can minimize stockouts while reducing excess inventory holding costs. We can also use simulation techniques like Monte Carlo, incorporating probabilistic inputs for lead times and supplier performance, to model the entire supply chain and identify potential bottlenecks or risks.
Specifically, consider demand forecasting. Instead of relying on a single point forecast, probability distributions (e.g., normal distribution) can model the range of possible demands. This allows for calculating the probability of stockouts at different inventory levels. Using this, we can choose a safety stock level that achieves a desired service level (e.g., 95% probability of meeting demand). In transportation, we can estimate the probability of delays using historical data and choose optimal routes, carrier options or shipment methods minimizing potential disruptions.
20. Design a system to estimate the probability of equipment failure in a manufacturing plant.
To estimate equipment failure probability, I would implement a system that combines sensor data, historical maintenance records, and machine learning. First, collect real-time data from sensors (temperature, vibration, pressure) and store it in a time-series database. Second, gather historical data on failures, repairs, and maintenance schedules. Then, train a machine learning model (e.g., logistic regression, random forest, or a neural network) to predict the probability of failure based on sensor readings and historical data. The system would continuously monitor sensor data, use the trained model to generate failure probability scores, and alert maintenance teams when the probability exceeds a predefined threshold. Regular model retraining and feature engineering are crucial for maintaining accuracy.
Important data points to consider:
- Equipment age
- Operational hours
- Environmental conditions
- Maintenance history
- Sensor readings (vibration, temperature, pressure, etc.)
21. How do you deal with non-stationary data when building probabilistic models?
Dealing with non-stationary data in probabilistic models requires transforming the data or adapting the model. Common techniques include differencing (subtracting consecutive observations), detrending (removing trend components using regression), and seasonal decomposition (isolating and removing seasonal patterns). These methods aim to make the data stationary, or close to it, before applying standard probabilistic models. For instance in time series, differencing is frequently used prior to fitting an ARIMA model.
Alternatively, models can be adapted to handle non-stationarity directly. State-space models, such as Kalman filters, can explicitly model time-varying parameters. Also, models that utilize rolling windows of data can be effective. Another approach involves using models robust to outliers which can effectively mask non-stationary behavior.
22. Describe a situation where you would use a Bayesian network to model dependencies between variables.
A good example would be in medical diagnosis. Imagine trying to diagnose a patient's condition based on symptoms and test results. We could use a Bayesian network to model the probabilistic relationships between diseases, symptoms, and test outcomes. For instance, the network could represent that 'cough' and 'fever' are symptoms that increase the probability of having 'flu'. Also, a positive 'flu test' strongly increases the probability of 'flu'. The advantage is that the network can handle uncertainty and update the probabilities of different diagnoses as new evidence (symptoms or test results) becomes available. This is especially useful when dealing with complex scenarios where multiple diseases can present similar symptoms.
23. How would you use probability to personalize recommendations for users on an e-commerce website?
I would use probability to personalize recommendations by modeling user preferences and item characteristics. For each user, I'd estimate the probability of them clicking on or purchasing an item, P(click | user, item). This probability can be calculated using techniques like collaborative filtering or content-based filtering, incorporating user interaction history (past purchases, clicks, ratings) and item features (category, price, description). Techniques like Bayesian Networks or probabilistic matrix factorization can refine these probability estimates over time.
Specifically, let's say we want to recommend items. For each item not yet interacted with, we calculate P(click | user, item). Then we rank the items based on this probability and present the top N items as personalized recommendations. The model would need continuous updating based on user feedback (clicks, purchases, ratings), using methods such as:
- Online learning algorithms
- A/B testing to refine recommendation models
- Using confidence intervals to address the 'cold start' problem (new users/items)
24. Explain the concept of a confidence interval and its interpretation.
A confidence interval is a range of values, calculated from sample data, that is likely to contain the true value of a population parameter (e.g., the population mean). It's associated with a confidence level, which indicates the probability that the interval will capture the true parameter in repeated sampling. For example, a 95% confidence interval means that if we were to take many samples and construct a confidence interval for each sample, approximately 95% of those intervals would contain the true population parameter.
Interpretation: A 95% confidence interval, say [10, 15], suggests we are 95% confident that the true population mean lies between 10 and 15. Importantly, it doesn't mean there's a 95% probability that the true population mean falls within this specific interval; the true mean is fixed. Instead, it expresses the reliability of the procedure used to create the interval. The width of the interval reflects the precision of the estimate; narrower intervals indicate greater precision.
25. How would you design an experiment to measure the effectiveness of a new drug using probabilistic methods?
To measure the effectiveness of a new drug using probabilistic methods, I would design a randomized controlled trial (RCT). Participants would be randomly assigned to either a treatment group (receiving the new drug) or a control group (receiving a placebo or standard treatment). I would then collect data on relevant outcome variables (e.g., symptom severity, disease progression) for both groups. A Bayesian statistical model would then be used to estimate the probability of the drug being effective, given the observed data. This involves defining a prior distribution representing initial beliefs about the drug's effectiveness, then updating this prior with the data to obtain a posterior distribution. The posterior distribution quantifies the uncertainty about the drug's true effect, allowing one to calculate the probability that the drug is superior to the control based on a chosen efficacy threshold. This probability will provide a measure of the drug's effectiveness.
26. Describe the challenges of applying probability theory to real-world problems.
Applying probability theory to real-world problems presents several challenges. One major hurdle is accurately estimating probabilities in complex systems. Real-world data is often incomplete, noisy, or biased, making it difficult to obtain reliable probability distributions. Moreover, many events are not independent, violating a fundamental assumption of many probabilistic models. Ignoring these dependencies can lead to significantly inaccurate predictions.
Another challenge lies in choosing the appropriate probability model. The real world rarely perfectly conforms to theoretical distributions like the normal or Poisson. Selecting a model that's too simplistic can lead to inaccurate results, while overly complex models can be computationally expensive and prone to overfitting. Furthermore, effectively communicating probabilistic insights to non-experts can be difficult, as probability can be easily misinterpreted. For example, a "95% confidence interval" is frequently misinterpreted.
27. How would you use probability to detect anomalies in a network security system?
Probability can be used to detect anomalies in network security by establishing baseline probabilities for various network events and then identifying deviations from those baselines. For example, we can track the frequency of different types of network traffic (e.g., SSH, HTTP, DNS) and build a probability distribution. Then, if a sudden spike in unusual traffic like traffic to a suspicious port or from a new geographic location occurs, its probability will be low compared to the baseline. This low probability event can be flagged as a potential anomaly, signaling a possible attack. The specific threshold for defining an 'anomaly' will depend on the specific system and the acceptable false positive rate.
Specifically, let's consider HTTP request sizes. We can model the distribution of HTTP request sizes using a Gaussian distribution. If a new request comes in with a size far outside of the typical range (e.g., more than 3 standard deviations from the mean), then the probability of observing that size is very low under the normal distribution. This would then be marked as an anomaly. We can use tools like statistical hypothesis testing (e.g., chi-squared test) to determine if the observed network behavior differs significantly from the expected behavior.
28. Explain how the law of large numbers applies in practical scenarios.
The law of large numbers states that as the number of trials in a random experiment increases, the average of the results gets closer to the expected value. A practical example is in insurance. Insurance companies predict payouts based on historical data. While an individual's risk is uncertain, by insuring a large pool of people, the actual payouts tend to converge towards the predicted average, allowing the company to accurately price policies and remain profitable.
Another example is in A/B testing. Imagine testing two versions of a website. A small sample size might show one version performing better due to random chance. However, with a larger sample size (more users), the results are more likely to reflect the true underlying difference in performance between the two versions, providing a more reliable basis for choosing the better version.
29. How can probability theory be used to enhance machine learning algorithms?
Probability theory plays a crucial role in machine learning, allowing algorithms to handle uncertainty and make predictions based on probabilistic models. It provides the foundation for techniques like Bayesian learning, where prior beliefs are combined with observed data to update the model's parameters. Furthermore, probabilistic models enable algorithms to estimate the confidence in their predictions, offering a measure of reliability.
Specifically, algorithms can leverage probability theory in areas such as classification (e.g., Naive Bayes classifiers), regression (e.g., Gaussian processes), and model selection (e.g., using Bayesian Information Criterion). Techniques like maximum likelihood estimation (MLE) and maximum a posteriori (MAP) estimation, derived from probability theory, are widely used to train machine learning models by optimizing the likelihood of observed data given the model's parameters.
Probability MCQ
Question 1.
A standard deck of 52 playing cards is shuffled. A card is drawn at random, and then replaced in the deck. The deck is shuffled again, and a second card is drawn. What is the probability that the first card drawn was a heart, and the second card drawn was a spade?
Options:
Options:
Question 2.
A bag contains 5 red marbles and 3 blue marbles. A marble is drawn at random, its color is noted, and then it is placed back in the bag. Then, a second marble is drawn at random. What is the probability that the first marble is red and the second marble is blue?
Options:
Options:
Question 3.
A standard deck of 52 cards is shuffled. What is the probability of drawing a heart, and then, without replacing the first card, drawing a spade?
Options:
Question 4.
Events A and B are independent. P(A) = 0.3 and P(B) = 0.4. What is the probability that at least one of the events A or B occurs?
Options:
Question 5.
Bag A contains 5 red balls and 3 blue balls. Bag B contains 2 red balls and 6 blue balls. A ball is drawn from Bag A and transferred to Bag B. Then, a ball is drawn from Bag B. What is the probability that the ball drawn from Bag B is red?
Options:
Options:
Question 6.
A box contains 5 red balls and 3 blue balls. Two balls are drawn at random without replacement. Let A be the event that the first ball drawn is red, and B be the event that the second ball drawn is blue. What is the probability of A union B (A ∪ B)?
options:
Options:
Question 7.
A bag contains 5 red balls and 3 blue balls. Two balls are drawn at random without replacement. What is the probability that the first ball is red and the second ball is blue?
Options:
Question 8.
A box contains 5 red balls and 3 blue balls. A ball is drawn at random and not replaced. Then a second ball is drawn. What is the probability that the first ball is red and the second ball is blue?
Options:
Question 9.
A bag contains 5 red marbles and 3 blue marbles. A marble is drawn at random, its color is noted, and then it is replaced in the bag. This process is repeated three times. What is the probability of drawing a red marble, then a blue marble, then a red marble, in that specific order?
Options:
Question 10.
A committee of 3 people is to be randomly selected from a group of 5 men and 4 women. What is the probability that the committee consists of 2 men and 1 woman?
Options:
Options:
Question 11.
Two friends, Alice and Bob, are independently choosing a dessert from a menu containing 5 different options. What is the probability that Alice and Bob choose the same dessert?
Options:
Question 12.
A system consists of two components, A and B, connected in parallel. The system functions if at least one of the components functions. Component A has a probability of 0.8 of functioning, and component B has a probability of 0.7 of functioning. Assuming the components function independently, what is the probability that the entire system functions? options:
Options:
Question 13.
A game consists of three independent rounds. In each round, you have a 60% chance of winning. To win the game, you must win at least two out of the three rounds. What is the probability of winning the game?
options:
Options:
Question 14.
A target shooter has a probability of 0.7 of hitting the target on each shot. If she takes three independent shots, what is the probability that she hits the target at least once?
Options:
Question 15.
A factory produces items in three lots. Lot A contains 2% defective items, Lot B contains 3% defective items, and Lot C contains 5% defective items. If one item is randomly selected from each lot, what is the probability that at least one of the selected items is defective?
options:
Options:
Question 16.
A drawer contains 5 pairs of black socks and 3 pairs of white socks. If you randomly select two socks from the drawer, what is the probability that they are the same color?
options:
Options:
Question 17.
A train arrives at a station every 20 minutes, starting at 6:00 AM. If a passenger arrives at the station at a random time between 7:00 AM and 7:30 AM, what is the probability that they will have to wait no more than 5 minutes for a train? Options:
Options:
Question 18.
A fair six-sided die is rolled and a fair coin is flipped. What is the probability of rolling an even number on the die AND flipping heads on the coin?
Options:
Options:
Question 19.
What is the probability of forming the word 'STATISTICS' by randomly arranging all the letters in the word 'STATISTICS'?
Options:
Question 20.
A machine produces items, and the probability that any given item is defective is 0.1. What is the probability that the first three items produced are non-defective, and the fourth one is defective?
Options:
Question 21.
Two fair dice are rolled. What is the probability that the sum of the numbers rolled is a multiple of 3 or a multiple of 4?
options:
Options:
Question 22.
A club with 15 members needs to select a President and a Vice President. If John, a member, will only accept the position of President, and Mary, another member, will only accept the position of Vice President, what is the probability that both John and Mary are selected for their respective preferred positions?
Options:
Question 23.
A bag contains 5 red balls and 3 blue balls. Two balls are drawn at random without replacement. What is the probability that the balls are of different colors?
Options:
Options:
Question 24.
What is the probability of obtaining a sum of 7 when rolling three fair six-sided dice?
Options:
Question 25.
A shelf has 5 different history books, 3 different math books, and 2 different science books. If the books are arranged randomly on the shelf, what is the probability that all the history books are together, all the math books are together, and all the science books are together?
Options:
Options:
Which Probability skills should you evaluate during the interview phase?
Assessing a candidate's full potential in a single interview is always a challenge. However, when evaluating probability skills, some areas are more telling than others. Focus on these core skills to get a clearer picture of their abilities.
Basic Probability Principles
A quick way to gauge their knowledge is by using an assessment test. Our Numerical Reasoning test includes questions on probability, helping you filter candidates effectively. These MCQs efficiently assess their grasp of these foundational principles.
To further assess their understanding of basic probability, consider asking a targeted question. This will reveal how well they can apply the principles in a practical scenario.
A fair coin is flipped twice. What is the probability of getting heads on both flips?
Look for candidates who quickly recognize the independent events and calculate the probability as (1/2) * (1/2) = 1/4. This demonstrates a clear understanding of basic probability rules.
Problem Solving
See how well candidates tackle problems by using a test. The Critical Thinking test evaluates the candidate's ability to think through problems and come up with a solution. This screens for those who possess the knack for structured problem-solving.
Presenting a problem-solving question can show how they approach challenges. It is also a great way to assess if they can apply probability concepts in a practical scenario.
A bag contains 5 red balls and 3 blue balls. What is the probability of drawing 2 red balls in a row without replacement?
A good candidate will calculate the probability of the first red ball (5/8) and then adjust for the second (4/7), multiplying them to get 5/14. Look for the ability to clearly explain each step in the process.
Data Interpretation
An assessment test can streamline the evaluation of their data interpretation skills. The Data Interpretation test helps to see if the candidate can read between the lines. This will allow you to quickly evaluate a candidate's ability to analyze and interpret data.
Try asking an interview question that will show you if the candidate can read between the lines. This is a great way to assess a candidate's understanding of data interpretation.
Given a bar graph showing the probability distribution of customer satisfaction scores, what is the probability that a customer will rate their satisfaction as 'very satisfied' or 'extremely satisfied'?
Look for candidates who can accurately read the values from the bar graph and sum the probabilities for 'very satisfied' and 'extremely satisfied'. The best candidates should quickly interpret data and find the information they need.
Ace Your Hiring with Probability Skills Tests and Targeted Interview Questions
When hiring for roles requiring probability skills, it's important to accurately assess a candidate's proficiency. Ensuring they possess the right abilities is key to their success and your team's performance.
Using skills tests is the most accurate way to measure these skills. Explore Adaface's Probability Online Test, Statistics Online Test or Data Analysis Test for candidate skills evaluation.
After the test, shortlist top performers and invite them for interviews. This targeted approach ensures you focus your time on candidates with the proven skills you need.
Ready to find your next probability expert? Get started with a free trial on our online assessment platform today.
Probability Test
40 mins | 15 MCQs
The Probability Test evaluates a candidate's understanding of probability concepts and their application in quantitative analysis. It assesses knowledge of topics such as quantitative aptitude, numerical reasoning, logical reasoning, and data interpretation, with a focus on probability theory.
Try Probability Test
Download Probability interview questions template in multiple formats
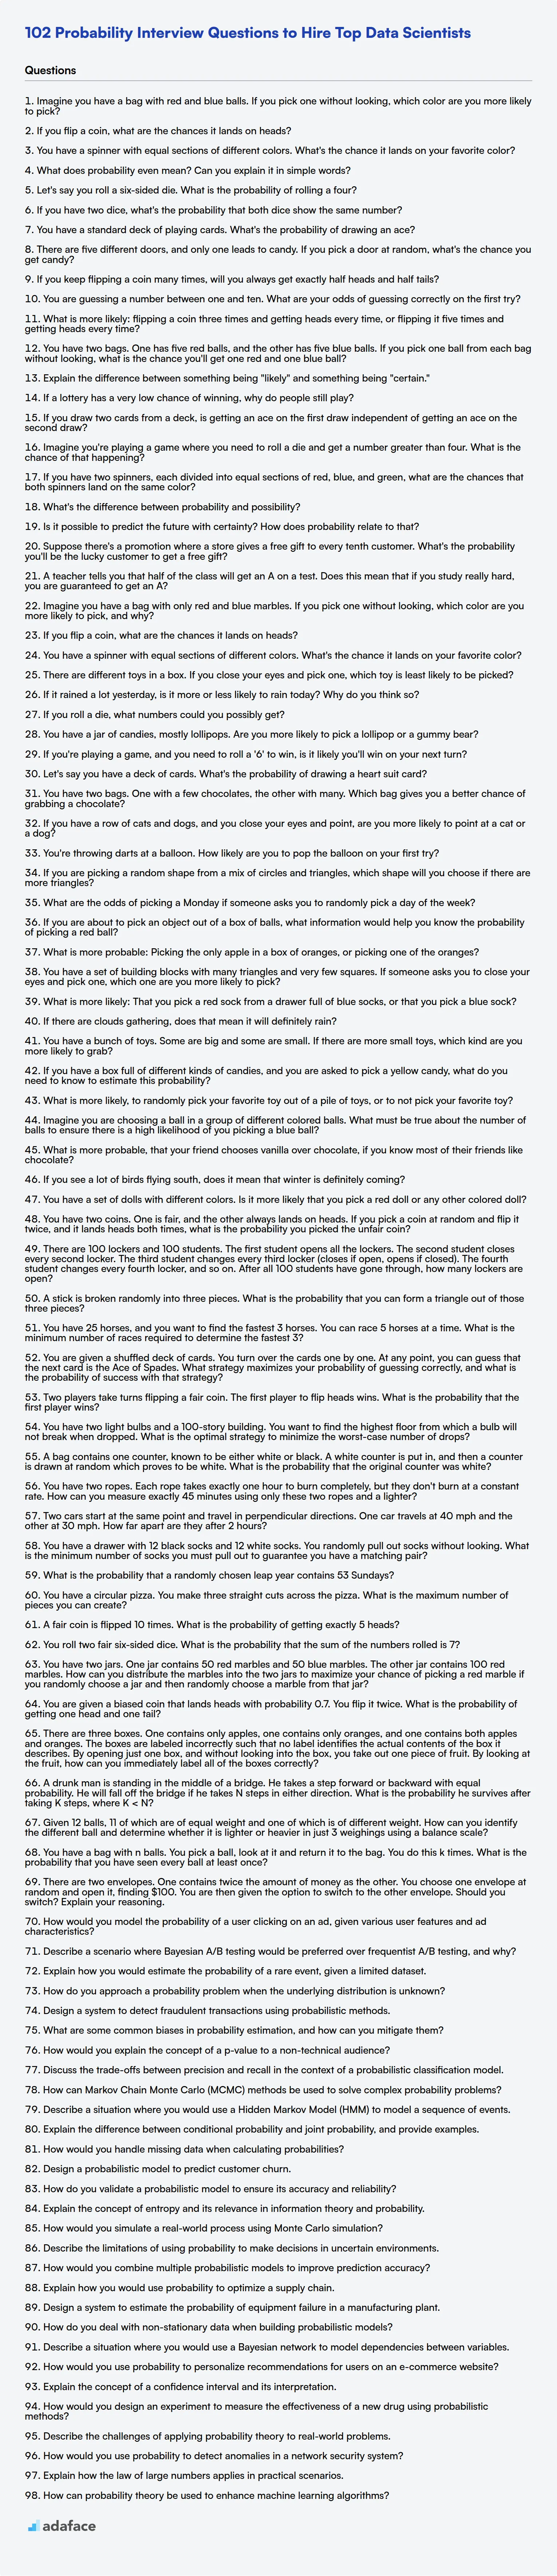
Probability Interview Questions FAQs
Why is probability important in data science interviews?
Probability is a cornerstone of data science, allowing you to assess a candidate's ability to handle uncertainty, model randomness, and make predictions based on data.
What are some common probability concepts tested in interviews?
Expect questions covering conditional probability, Bayes' theorem, probability distributions, expectation, variance, and hypothesis testing.
How can I assess a candidate's problem-solving ability using probability questions?
Present open-ended scenarios or real-world problems that require the candidate to apply probabilistic reasoning to arrive at a solution. Look for clear thinking and logical steps.
What's the difference between questions for freshers versus experienced candidates?
Freshers' questions focus on basic concepts and calculations. Experienced candidates should tackle more complex scenarios, model design, and the assumptions underlying different probabilistic models.
Are there any red flags to watch out for during probability interviews?
Watch out for candidates who struggle with fundamental concepts, fail to explain their reasoning, or make unsubstantiated claims without showing their work.
What are the best resources to learn probability concepts for interviews?
Online courses, textbooks, and practice problems are all excellent resources. Focus on both theoretical understanding and practical application.
40 min skill tests.
No trick questions.
Accurate shortlisting.
We make it easy for you to find the best candidates in your pipeline with a 40 min skills test.
Try for freeRelated posts
Free resources

Join 1200+ companies in 80+ countries.
Try the most candidate friendly skills assessment tool today.

40 min tests.
No trick questions.
Accurate shortlisting.
No trick questions.
Accurate shortlisting.