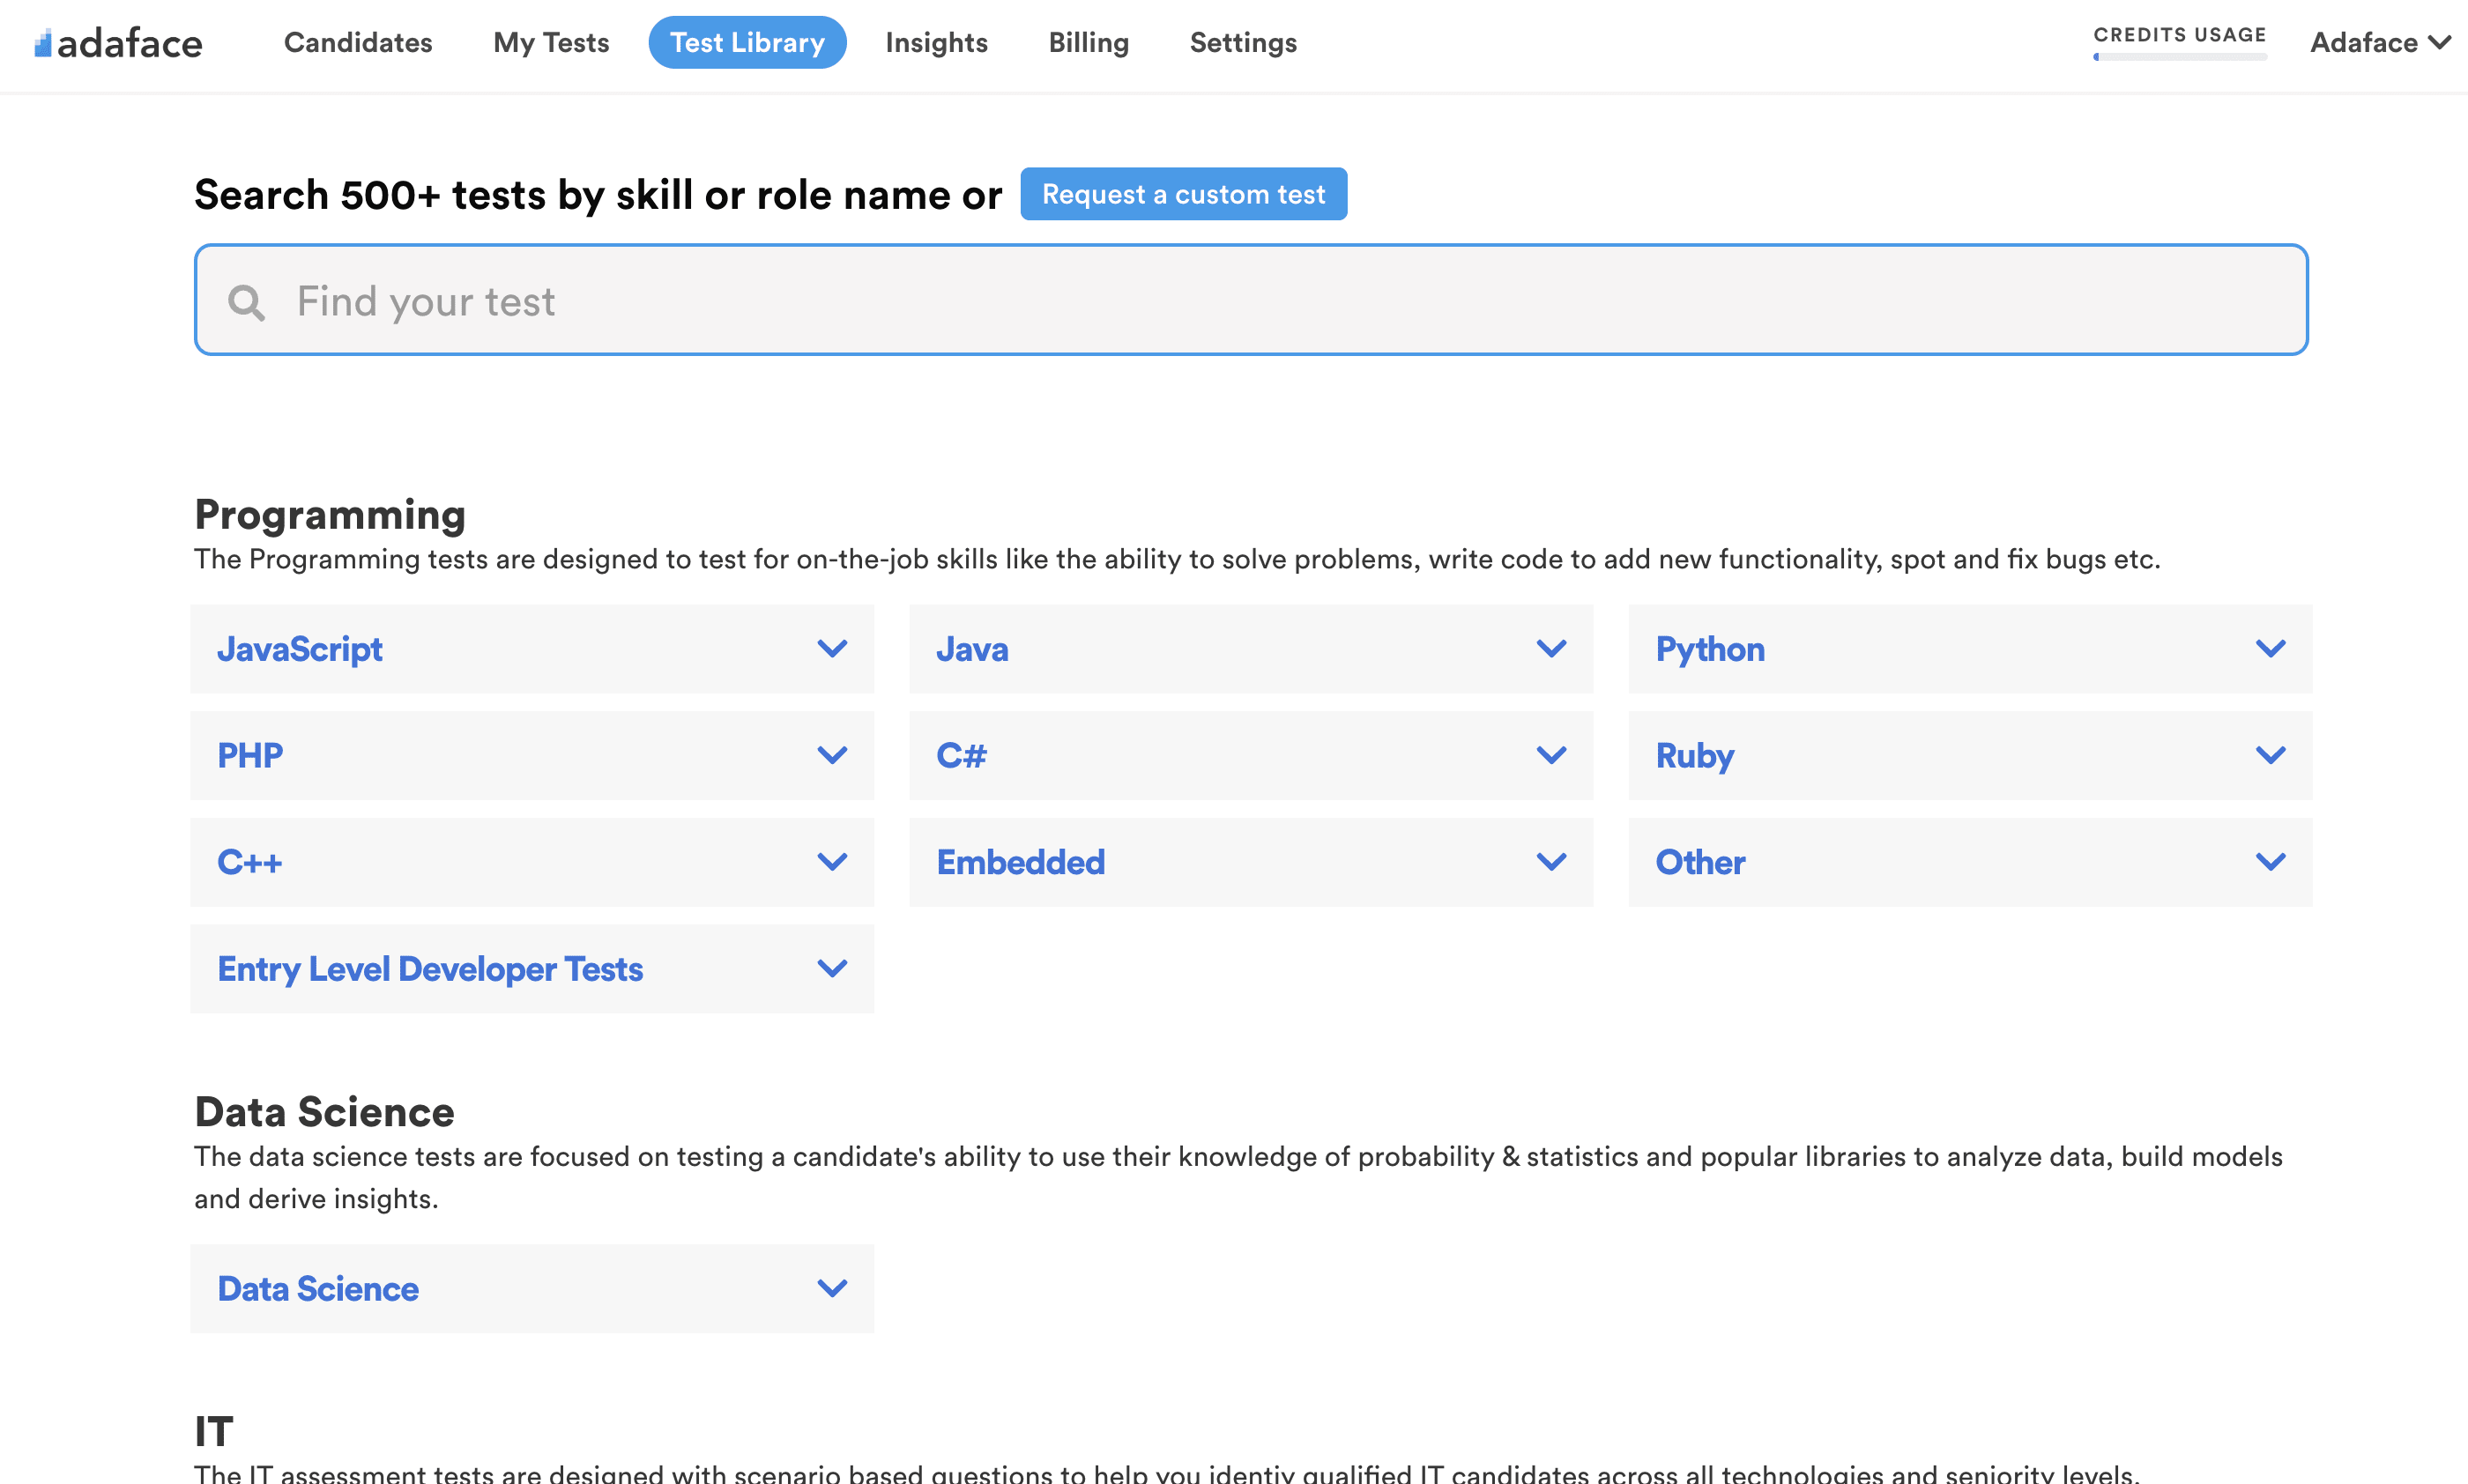
Search test library by skills or roles
⌘ K

About the test:

The OBIEE Online Test evaluates a candidate's knowledge and skills in Oracle Business Intelligence Enterprise Edition (OBIEE). It assesses their understanding of business intelligence concepts, data visualization, reporting, dashboard creation, metadata management, and data security.

Covered skills:

  • OBIEE
  • Data Visualization
  • Dashboards
  • Analytics
  • Metadata Management
  • Business Intelligence
  • Reporting
  • Data Modeling
  • Data Warehousing
  • Data Security

9 reasons why
9 reasons why

Adaface OBIEE Test is the most accurate way to shortlist OBIEE Developers


Reason #1

Tests for on-the-job skills

The OBIEE Online Test helps recruiters and hiring managers identify qualified candidates from a pool of resumes, and helps in taking objective hiring decisions. It reduces the administrative overhead of interviewing too many candidates and saves time by filtering out unqualified candidates at the first step of the hiring process.

The test screens for the following skills that hiring managers look for in candidates:

  • Ability to analyze data effectively
  • Ability to interpret data accurately
  • Ability to model data efficiently
  • Understanding of data warehousing concepts
  • Proficiency in OBIEE
  • Ability to create and manage reports
  • Competence in designing dashboards
  • Knowledge of data visualization techniques
  • Understanding of metadata management
  • Awareness of data security practices
  • Ability to perform analytics on data
  • Capability to handle complex data models
Reason #2

No trick questions

no trick questions

Traditional assessment tools use trick questions and puzzles for the screening, which creates a lot of frustration among candidates about having to go through irrelevant screening assessments.

View sample questions

The main reason we started Adaface is that traditional pre-employment assessment platforms are not a fair way for companies to evaluate candidates. At Adaface, our mission is to help companies find great candidates by assessing on-the-job skills required for a role.

Why we started Adaface
Reason #3

Non-googleable questions

We have a very high focus on the quality of questions that test for on-the-job skills. Every question is non-googleable and we have a very high bar for the level of subject matter experts we onboard to create these questions. We have crawlers to check if any of the questions are leaked online. If/ when a question gets leaked, we get an alert. We change the question for you & let you know.

How we design questions

These are just a small sample from our library of 10,000+ questions. The actual questions on this OBIEE Test will be non-googleable.

🧐 Question

Medium

Hiring Developer
Skewed Data
Graph
Solve
Two companies A and B hired developers from the year 2001 to 2005. The given bar graph shows the hiring details. 
 image
 image
Now select the statements that are true based on the given details.

A: The data given for Company A is skewed to the left.
B: The data given for Company B is skewed to the right.
C: The data given for Company A is skewed to the right.
D: For Company B, mean and mode are equal.
E: For Company B, mean is equal to median but less than mode.
F: For Company A, median is less than mode but greater than mean.

Medium

Negative correlation
Solve
Saffi, one of the popular schools in San Francisco did a school wide study of the students in middle school. The study found that there is a negative correlation between the time spent on Facebook per day by students and their academic achievement. How can we understand the results of this study?
A: An increase in time spent on Facebook per day causes a drop in the academic achievement of students at the middle school level.

B: There is an association between an increase in time spent on Facebook per day and the drop in the academic achievement of students at Saffi. 

C: An increase in the time spent on Facebook per day causes a drop in the academic achievement of students at Saffi. 

D: There is an association between an increase in time spent on Facebook per day and the drop in the academic achievement of students at the middle school level.

Medium

Dividends
Financial Analysis
Percentage and Average Calculations
Solve
Consider the following line chart which shows the money invested by a company in production each year and the sales made by the company each year. If the pie chart shows the shareholding pattern of the company and the company gives 10% of the profit as dividends to its share holders then what is the average dividend received by retail investors from 2000 to 2004?
 image
 image

Medium

Laptop Brands
Proportions and Percentages
Financial Reasoning
Solve
Given below is the list of laptop brands and their details in which some data is missing. If the cost price of Dell is 3/5 of the cost price of Lenovo, then what will be the %profit of Dell?
 image

Hard

Median
Trend Analysis
Statistical Reasoning
Solve
 Consider the following line chart which shows the sales of five different companies from 2000 to 2009. Which of the following companies has the maximum percentage increase in the median from 2000 to 2004 and 2005 to 2009.
 image

Easy

Healthcare System
Data Integrity
Normalization
Referential Integrity
Solve
You are designing a data model for a healthcare system with the following requirements:
 image
A: A separate table for each entity with foreign keys as specified, and a DoctorPatient table linking Doctors to Patients.
B: A separate table for each entity with foreign keys as specified, without additional tables.
C: A combined PatientDoctor table replacing Patient and Doctor, and separate tables for Appointment and Prescription.
D: A separate table for each entity with foreign keys, and a PatientPrescription table to track prescriptions directly linked to patients.
E: A single table combining Patient, Doctor, Appointment, and Prescription into one.
F: A separate table for each entity with foreign keys as specified, and an AppointmentDetails table linking Appointments to Prescriptions.

Hard

ER Diagram and minimum tables
ER Diagram
Solve
Look at the given ER diagram. What do you think is the least number of tables we would need to represent M, N, P, R1 and R2?
 image
 image
 image

Medium

Normalization Process
Normalization
Database Design
Anomaly Elimination
Solve
Consider a healthcare database with a table named PatientRecords that stores patient visit information. The table has the following attributes:

- VisitID
- PatientID
- PatientName
- DoctorID
- DoctorName
- VisitDate
- Diagnosis
- Treatment
- TreatmentCost

In this table:

- Each VisitID uniquely identifies a patient's visit and is associated with one PatientID.
- PatientID is associated with exactly one PatientName.
- Each DoctorID is associated with a unique DoctorName.
- TreatmentCost is a fixed cost based on the Treatment.

Evaluating the PatientRecords table, which of the following statements most accurately describes its normalization state and the required actions for higher normalization?
A: The table is in 1NF. To achieve 2NF, remove partial dependencies by separating Patient information (PatientID, PatientName) and Doctor information (DoctorID, DoctorName) into different tables.
B: The table is in 2NF. To achieve 3NF, remove transitive dependencies by creating separate tables for Patients (PatientID, PatientName), Doctors (DoctorID, DoctorName), and Visits (VisitID, PatientID, DoctorID, VisitDate, Diagnosis, Treatment, TreatmentCost).
C: The table is in 3NF. To achieve BCNF, adjust for functional dependencies such as moving DoctorName to a separate Doctors table.
D: The table is in 1NF. To achieve 3NF, create separate tables for Patients, Doctors, and Visits, and remove TreatmentCost as it is a derived attribute.
E: The table is in 2NF. To achieve 4NF, address any multi-valued dependencies by separating Visit details and Treatment details.
F: The table is in 3NF. To achieve 4NF, remove multi-valued dependencies related to VisitID.

Medium

University Courses
ER Diagrams
Complex Relationships
Integrity Constraints
Solve
 image
Based on the ER diagram, which of the following statements is accurate and requires specific knowledge of the ER diagram's details?
A: A Student can major in multiple Departments.
B: An Instructor can belong to multiple Departments.
C: A Course can be offered by multiple Departments.
D: Enrollment records can link a Student to multiple Courses in a single semester.
E: Each Course must be associated with an Enrollment record.
F: A Department can offer courses without having any instructors.

Medium

Marketing Database
Columnar Storage
Data Warehousing
Analytical Queries
Solve
You are a data warehouse engineer at a marketing agency, managing a large-scale database that stores extensive data on customer interactions, campaign metrics, and market research. The database is used predominantly for complex analytical queries, such as segment analysis, trend identification, and campaign performance evaluation. These queries often involve aggregations, filtering, and joining over large datasets.

The existing setup, using traditional row-oriented storage, is struggling with performance issues, particularly for ad-hoc analytical queries that span multiple tables and require aggregating large volumes of data.

The main tables in the database are:

- Customer_Interactions (millions of rows): Stores individual customer interaction data.
- Campaign_Metrics (hundreds of thousands of rows): Contains detailed metrics for each marketing campaign.
- Market_Research (tens of thousands of rows): Holds market research data and findings.

Considering the nature of the queries and the structure of the data, which of the following changes would most effectively optimize the query performance for analytical purposes?
A: Normalize the database further by splitting large tables into smaller, more focused tables and creating indexes on frequently joined columns.
B: Implement an in-memory database system to facilitate faster data retrieval and processing.
C: Convert the database to use columnar storage, optimizing for the types of analytical queries performed in the marketing context.
D: Create a series of materialized views to pre-aggregate data for common query patterns.
E: Increase the hardware capacity of the server, focusing on faster CPUs and more RAM.
F: Implement partitioning on the main tables based on commonly filtered attributes, such as campaign IDs or time periods.

Medium

Multidimensional Data Modeling
Multidimensional Modeling
OLAP Operations
Data Warehouse Design
Solve
As a senior data warehouse engineer at a large retail company, you are tasked with designing a multidimensional data model to support complex OLAP (Online Analytical Processing) operations for retail analytics. The company operates in multiple countries and deals with a wide range of products. The primary requirement is to enable efficient analysis of sales performance across various dimensions such as time, geography, product categories, and sales channels.

The source data resides in a transactional system with the following tables:

- Transactions (Transaction_ID, Date, Store_ID, Product_ID, Quantity, Unit_Price)
- Stores (Store_ID, Store_Name, Country, Region)
- Products (Product_ID, Product_Name, Category, Supplier_ID)
- Suppliers (Supplier_ID, Supplier_Name, Country)

You need to design a schema in the data warehouse that facilitates fast querying for aggregations and comparisons along the mentioned dimensions. Which of the following schemas would best serve this purpose?
A: A star schema with a central fact table linking to dimension tables for Time, Store, Product, and Supplier.
B: A snowflake schema where dimension tables for Store, Product, and Supplier are normalized.
C: A galaxy schema with separate fact tables for Transactions, Inventory, and Supplier Orders, linked to shared dimension tables.
D: A flat schema combining all source tables into a single wide table to avoid joins during querying.
E: An OLTP-like normalized schema to maintain data integrity and minimize redundancy.
F: A hybrid schema using a star schema for frequently queried dimensions and a snowflake schema for less queried, more detailed dimensions.

Medium

Optimizing Query Performance
Query Optimization
Indexing Strategies
Data Partitioning
Solve
As a senior data warehouse developer, you are tasked with optimizing query performance in a large-scale data warehouse that primarily stores transactional data for a global retail company. The data warehouse is facing significant performance issues, particularly with certain types of queries that are crucial for business operations. After analysis, you identify that the most problematic queries are those that involve filtering and aggregating transaction data based on time periods (e.g., monthly sales) and specific product categories.

The main transaction table (Transactions) in the data warehouse has the following structure and characteristics:

- Columns: Transaction_ID (bigint), Transaction_Date (date), Product_ID (int), Quantity (int), Price (decimal), Category_ID (int)
- Row count: Approximately 2 billion rows
- Most common query pattern: Aggregating Quantity and Price by Category_ID and Transaction_Date (e.g., total sales per category per month)
- Current indexing: Primary key index on Transaction_ID, no other indexes

Based on this information, which of the following approaches would most effectively optimize the query performance for the given use case?
A: Add a non-clustered index on Transaction_Date and Category_ID.
B: Normalize the Transactions table by splitting Transaction_Date and Category_ID into separate dimension tables.
C: Implement partitioning on the Transactions table by Transaction_Date, and add a bitmap index on Category_ID.
D: Convert the Transactions table to use a columnar storage format.
E: Create a materialized view that pre-aggregates data by Category_ID and Transaction_Date.
F: Increase the hardware capacity of the data warehouse server, focusing on CPU and memory upgrades.
🧐 Question🔧 Skill

Medium

Hiring Developer
Skewed Data
Graph

3 mins

Data Analysis
Solve

Medium

Negative correlation

2 mins

Data Analysis
Solve

Medium

Dividends
Financial Analysis
Percentage and Average Calculations

3 mins

Data Interpretation
Solve

Medium

Laptop Brands
Proportions and Percentages
Financial Reasoning

2 mins

Data Interpretation
Solve

Hard

Median
Trend Analysis
Statistical Reasoning

3 mins

Data Interpretation
Solve

Easy

Healthcare System
Data Integrity
Normalization
Referential Integrity

2 mins

Data Modeling
Solve

Hard

ER Diagram and minimum tables
ER Diagram

2 mins

Data Modeling
Solve

Medium

Normalization Process
Normalization
Database Design
Anomaly Elimination

3 mins

Data Modeling
Solve

Medium

University Courses
ER Diagrams
Complex Relationships
Integrity Constraints

2 mins

Data Modeling
Solve

Medium

Marketing Database
Columnar Storage
Data Warehousing
Analytical Queries

2 mins

Data Warehouse
Solve

Medium

Multidimensional Data Modeling
Multidimensional Modeling
OLAP Operations
Data Warehouse Design

2 mins

Data Warehouse
Solve

Medium

Optimizing Query Performance
Query Optimization
Indexing Strategies
Data Partitioning

2 mins

Data Warehouse
Solve
🧐 Question🔧 Skill💪 Difficulty⌛ Time
Hiring Developer
Skewed Data
Graph
Data Analysis
Medium3 mins
Solve
Negative correlation
Data Analysis
Medium2 mins
Solve
Dividends
Financial Analysis
Percentage and Average Calculations
Data Interpretation
Medium3 mins
Solve
Laptop Brands
Proportions and Percentages
Financial Reasoning
Data Interpretation
Medium2 mins
Solve
Median
Trend Analysis
Statistical Reasoning
Data Interpretation
Hard3 mins
Solve
Healthcare System
Data Integrity
Normalization
Referential Integrity
Data Modeling
Easy2 mins
Solve
ER Diagram and minimum tables
ER Diagram
Data Modeling
Hard2 mins
Solve
Normalization Process
Normalization
Database Design
Anomaly Elimination
Data Modeling
Medium3 mins
Solve
University Courses
ER Diagrams
Complex Relationships
Integrity Constraints
Data Modeling
Medium2 mins
Solve
Marketing Database
Columnar Storage
Data Warehousing
Analytical Queries
Data Warehouse
Medium2 mins
Solve
Multidimensional Data Modeling
Multidimensional Modeling
OLAP Operations
Data Warehouse Design
Data Warehouse
Medium2 mins
Solve
Optimizing Query Performance
Query Optimization
Indexing Strategies
Data Partitioning
Data Warehouse
Medium2 mins
Solve
Reason #4

1200+ customers in 75 countries

customers in 75 countries
Brandon

With Adaface, we were able to optimise our initial screening process by upwards of 75%, freeing up precious time for both hiring managers and our talent acquisition team alike!


Brandon Lee, Head of People, Love, Bonito

Reason #5

Designed for elimination, not selection

The most important thing while implementing the pre-employment OBIEE Test in your hiring process is that it is an elimination tool, not a selection tool. In other words: you want to use the test to eliminate the candidates who do poorly on the test, not to select the candidates who come out at the top. While they are super valuable, pre-employment tests do not paint the entire picture of a candidate’s abilities, knowledge, and motivations. Multiple easy questions are more predictive of a candidate's ability than fewer hard questions. Harder questions are often "trick" based questions, which do not provide any meaningful signal about the candidate's skillset.

Science behind Adaface tests
Reason #6

1 click candidate invites

Email invites: You can send candidates an email invite to the OBIEE Test from your dashboard by entering their email address.

Public link: You can create a public link for each test that you can share with candidates.

API or integrations: You can invite candidates directly from your ATS by using our pre-built integrations with popular ATS systems or building a custom integration with your in-house ATS.

invite candidates
Reason #7

Detailed scorecards & benchmarks

View sample scorecard
Reason #8

High completion rate

Adaface tests are conversational, low-stress, and take just 25-40 mins to complete.

This is why Adaface has the highest test-completion rate (86%), which is more than 2x better than traditional assessments.

test completion rate
Reason #9

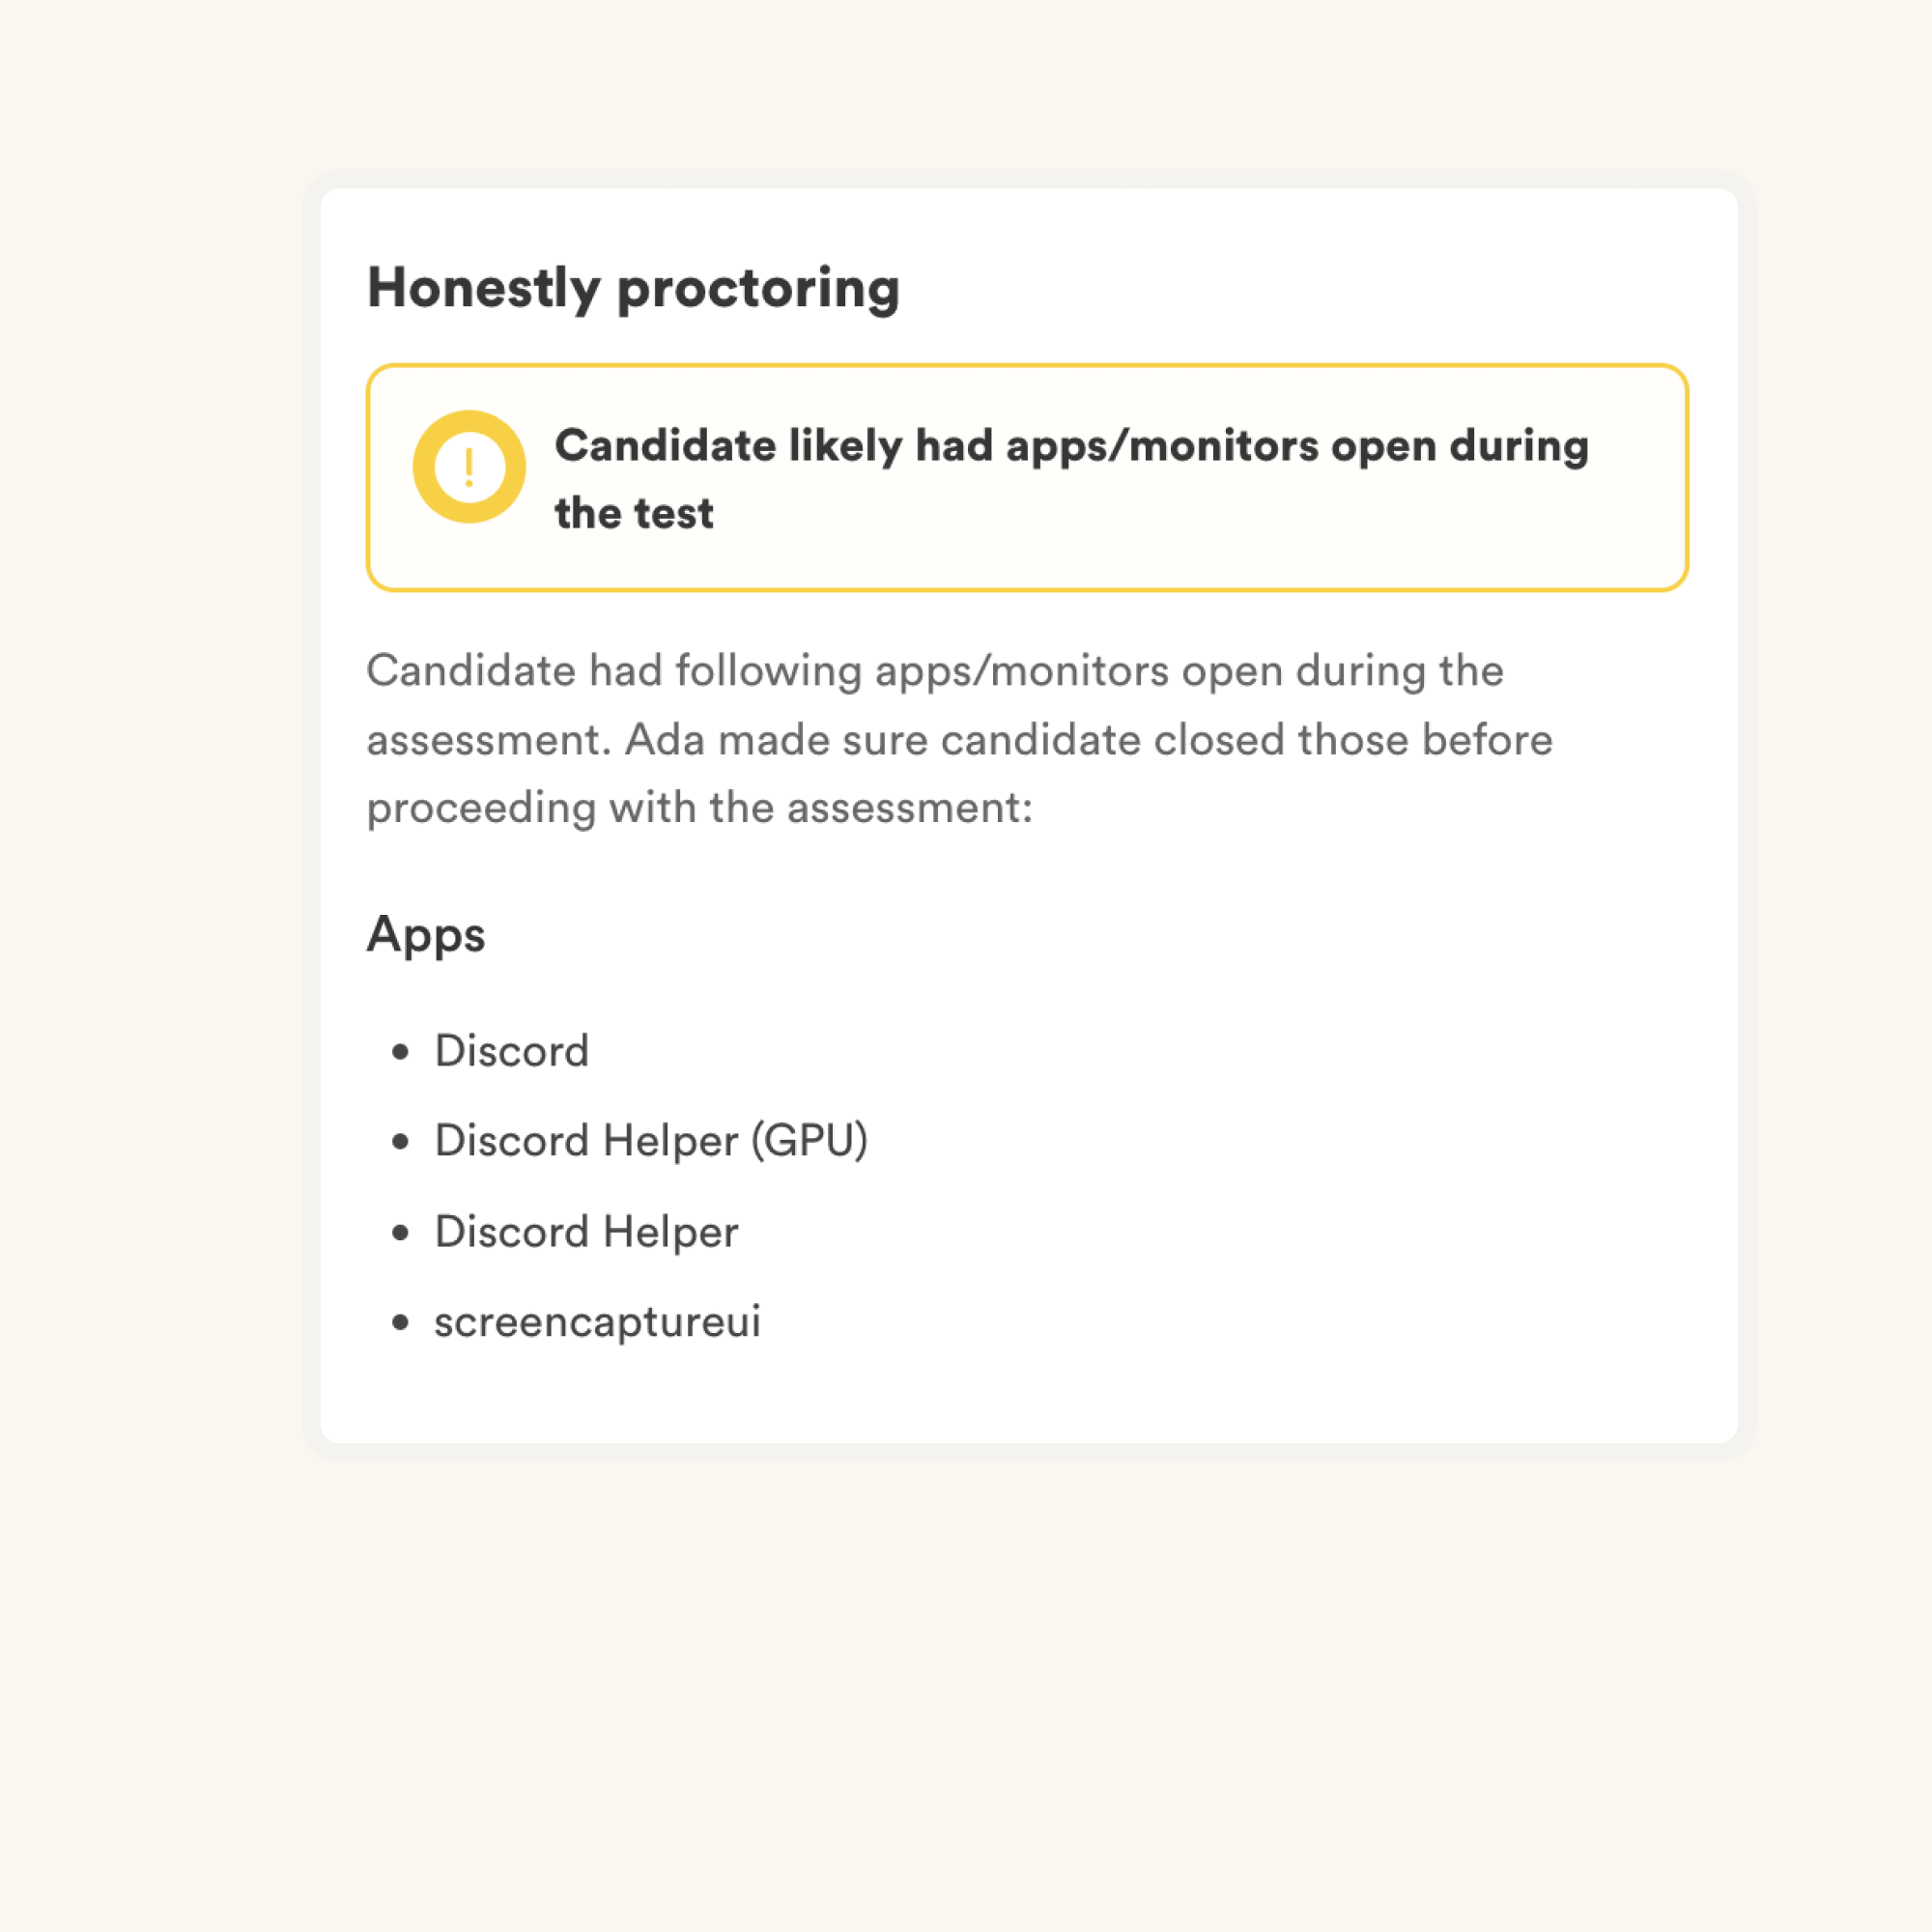
Advanced Proctoring


Learn more

About the OBIEE Assessment Test

Why you should use Pre-employment OBIEE Online Test?

The OBIEE Test makes use of scenario-based questions to test for on-the-job skills as opposed to theoretical knowledge, ensuring that candidates who do well on this screening test have the relavant skills. The questions are designed to covered following on-the-job aspects:

  • Performing data analysis to identify trends and patterns in large datasets
  • Interpreting data to provide insights and recommendations for improved business performance
  • Developing data models to structure and organize data for efficient analysis
  • Implementing data warehouse solutions to centrally store and manage data
  • Creating visually compelling reports and dashboards to present data in a meaningful way
  • Designing and implementing analytics solutions to support decision-making processes
  • Understanding and applying data warehousing concepts and principles
  • Managing metadata to ensure accurate and consistent data definitions
  • Implementing data security measures to protect sensitive information
  • Developing expertise in OBIEE and its various components

Once the test is sent to a candidate, the candidate receives a link in email to take the test. For each candidate, you will receive a detailed report with skills breakdown and benchmarks to shortlist the top candidates from your pool.

What topics are covered in the OBIEE Online Test?

  • OBIEE

    OBIEE stands for Oracle Business Intelligence Enterprise Edition. It is a business intelligence platform that provides a set of tools and capabilities for data analysis, reporting, and decision-making. Measuring this skill in the test enables recruiters to assess a candidate's proficiency in using OBIEE to gather insights from data and make informed business decisions.

  • Business Intelligence

    Business Intelligence refers to the process of collecting, analyzing, and presenting data in order to support business decision-making. Measuring this skill in the test allows recruiters to evaluate a candidate's ability to utilize various techniques and tools to transform raw data into meaningful insights that drive strategic actions.

  • Data Visualization

    Data Visualization involves representing data in visual formats such as charts, graphs, and dashboards to effectively communicate insights to stakeholders. Assessing this skill in the test helps recruiters gauge a candidate's proficiency in creating visually appealing and informative data visualizations that support data-driven decision-making.

  • Reporting

    Reporting involves generating structured and formatted information from raw data, usually presented in the form of tables, charts, or summaries. Measuring this skill in the test allows recruiters to assess a candidate's ability to design and generate accurate and relevant reports that help stakeholders understand and analyze key business metrics.

  • Dashboards

    Dashboards are visual displays of key performance indicators and other important metrics that provide a real-time snapshot of an organization's performance. Evaluating this skill in the test enables recruiters to determine a candidate's ability to design and build interactive and user-friendly dashboards that facilitate data exploration and decision-making.

  • Data Modeling

    Data Modeling is the process of creating a conceptual representation of data structures and relationships. Measuring this skill in the test allows recruiters to assess a candidate's proficiency in defining and designing data models that accurately capture and organize business data, ensuring efficient data management and retrieval.

  • Analytics

    Analytics involves using statistical techniques and algorithms to analyze data and extract meaningful patterns and insights. Assessing this skill in the test enables recruiters to evaluate a candidate's ability to apply analytical methods and tools to identify trends, make predictions, and gain deeper understanding of business performance and opportunities.

  • Data Warehousing

    Data Warehousing refers to the process of consolidating, organizing, and storing large amounts of data from various sources for efficient reporting and analysis. Measuring this skill in the test allows recruiters to determine a candidate's proficiency in designing, developing, and managing data warehouses that support effective data integration, storage, and retrieval.

  • Metadata Management

    Metadata Management involves the collection, organization, and maintenance of metadata, which provides contextual information about data. Evaluating this skill in the test helps recruiters assess a candidate's ability to effectively manage metadata, ensuring data quality, consistency, and accuracy in business intelligence initiatives.

  • Data Security

    Data Security encompasses measures and techniques aimed at protecting data from unauthorized access, use, disclosure, disruption, modification, or destruction. Assessing this skill in the test enables recruiters to evaluate a candidate's understanding of data security principles and their ability to implement appropriate security controls and policies to safeguard sensitive business information.

  • Full list of covered topics

    The actual topics of the questions in the final test will depend on your job description and requirements. However, here's a list of topics you can expect the questions for OBIEE Test to be based on.

    OBIEE Architecture
    Data Analysis
    Data Interpretation
    Data Modeling
    Data Warehousing Concepts
    Metadata Management
    Dimensional Modeling
    Star Schema
    Snowflake Schema
    Fact and Dimension Tables
    Hierarchies and Levels
    Aggregates and Measures
    OBIEE Reporting
    Oracle BI Administration Tool
    Dashboard Design
    Data Visualization Techniques
    KPIs and Scorecards
    Pivoting and View Filters
    User Administration and Security
    OBIEE Integration with Other Tools
    OBIEE Performance Tuning
    SQL for OBIEE
    ETL Concepts
    Data Warehouse Design
    Data Governance
    Data Quality Management
    Query Optimization
    Data Mining and Predictive Analytics
    Business Intelligence Best Practices
    OBIEE Troubleshooting

What roles can I use the OBIEE Online Test for?

  • OBIEE Developer
  • Oracle BI Developer
  • Senior Oracle Developer
  • BI Developer

How is the OBIEE Online Test customized for senior candidates?

For intermediate/ experienced candidates, we customize the assessment questions to include advanced topics and increase the difficulty level of the questions. This might include adding questions on topics like

  • Applying business intelligence concepts and methodologies
  • Utilizing data visualization techniques to effectively communicate information
  • Understanding and applying best practices in reporting and dashboard design
  • Analyzing and optimizing data models for performance and efficiency
  • Building and maintaining data warehouses for storage and retrieval of data
  • Ensuring data integrity and quality throughout the data lifecycle
  • Applying advanced analytics techniques such as predictive modeling and data mining
  • Configuring and customizing OBIEE to meet business requirements
  • Collaborating with cross-functional teams to gather and analyze data requirements
  • Troubleshooting and resolving issues related to OBIEE implementation
  • Designing and implementing ETL processes to extract, transform, and load data
Singapore government logo

The hiring managers felt that through the technical questions that they asked during the panel interviews, they were able to tell which candidates had better scores, and differentiated with those who did not score as well. They are highly satisfied with the quality of candidates shortlisted with the Adaface screening.


85%
reduction in screening time

OBIEE Hiring Test FAQs

Can I combine multiple skills into one custom assessment?

Yes, absolutely. Custom assessments are set up based on your job description, and will include questions on all must-have skills you specify. Here's a quick guide on how you can request a custom test.

Do you have any anti-cheating or proctoring features in place?

We have the following anti-cheating features in place:

  • Non-googleable questions
  • IP proctoring
  • Screen proctoring
  • Web proctoring
  • Webcam proctoring
  • Plagiarism detection
  • Secure browser
  • Copy paste protection

Read more about the proctoring features.

How do I interpret test scores?

The primary thing to keep in mind is that an assessment is an elimination tool, not a selection tool. A skills assessment is optimized to help you eliminate candidates who are not technically qualified for the role, it is not optimized to help you find the best candidate for the role. So the ideal way to use an assessment is to decide a threshold score (typically 55%, we help you benchmark) and invite all candidates who score above the threshold for the next rounds of interview.

What experience level can I use this test for?

Each Adaface assessment is customized to your job description/ ideal candidate persona (our subject matter experts will pick the right questions for your assessment from our library of 10000+ questions). This assessment can be customized for any experience level.

Does every candidate get the same questions?

Yes, it makes it much easier for you to compare candidates. Options for MCQ questions and the order of questions are randomized. We have anti-cheating/ proctoring features in place. In our enterprise plan, we also have the option to create multiple versions of the same assessment with questions of similar difficulty levels.

I'm a candidate. Can I try a practice test?

No. Unfortunately, we do not support practice tests at the moment. However, you can use our sample questions for practice.

What is the cost of using this test?

You can check out our pricing plans.

Can I get a free trial?

Yes, you can sign up for free and preview this test.

I just moved to a paid plan. How can I request a custom assessment?

Here is a quick guide on how to request a custom assessment on Adaface.

customers across world
Join 1200+ companies in 75+ countries.
Try the most candidate friendly skills assessment tool today.
g2 badges
Ready to use the Adaface OBIEE Test?
logo
40 min tests.
No trick questions.
Accurate shortlisting.
Terms Privacy Trust Guide

🌎 Pick your language

English Norsk Dansk Deutsche Nederlands Svenska Français Español Chinese (简体中文) Italiano Japanese (日本語) Polskie Português Russian (русский)
ada
Ada
● Online
Previous
Score: NA
Next
✖️