Test Duration
70 分
Difficulty Level
Moderate
Questions
- 5 パワーバイ MCQs
- 5 タブロー MCQs
- 4 r MCQs
- 5 Python MCQs
- 5 SQL MCQs
- 1 Python Coding Question
Availability
Ready to use
About the test:
Business Intelligence Developer Testは、シナリオベースの複数選択質問を使用して、データモデリングとETLプロセス、データウェアハウジングとデータマイニング、BIの報告と視覚化、データ分析と予測モデリング、およびBIプロジェクト管理に関連する候補者の知識とスキルを評価します。また、候補者は、SQL Server、Power BI、Tableau、その他の関連ツールなどのBIツールとテクノロジーを使用する能力と、複雑なビジネス上の問題を解決するためのデータ分析とビジネスインテリジェンス技術を適用する能力についても評価されます。
Covered skills:
Test Duration
70 分
Difficulty Level
Moderate
Questions
Availability
Ready to use
The BI開発者テスト helps recruiters and hiring managers identify qualified candidates from a pool of resumes, and helps in taking objective hiring decisions. It reduces the administrative overhead of interviewing too many candidates and saves time by filtering out unqualified candidates at the first step of the hiring process.
The test screens for the following skills that hiring managers look for in candidates:
Traditional assessment tools use trick questions and puzzles for the screening, which creates a lot of frustration among candidates about having to go through irrelevant screening assessments.
The main reason we started Adaface is that traditional pre-employment assessment platforms are not a fair way for companies to evaluate candidates. At Adaface, our mission is to help companies find great candidates by assessing on-the-job skills required for a role.
Why we started AdafaceWe have a very high focus on the quality of questions that test for on-the-job skills. Every question is non-googleable and we have a very high bar for the level of subject matter experts we onboard to create these questions. We have crawlers to check if any of the questions are leaked online. If/ when a question gets leaked, we get an alert. We change the question for you & let you know.
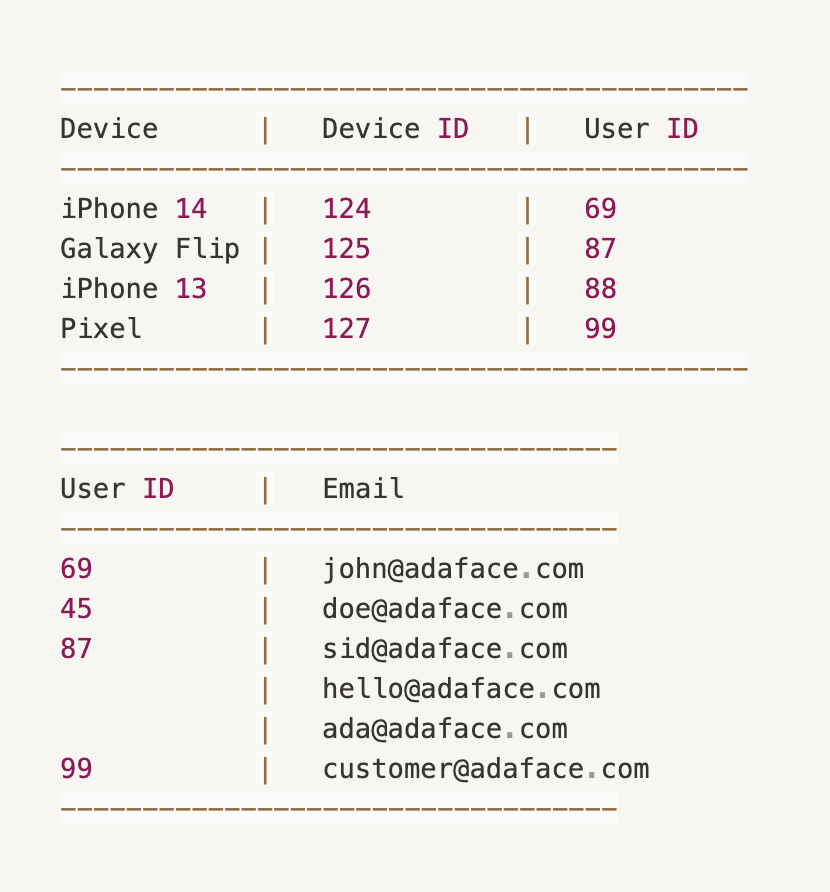
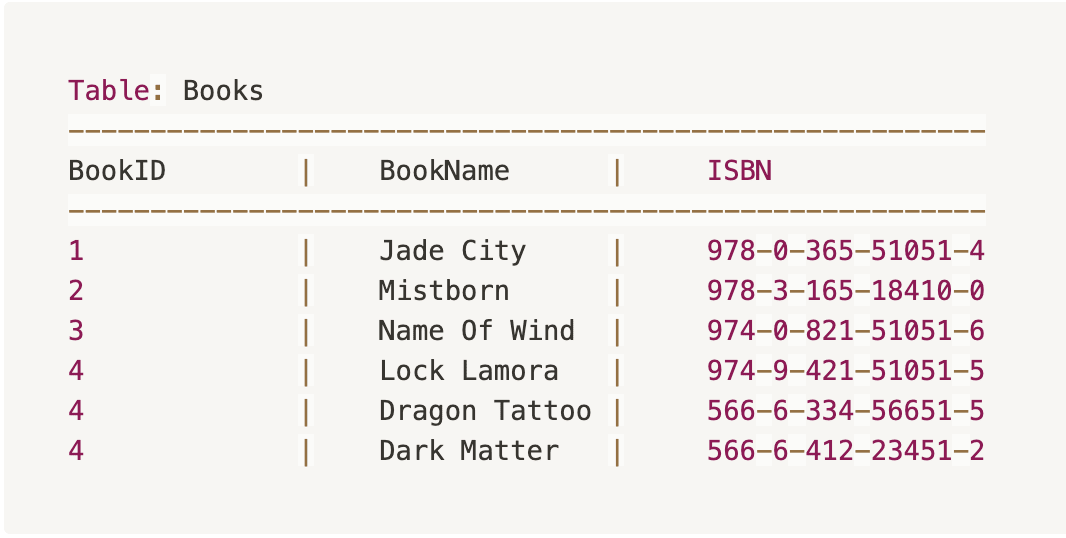
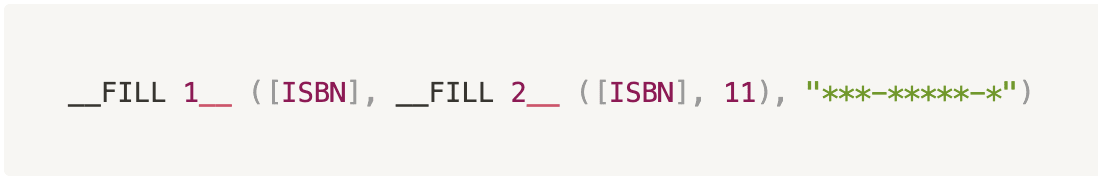
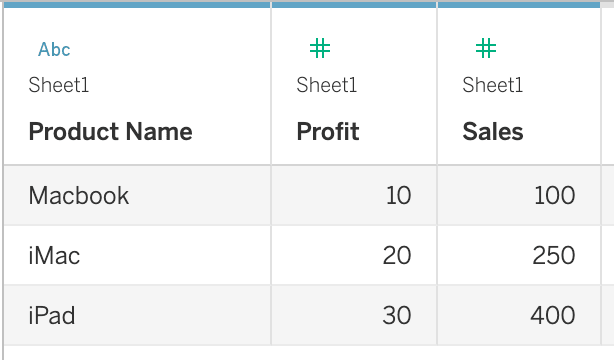
How we design questionsこれらは、10,000以上の質問のライブラリからのわずかなサンプルです。これに関する実際の質問 BI開発者テスト グーグルできません.
| 🧐 Question | |||||
|---|---|---|---|---|---|
Medium Data Filtering | Solve | ||||
Medium Many-to-one error | Solve | ||||
Medium Power Query Functions | Solve | ||||
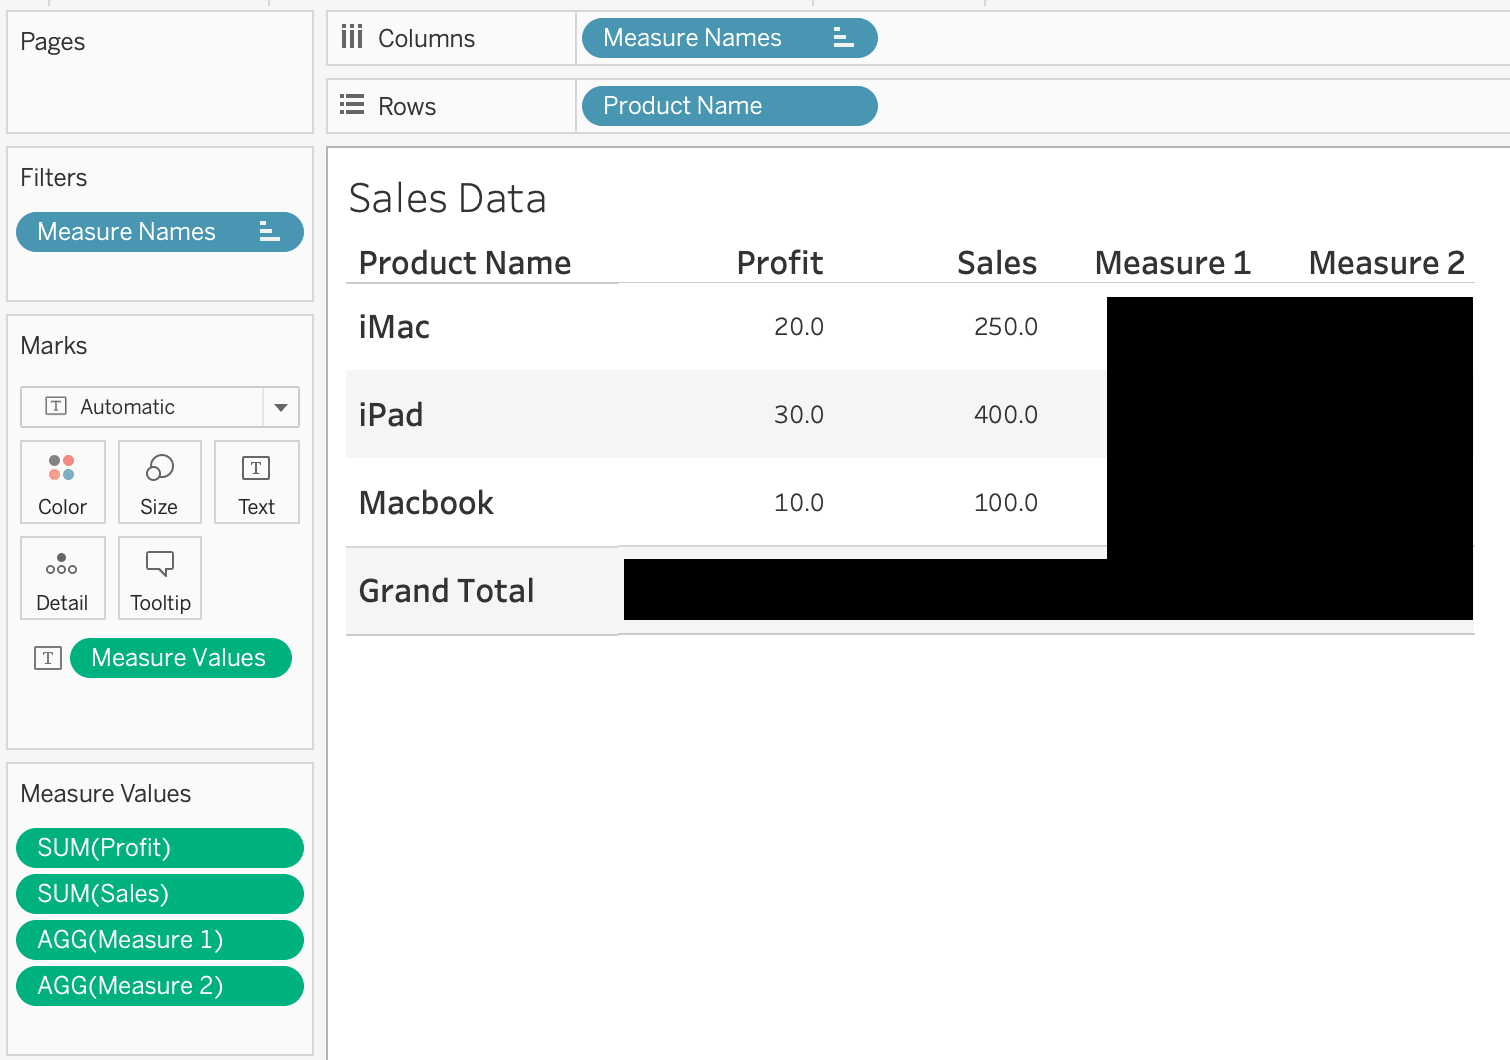
Medium Calculated Properties | Solve | ||||
Medium Change display icon | Solve | ||||
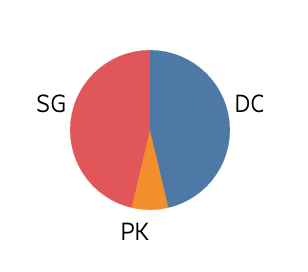
Easy Pie Chart | Solve | ||||
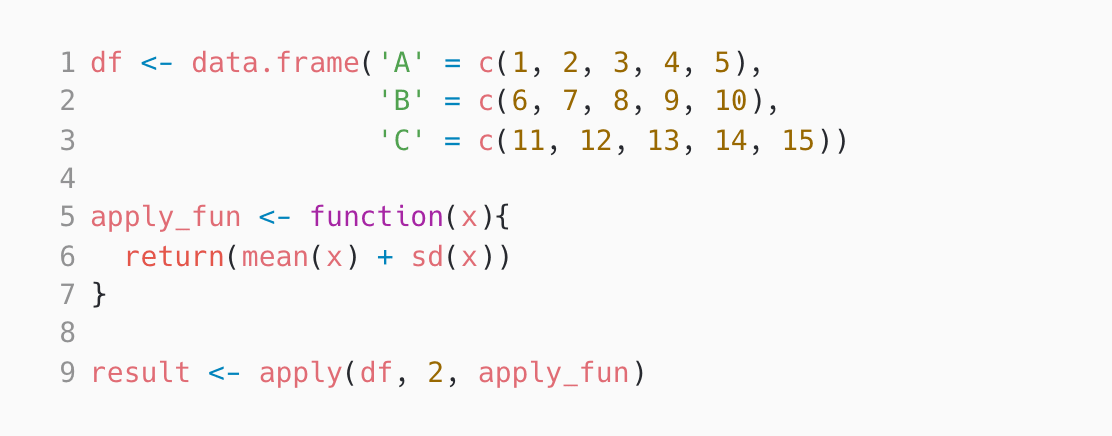
Medium Applying Functions | Solve | ||||
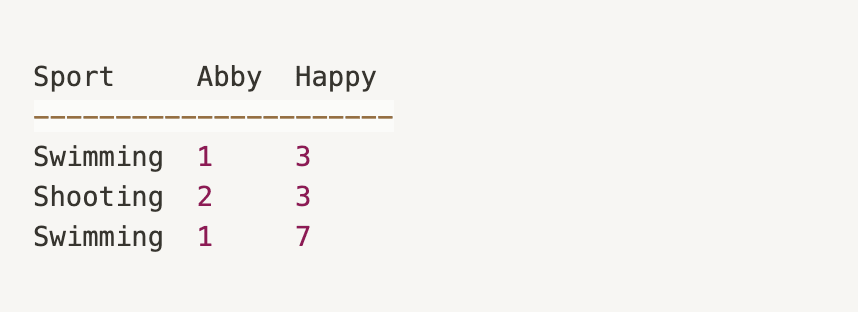
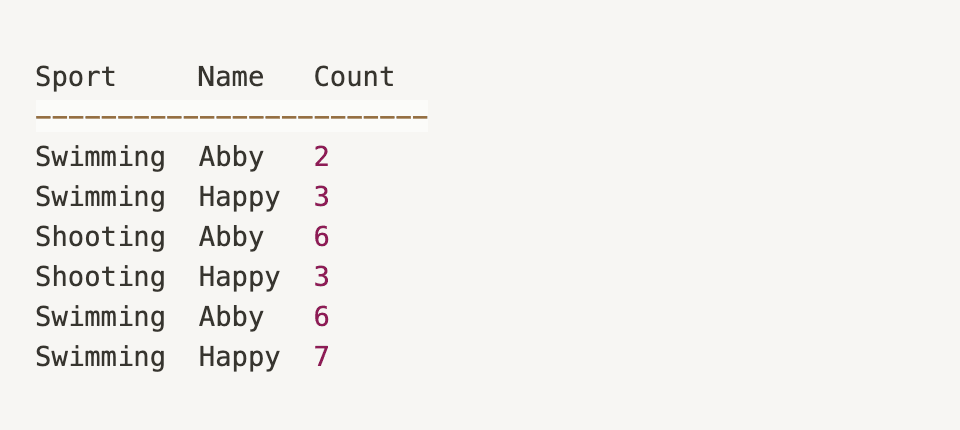
Medium Dataframe Transform | Solve | ||||
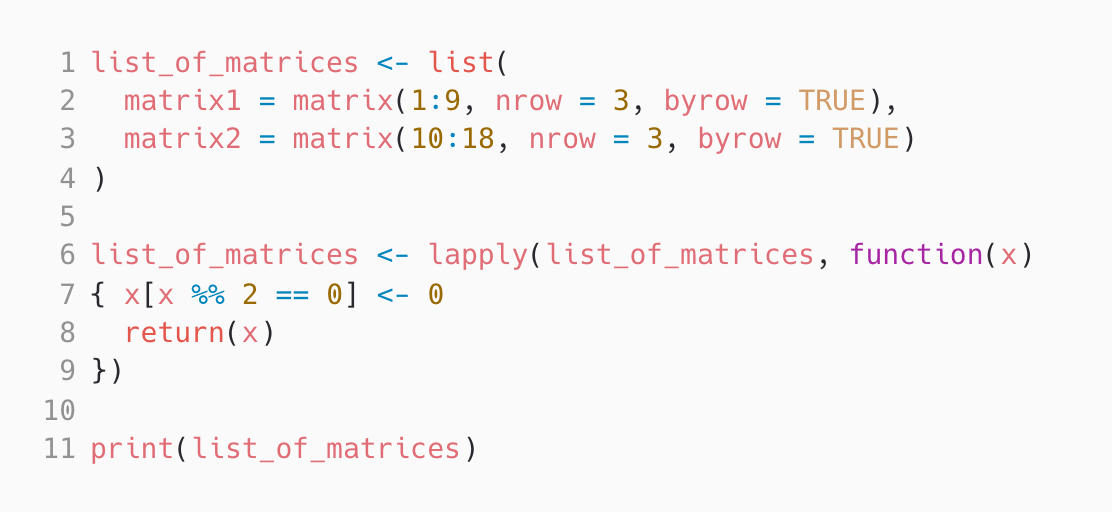
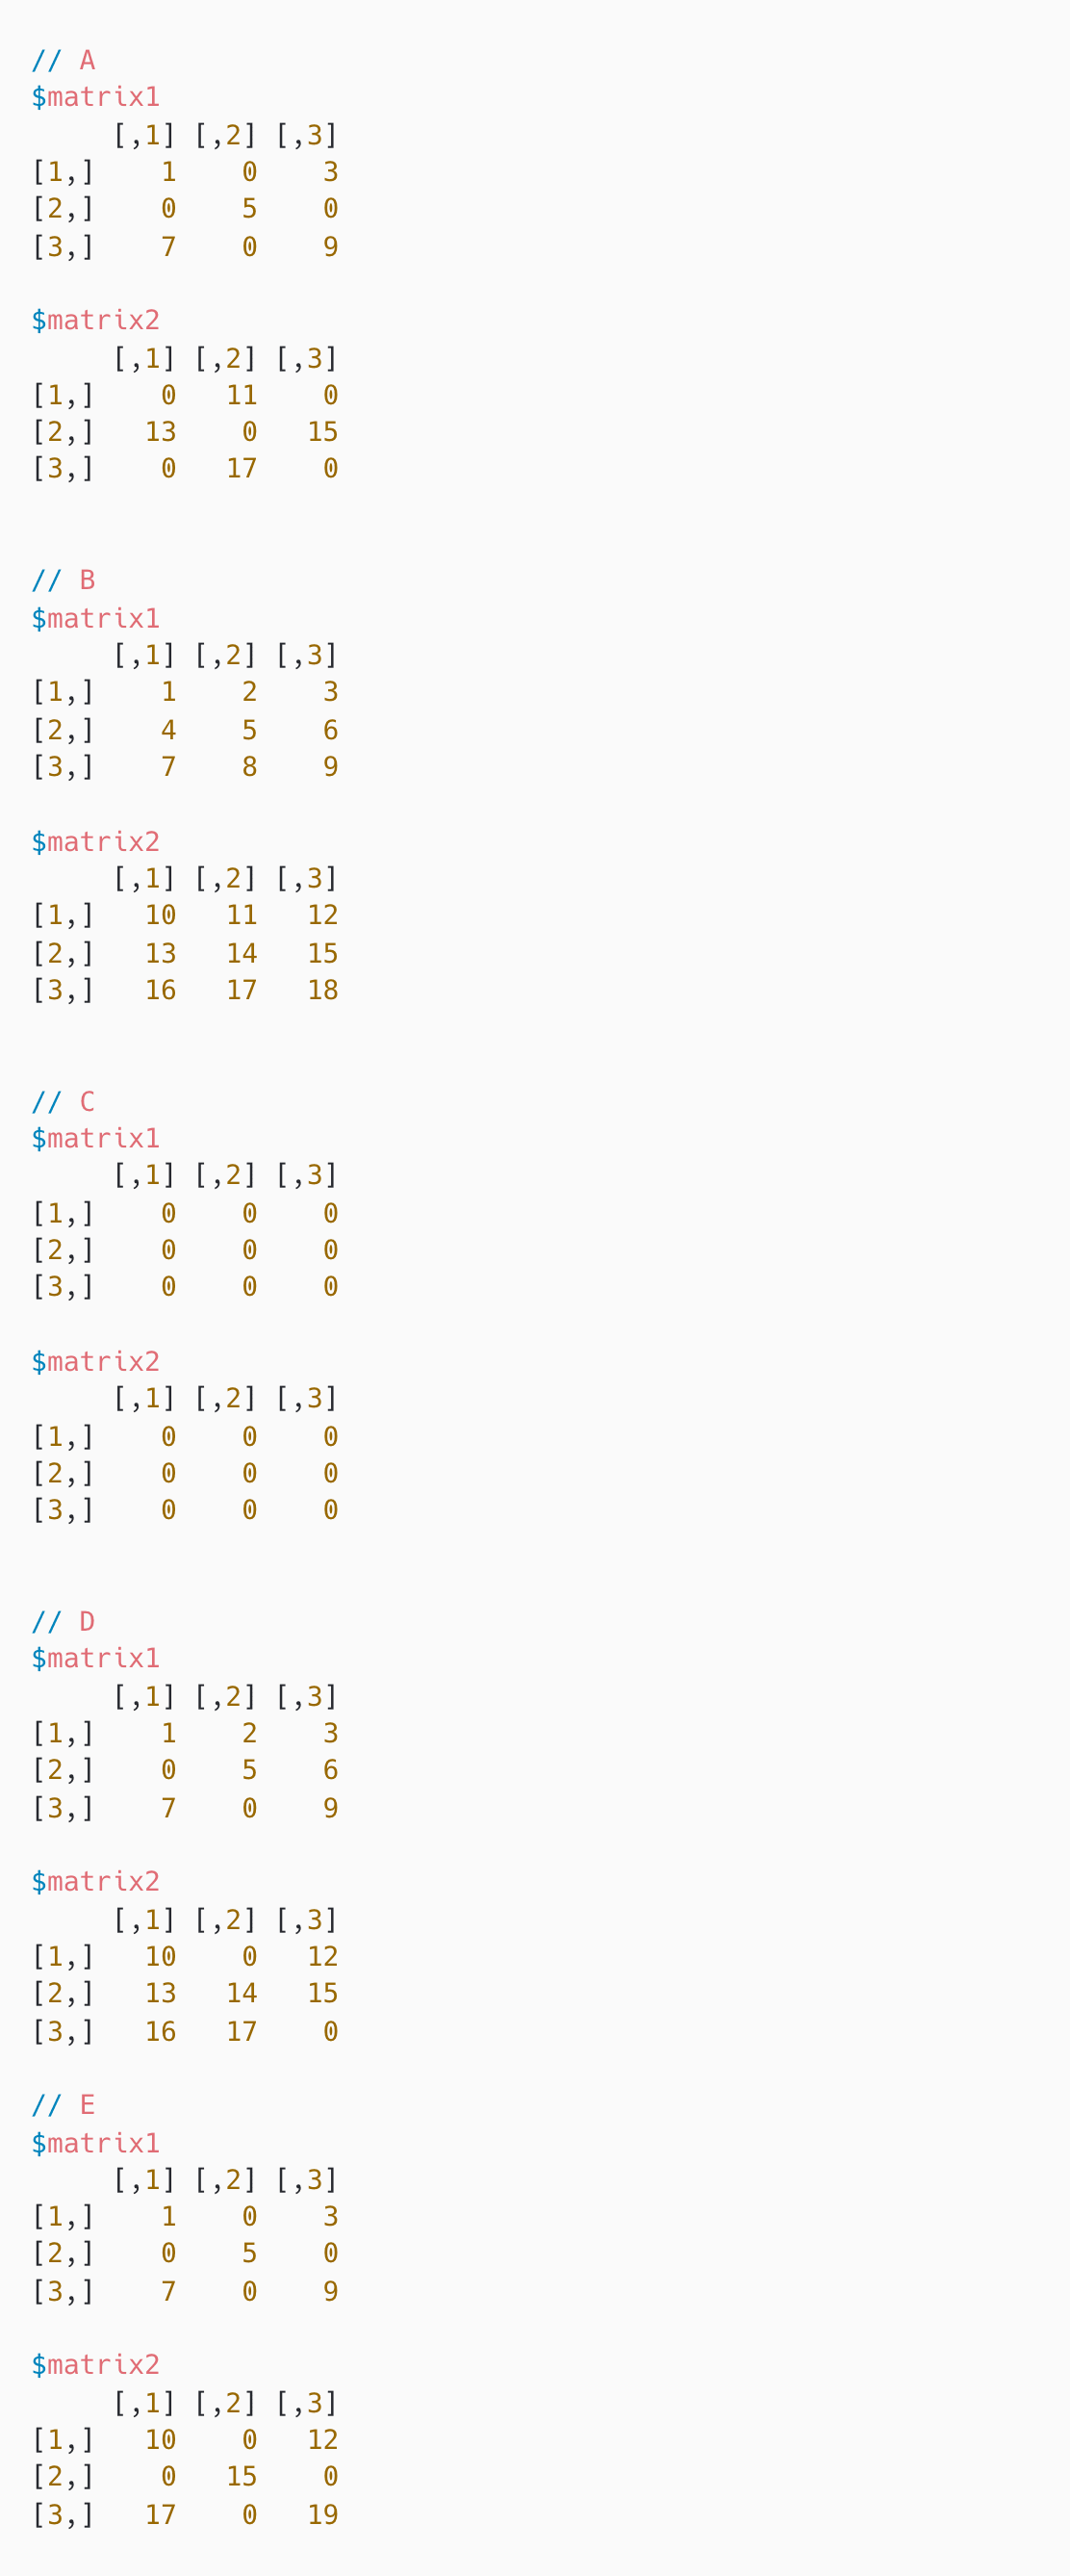
Medium Matrix Manipulation | Solve | ||||
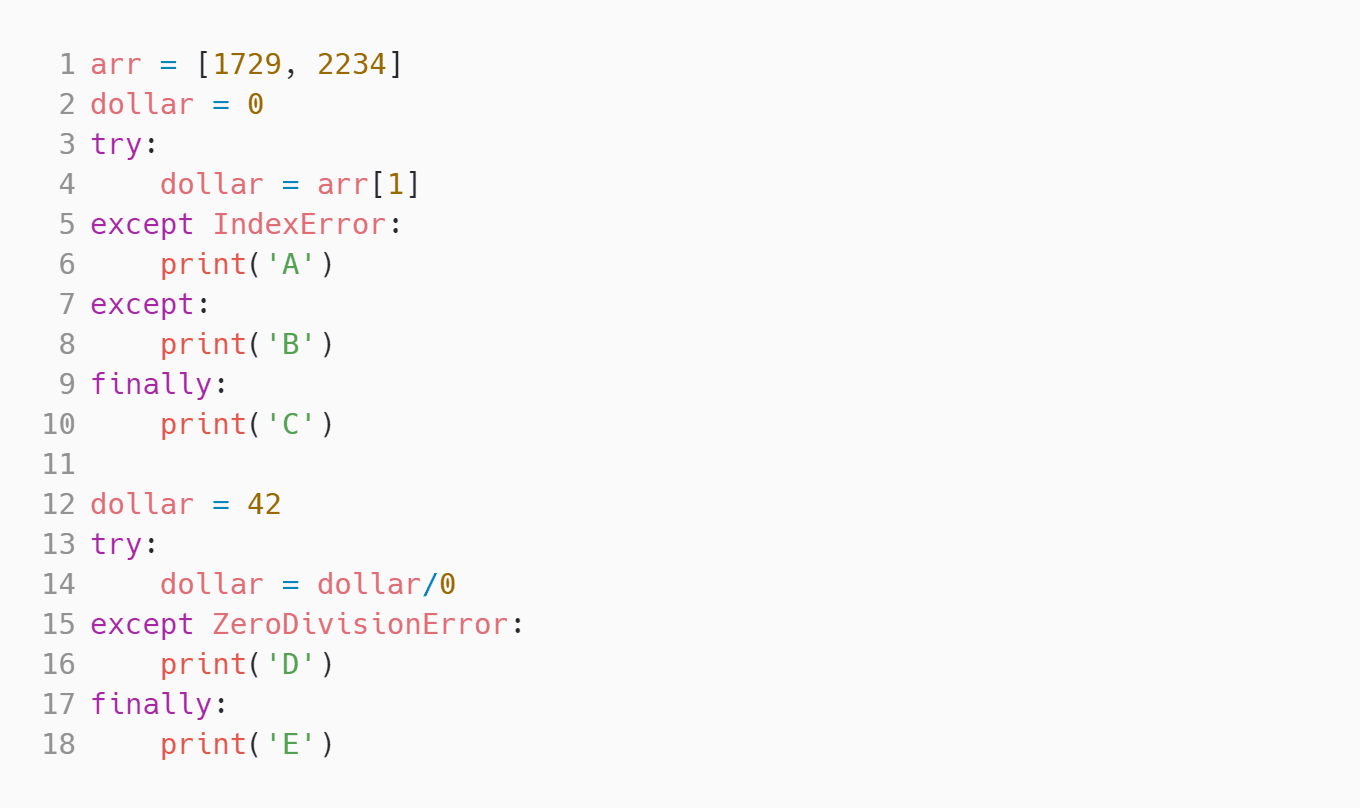
Medium ZeroDivisionError and IndexError | Solve | ||||
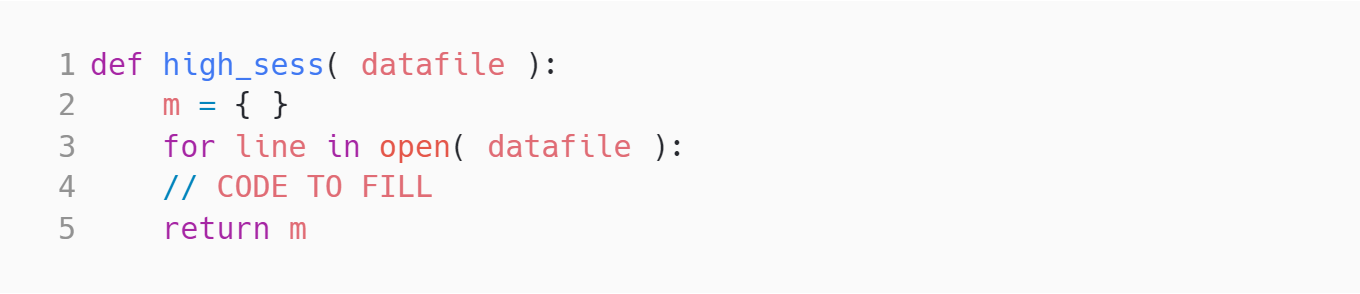
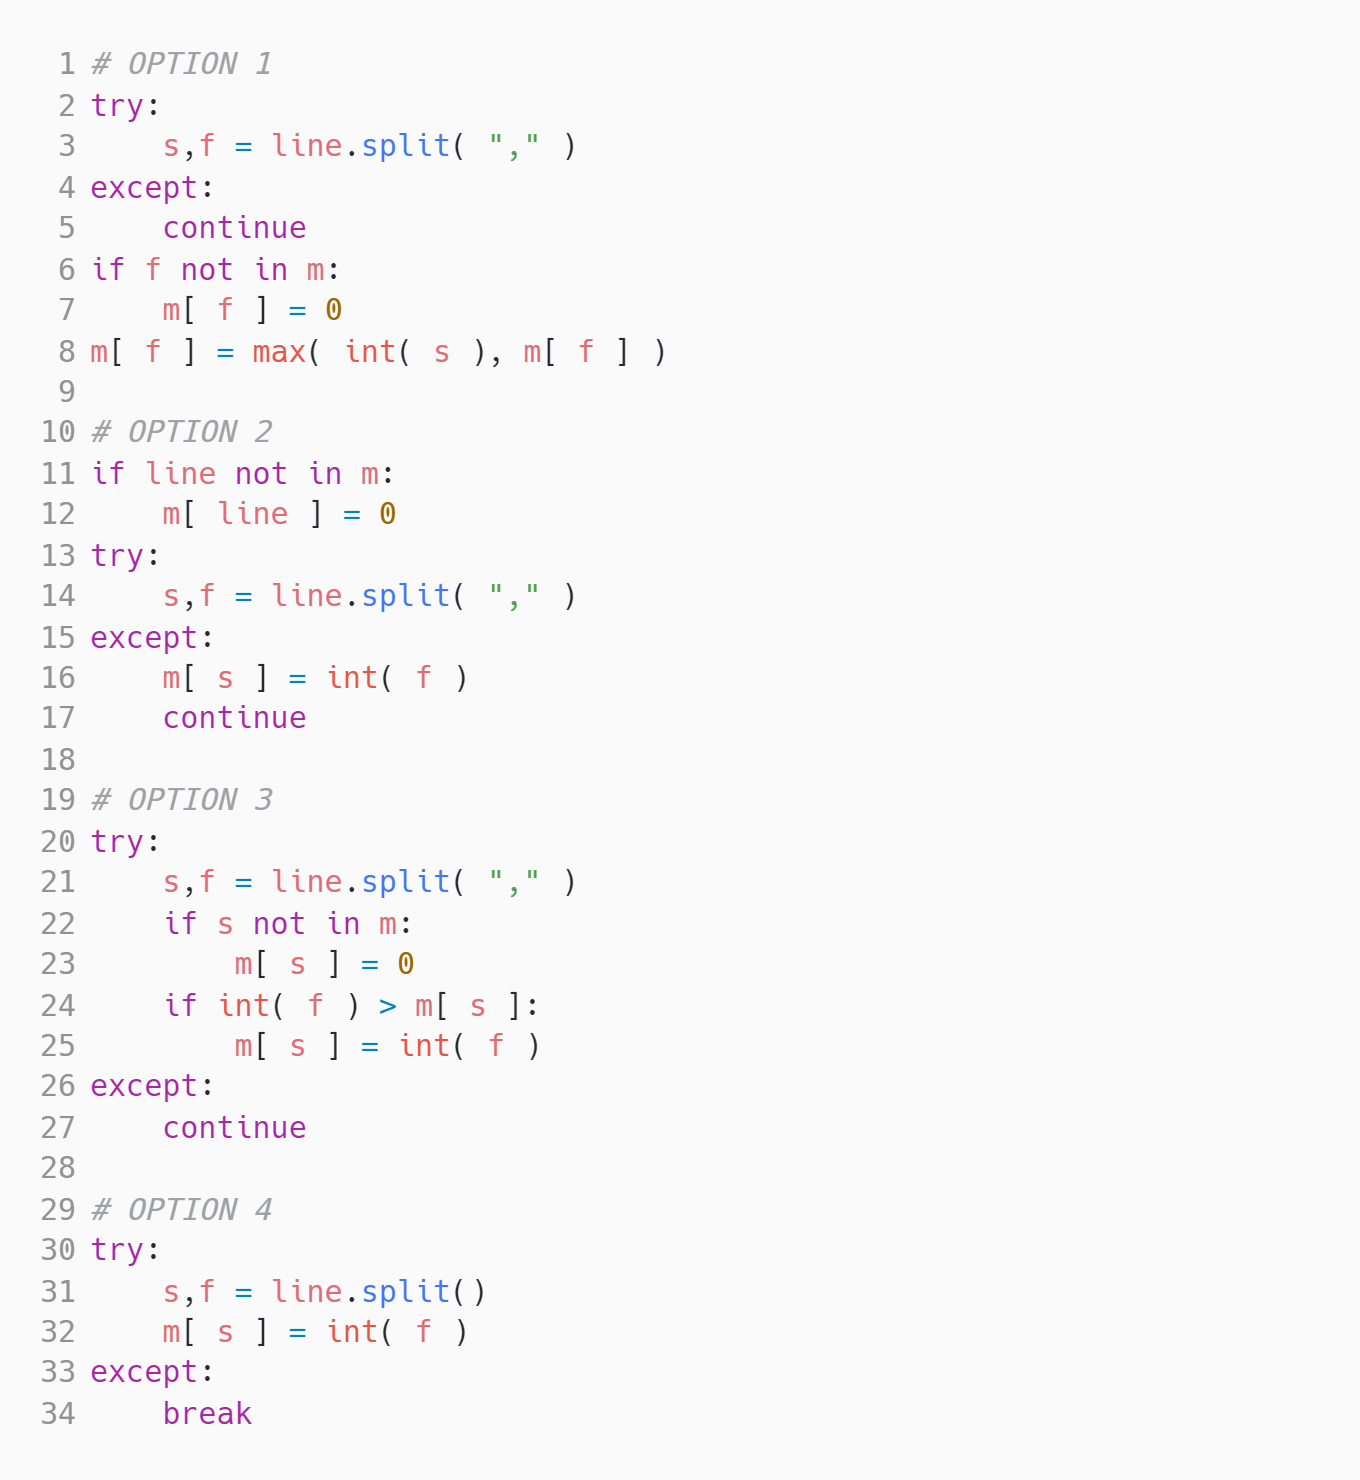
Medium Session | Solve | ||||
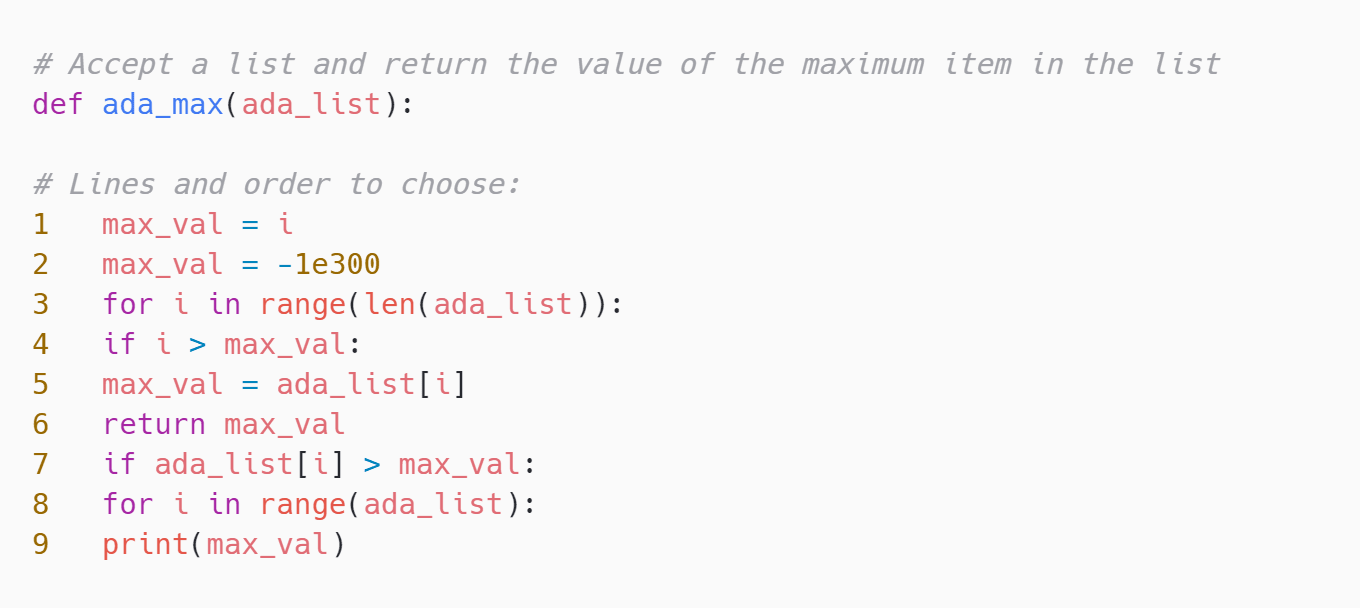
Medium Max Code | Solve | ||||
Medium Recursive Function | Solve | ||||
Medium Stacking problem | Solve | ||||
Medium Multi Select | Solve | ||||
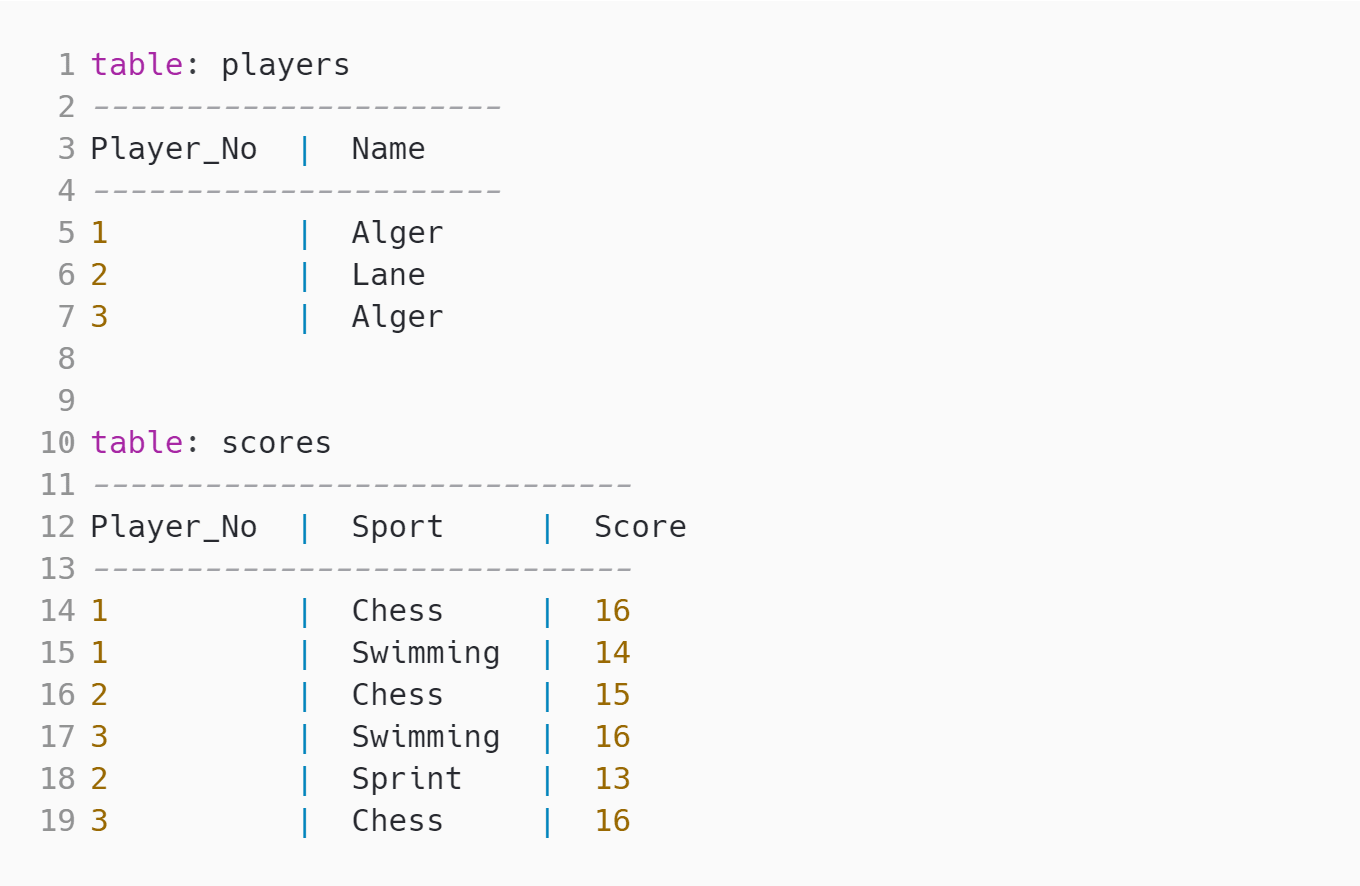
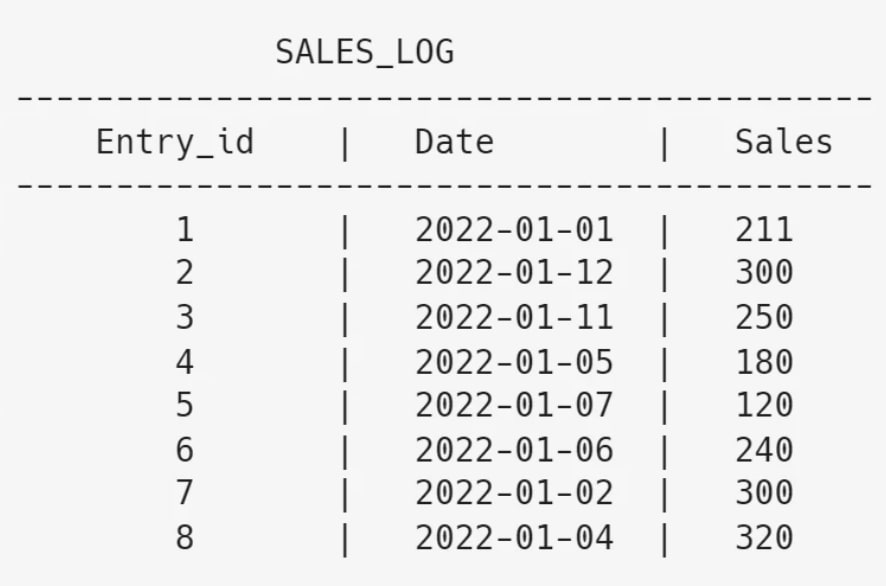
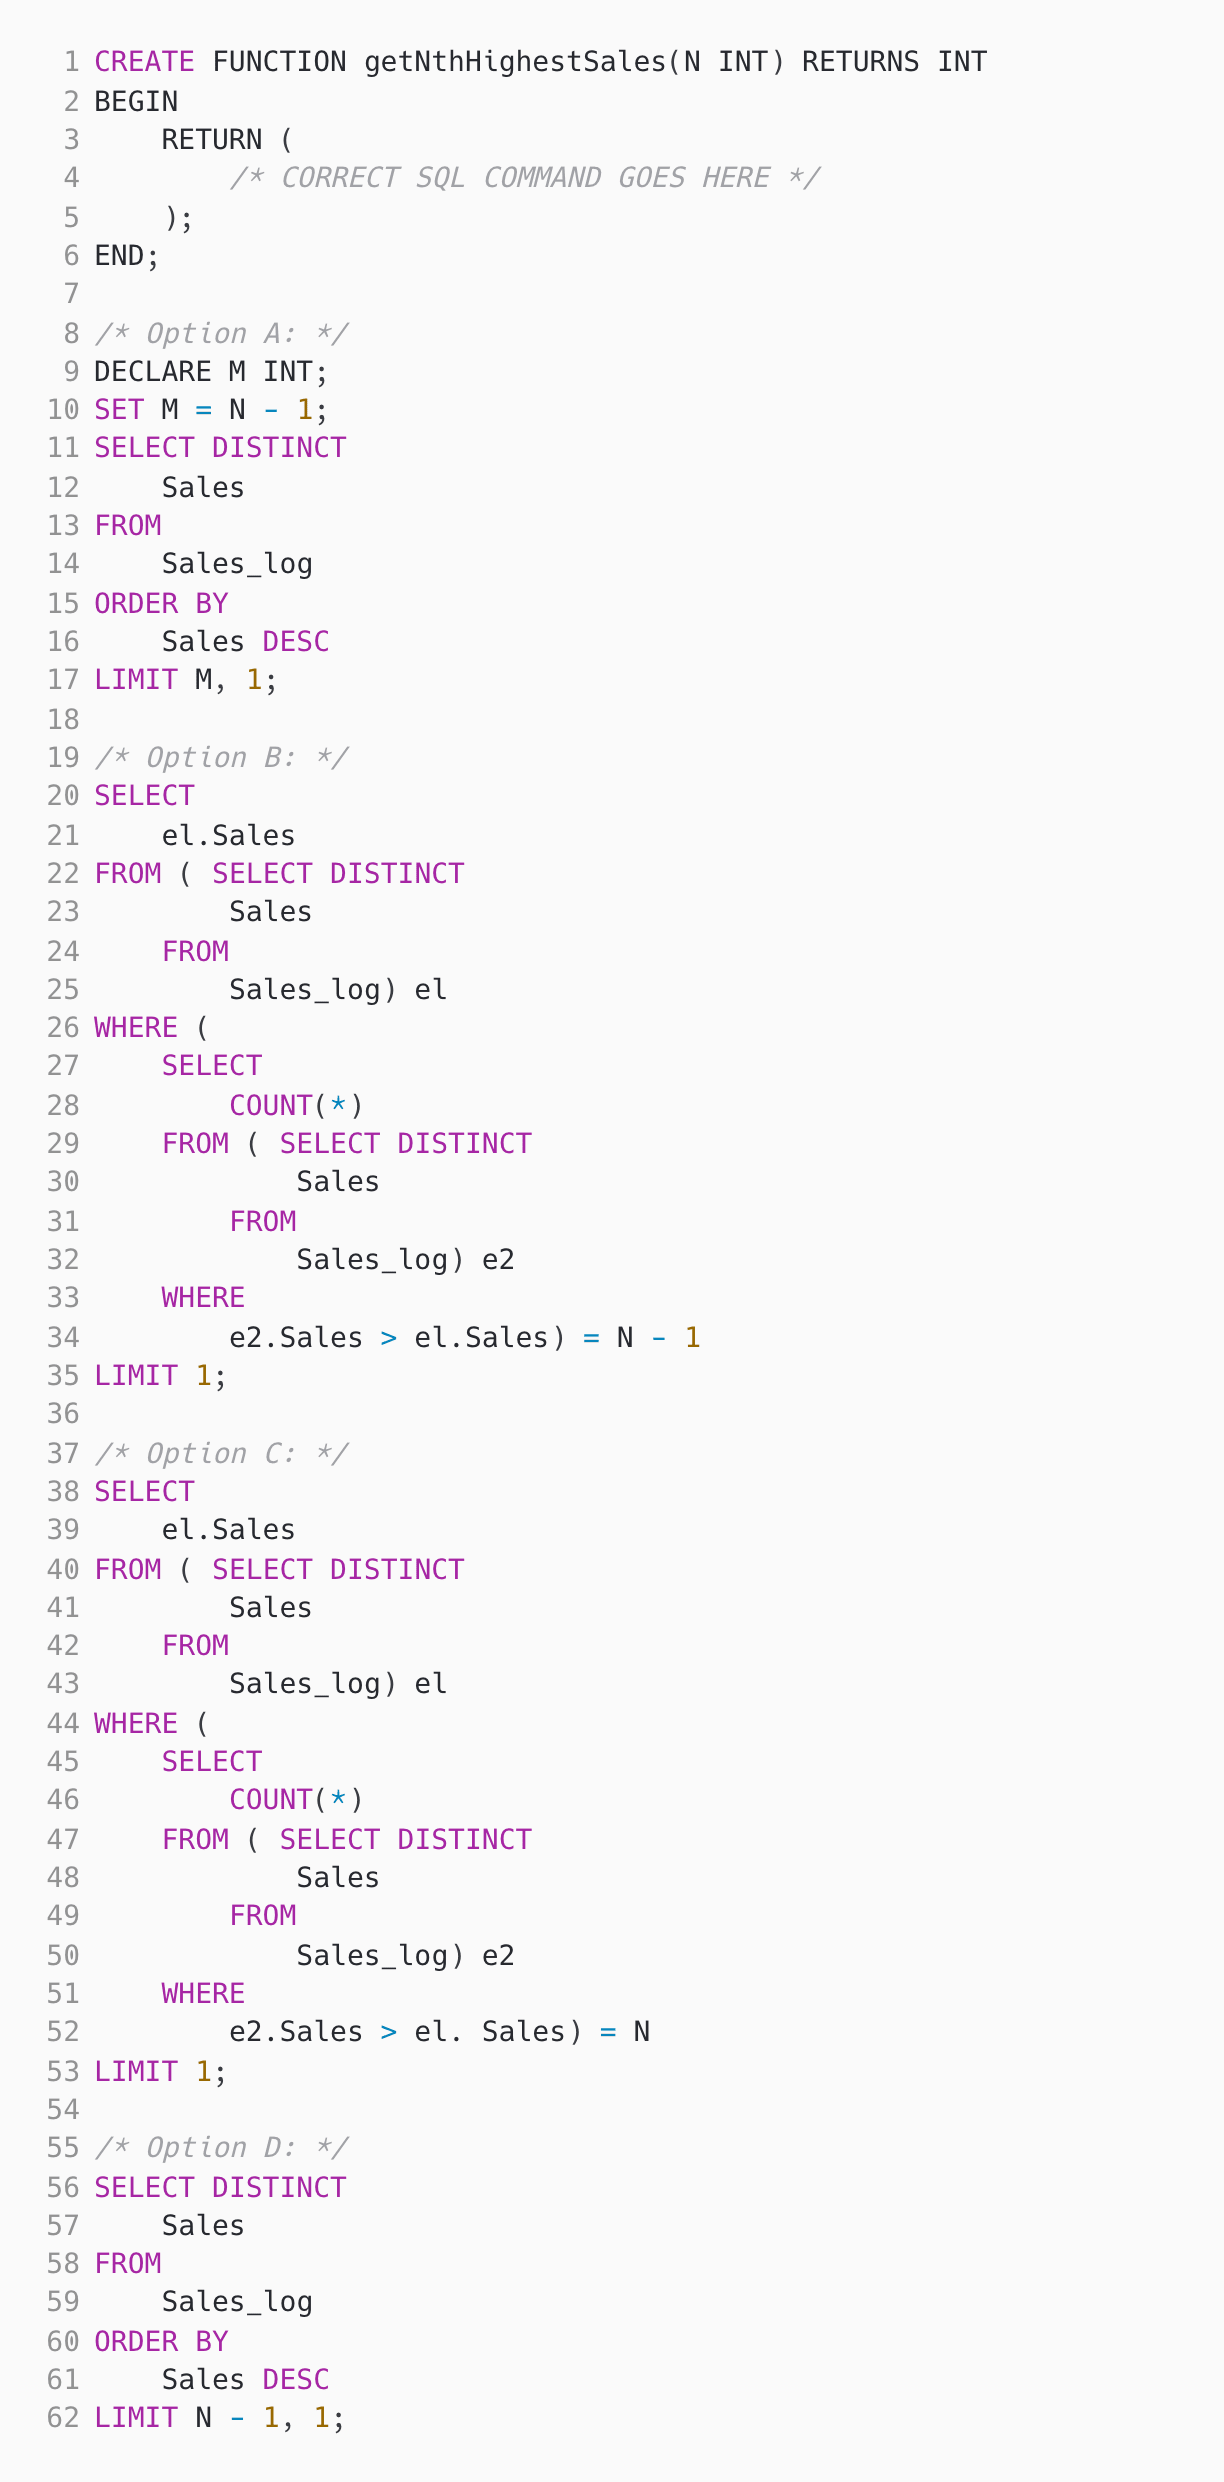
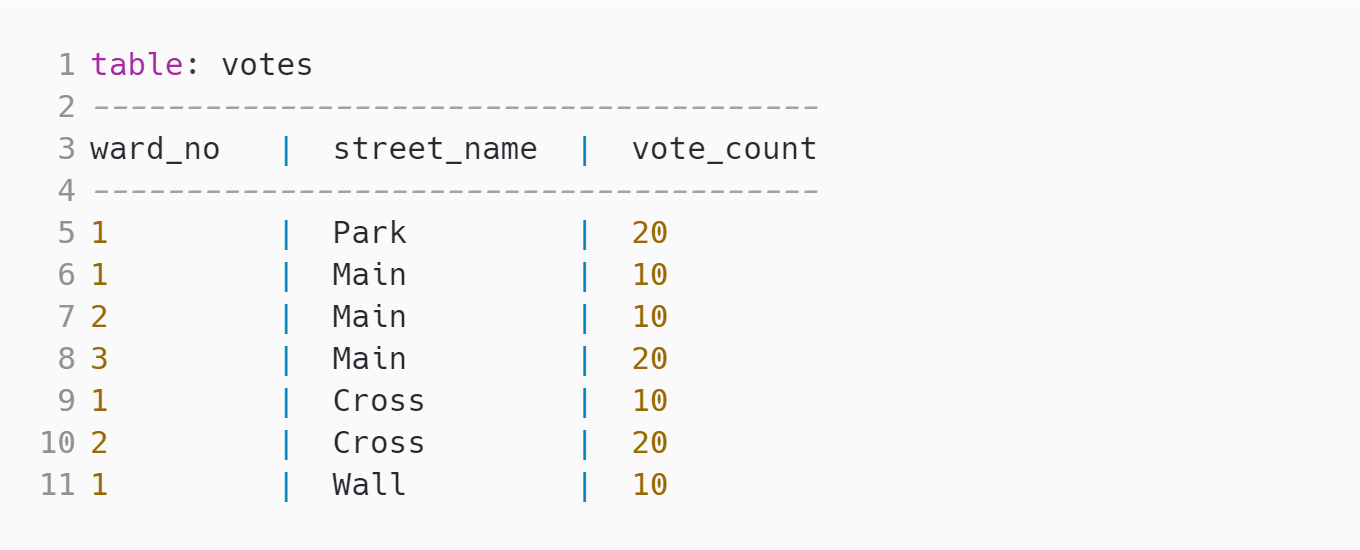
Medium nth highest sales | Solve | ||||
Medium Select & IN | Solve | ||||
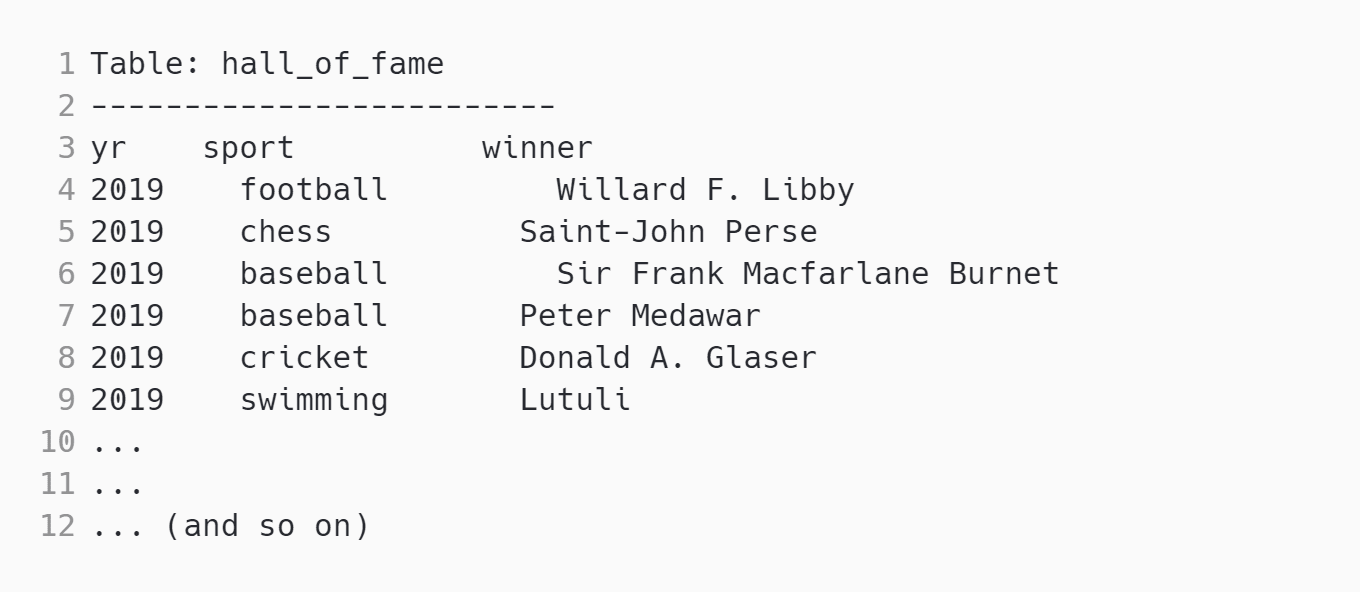
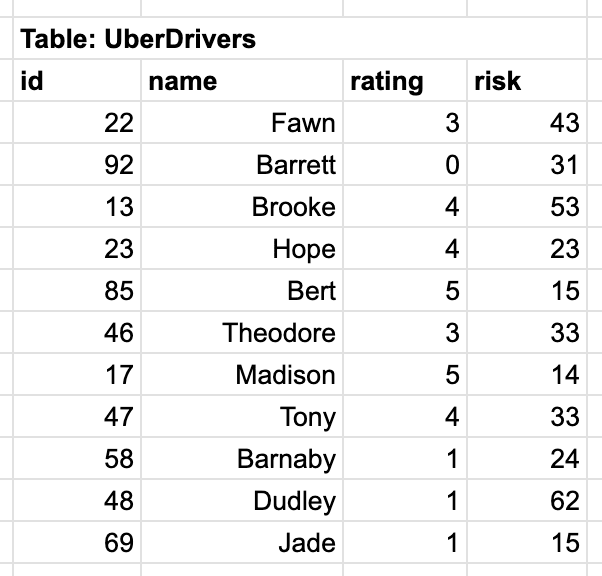
Medium Sorting Ubers | Solve | ||||
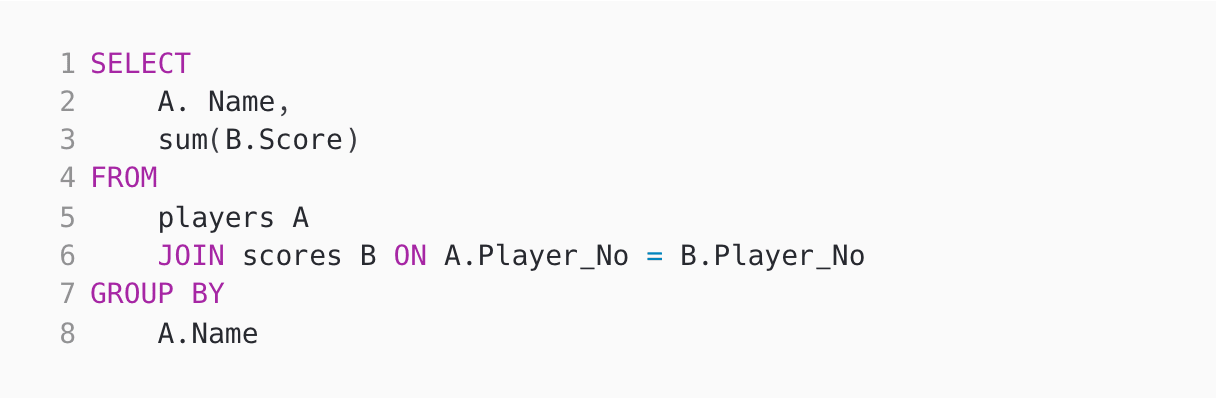
Hard With, AVG & SUM | Solve | ||||
Easy Registration Queue | Solve | ||||
Medium Visitors Count | Solve | ||||
| 🧐 Question | 🔧 Skill | ||
|---|---|---|---|
Medium Data Filtering | 2 mins Power BI | Solve | |
Medium Many-to-one error | 2 mins Power BI | Solve | |
Medium Power Query Functions | 2 mins Power BI | Solve | |
Medium Calculated Properties | 3 mins Tableau | Solve | |
Medium Change display icon | 2 mins Tableau | Solve | |
Easy Pie Chart | 3 mins Tableau | Solve | |
Medium Applying Functions | 3 mins R | Solve | |
Medium Dataframe Transform | 3 mins R | Solve | |
Medium Matrix Manipulation | 3 mins R | Solve | |
Medium ZeroDivisionError and IndexError | 2 mins Python | Solve | |
Medium Session | 2 mins Python | Solve | |
Medium Max Code | 2 mins Python | Solve | |
Medium Recursive Function | 3 mins Python | Solve | |
Medium Stacking problem | 4 mins Python | Solve | |
Medium Multi Select | 2 mins SQL | Solve | |
Medium nth highest sales | 3 mins SQL | Solve | |
Medium Select & IN | 3 mins SQL | Solve | |
Medium Sorting Ubers | 3 mins SQL | Solve | |
Hard With, AVG & SUM | 2 mins SQL | Solve | |
Easy Registration Queue | 30 mins Coding | Solve | |
Medium Visitors Count | 30 mins Coding | Solve |
| 🧐 Question | 🔧 Skill | 💪 Difficulty | ⌛ Time | ||
|---|---|---|---|---|---|
Data Filtering | Power BI | Medium | 2 mins | Solve | |
Many-to-one error | Power BI | Medium | 2 mins | Solve | |
Power Query Functions | Power BI | Medium | 2 mins | Solve | |
Calculated Properties | Tableau | Medium | 3 mins | Solve | |
Change display icon | Tableau | Medium | 2 mins | Solve | |
Pie Chart | Tableau | Easy | 3 mins | Solve | |
Applying Functions | R | Medium | 3 mins | Solve | |
Dataframe Transform | R | Medium | 3 mins | Solve | |
Matrix Manipulation | R | Medium | 3 mins | Solve | |
ZeroDivisionError and IndexError | Python | Medium | 2 mins | Solve | |
Session | Python | Medium | 2 mins | Solve | |
Max Code | Python | Medium | 2 mins | Solve | |
Recursive Function | Python | Medium | 3 mins | Solve | |
Stacking problem | Python | Medium | 4 mins | Solve | |
Multi Select | SQL | Medium | 2 mins | Solve | |
nth highest sales | SQL | Medium | 3 mins | Solve | |
Select & IN | SQL | Medium | 3 mins | Solve | |
Sorting Ubers | SQL | Medium | 3 mins | Solve | |
With, AVG & SUM | SQL | Hard | 2 mins | Solve | |
Registration Queue | Coding | Easy | 30 mins | Solve | |
Visitors Count | Coding | Medium | 30 mins | Solve |
Adaface を使用することで、最初の選考プロセスを 75% 以上最適化することができ、採用担当マネージャーと人材獲得チームの両方にとって貴重な時間を解放することができました。
Brandon Lee, 人々の責任者, Love, Bonito
The most important thing while implementing the pre-employment BI開発者テスト in your hiring process is that it is an elimination tool, not a selection tool. In other words: you want to use the test to eliminate the candidates who do poorly on the test, not to select the candidates who come out at the top. While they are super valuable, pre-employment tests do not paint the entire picture of a candidate’s abilities, knowledge, and motivations. Multiple easy questions are more predictive of a candidate's ability than fewer hard questions. Harder questions are often "trick" based questions, which do not provide any meaningful signal about the candidate's skillset.
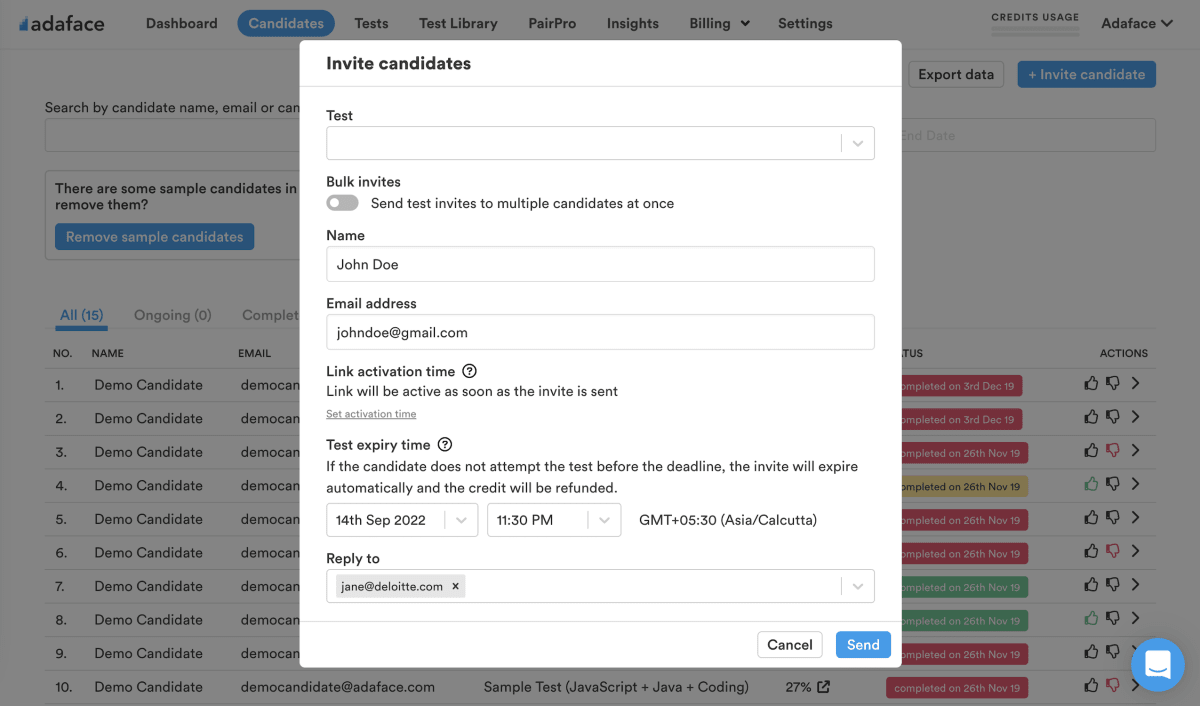
Science behind Adaface testsEmail invites: You can send candidates an email invite to the BI開発者テスト from your dashboard by entering their email address.
Public link: You can create a public link for each test that you can share with candidates.
API or integrations: You can invite candidates directly from your ATS by using our pre-built integrations with popular ATS systems or building a custom integration with your in-house ATS.
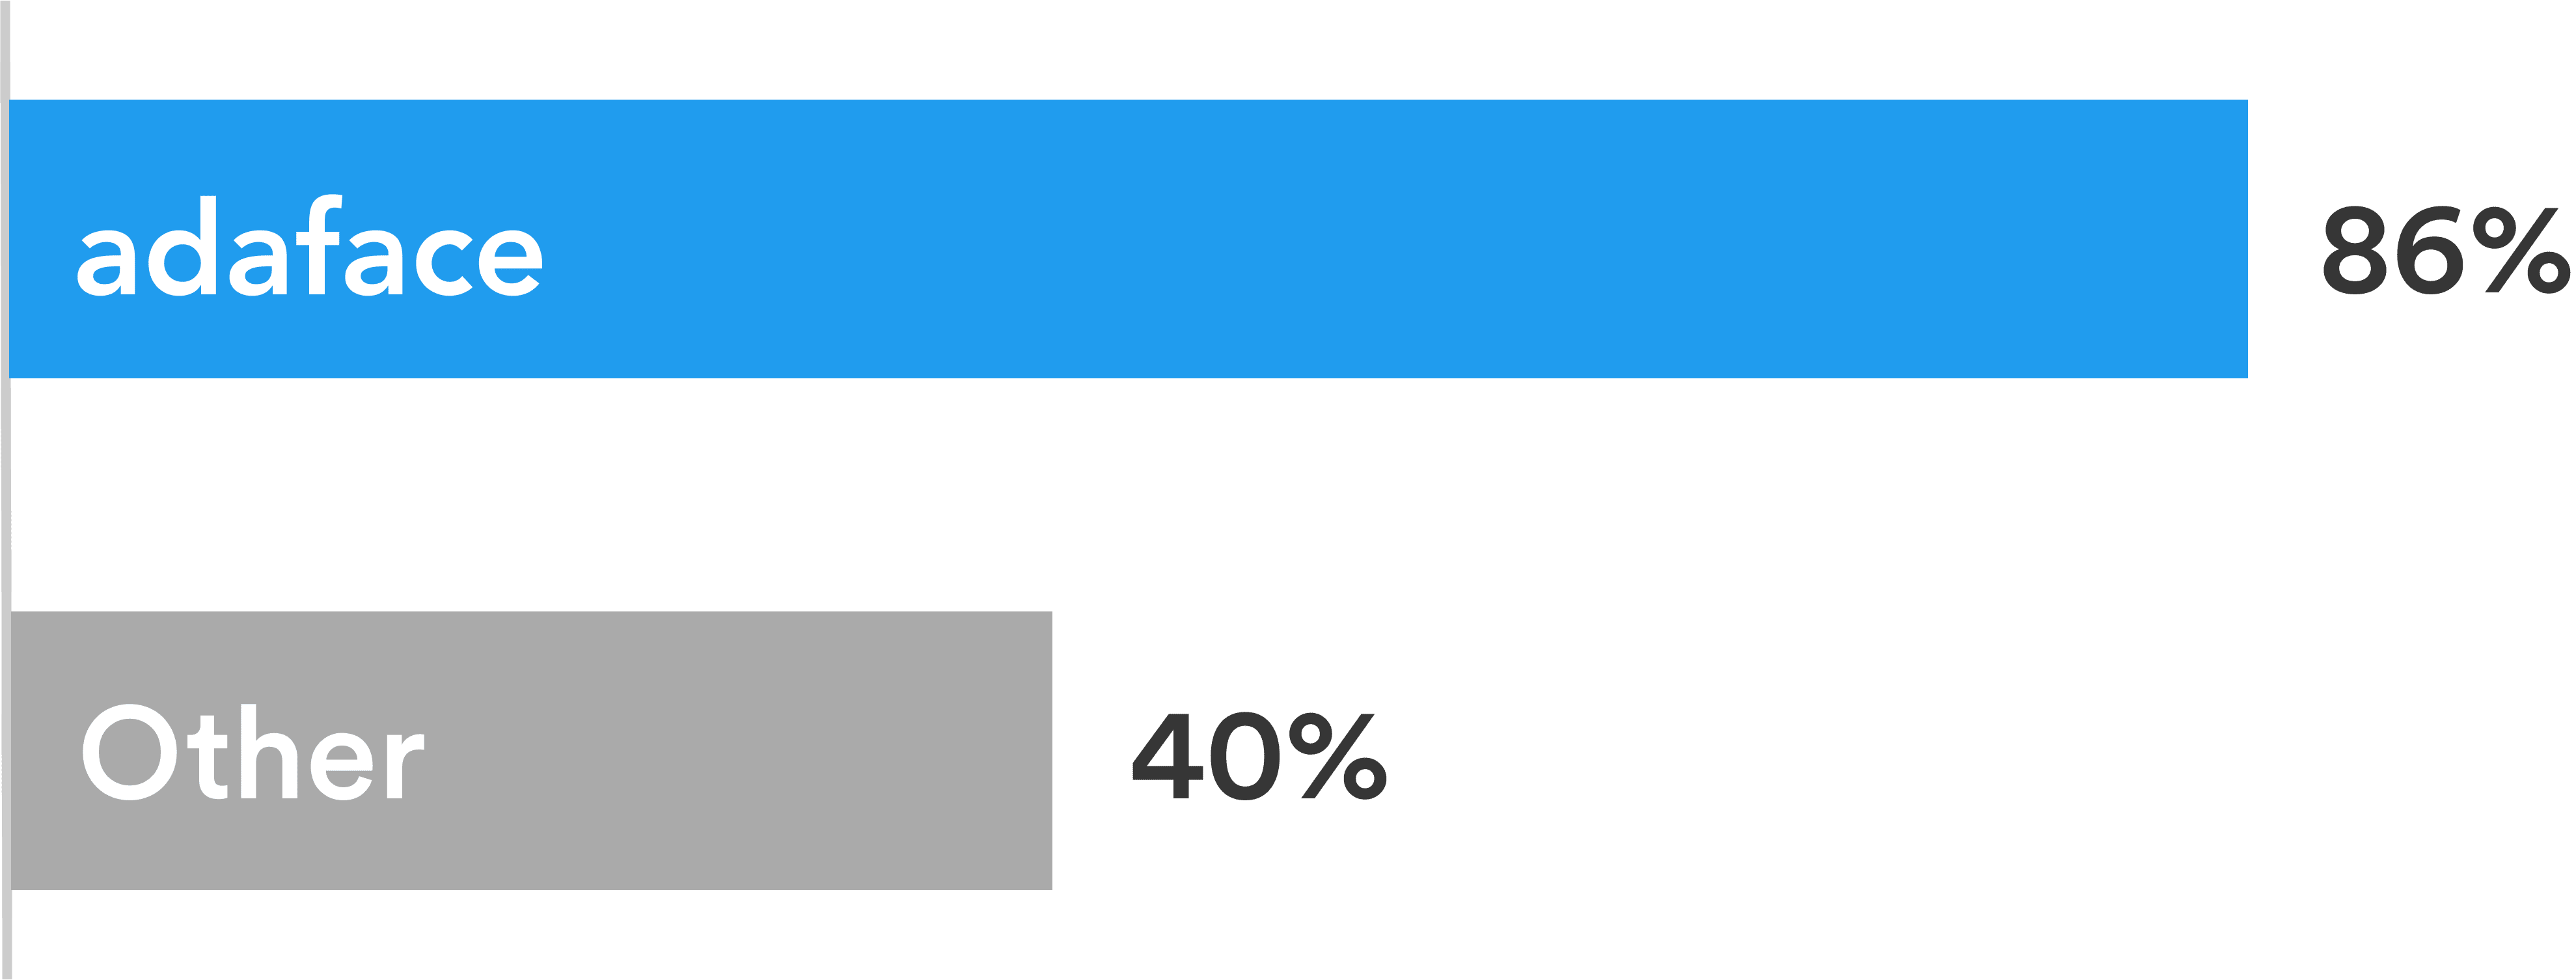
Adaface tests are conversational, low-stress, and take just 25-40 mins to complete.
This is why Adaface has the highest test-completion rate (86%), which is more than 2x better than traditional assessments.
ChatGPT protection
Screen proctoring
Plagiarism detection
Non-googleable questions
User authentication
IP proctoring
Web proctoring
Webcam proctoring
Full screen proctoring
Copy paste protection
採用担当者は、パネル面接中に尋ねる専門的な質問を通じて、どの候補者がより良いスコアを持っているかを判断し、スコアがそれほど高くない候補者と区別できると感じました。彼らです 非常に満足 Adaface のスクリーニングで最終候補者リストに選ばれた候補者の質を重視します。
そのとおり。カスタム評価は、職務内容に基づいて設定され、指定したすべての必須スキルに関する質問が含まれます。
次のアンチチート機能があります。
[プロクチャリング機能](https://www.adaface.com/proctoring)の詳細をご覧ください。
留意すべき主なことは、評価が選択ツールではなく排除ツールであることです。スキル評価が最適化され、技術的にその役割の資格がない候補者を排除するのに役立ちます。これは、役割の最良の候補者を見つけるのに役立つために最適化されていません。したがって、評価を使用する理想的な方法は、しきい値スコア(通常は55%、ベンチマークを支援します)を決定し、インタビューの次のラウンドのしきい値を超えてスコアを上回るすべての候補者を招待することです。
各ADAFACE評価は、職務記述書/理想的な候補者のペルソナにカスタマイズされます(当社の主題の専門家は、10000以上の質問のライブラリからあなたの評価に適切な質問を選択します)。この評価は、あらゆる経験レベルでカスタマイズできます。
はい、候補者を比較するのがはるかに簡単になります。 MCQの質問と質問の順序のオプションはランダム化されます。 [https://www.adaface.com/proctoring)機能を備えている[アンチチート/監督](https://www.adaface.com/proctoring)があります。エンタープライズプランでは、同様の難易度の問題を伴う同じ評価の複数のバージョンを作成するオプションもあります。
いいえ。残念ながら、現時点では練習テストをサポートしていません。ただし、[サンプルの質問](https://www.adaface.com/questions)を使用するには、練習できます。
ADAFACEの[カスタム評価をリクエストする方法](https://help.adaface.com/en/articles/6324286-requesting-a-custom-test)に関するクイックガイドを示します。