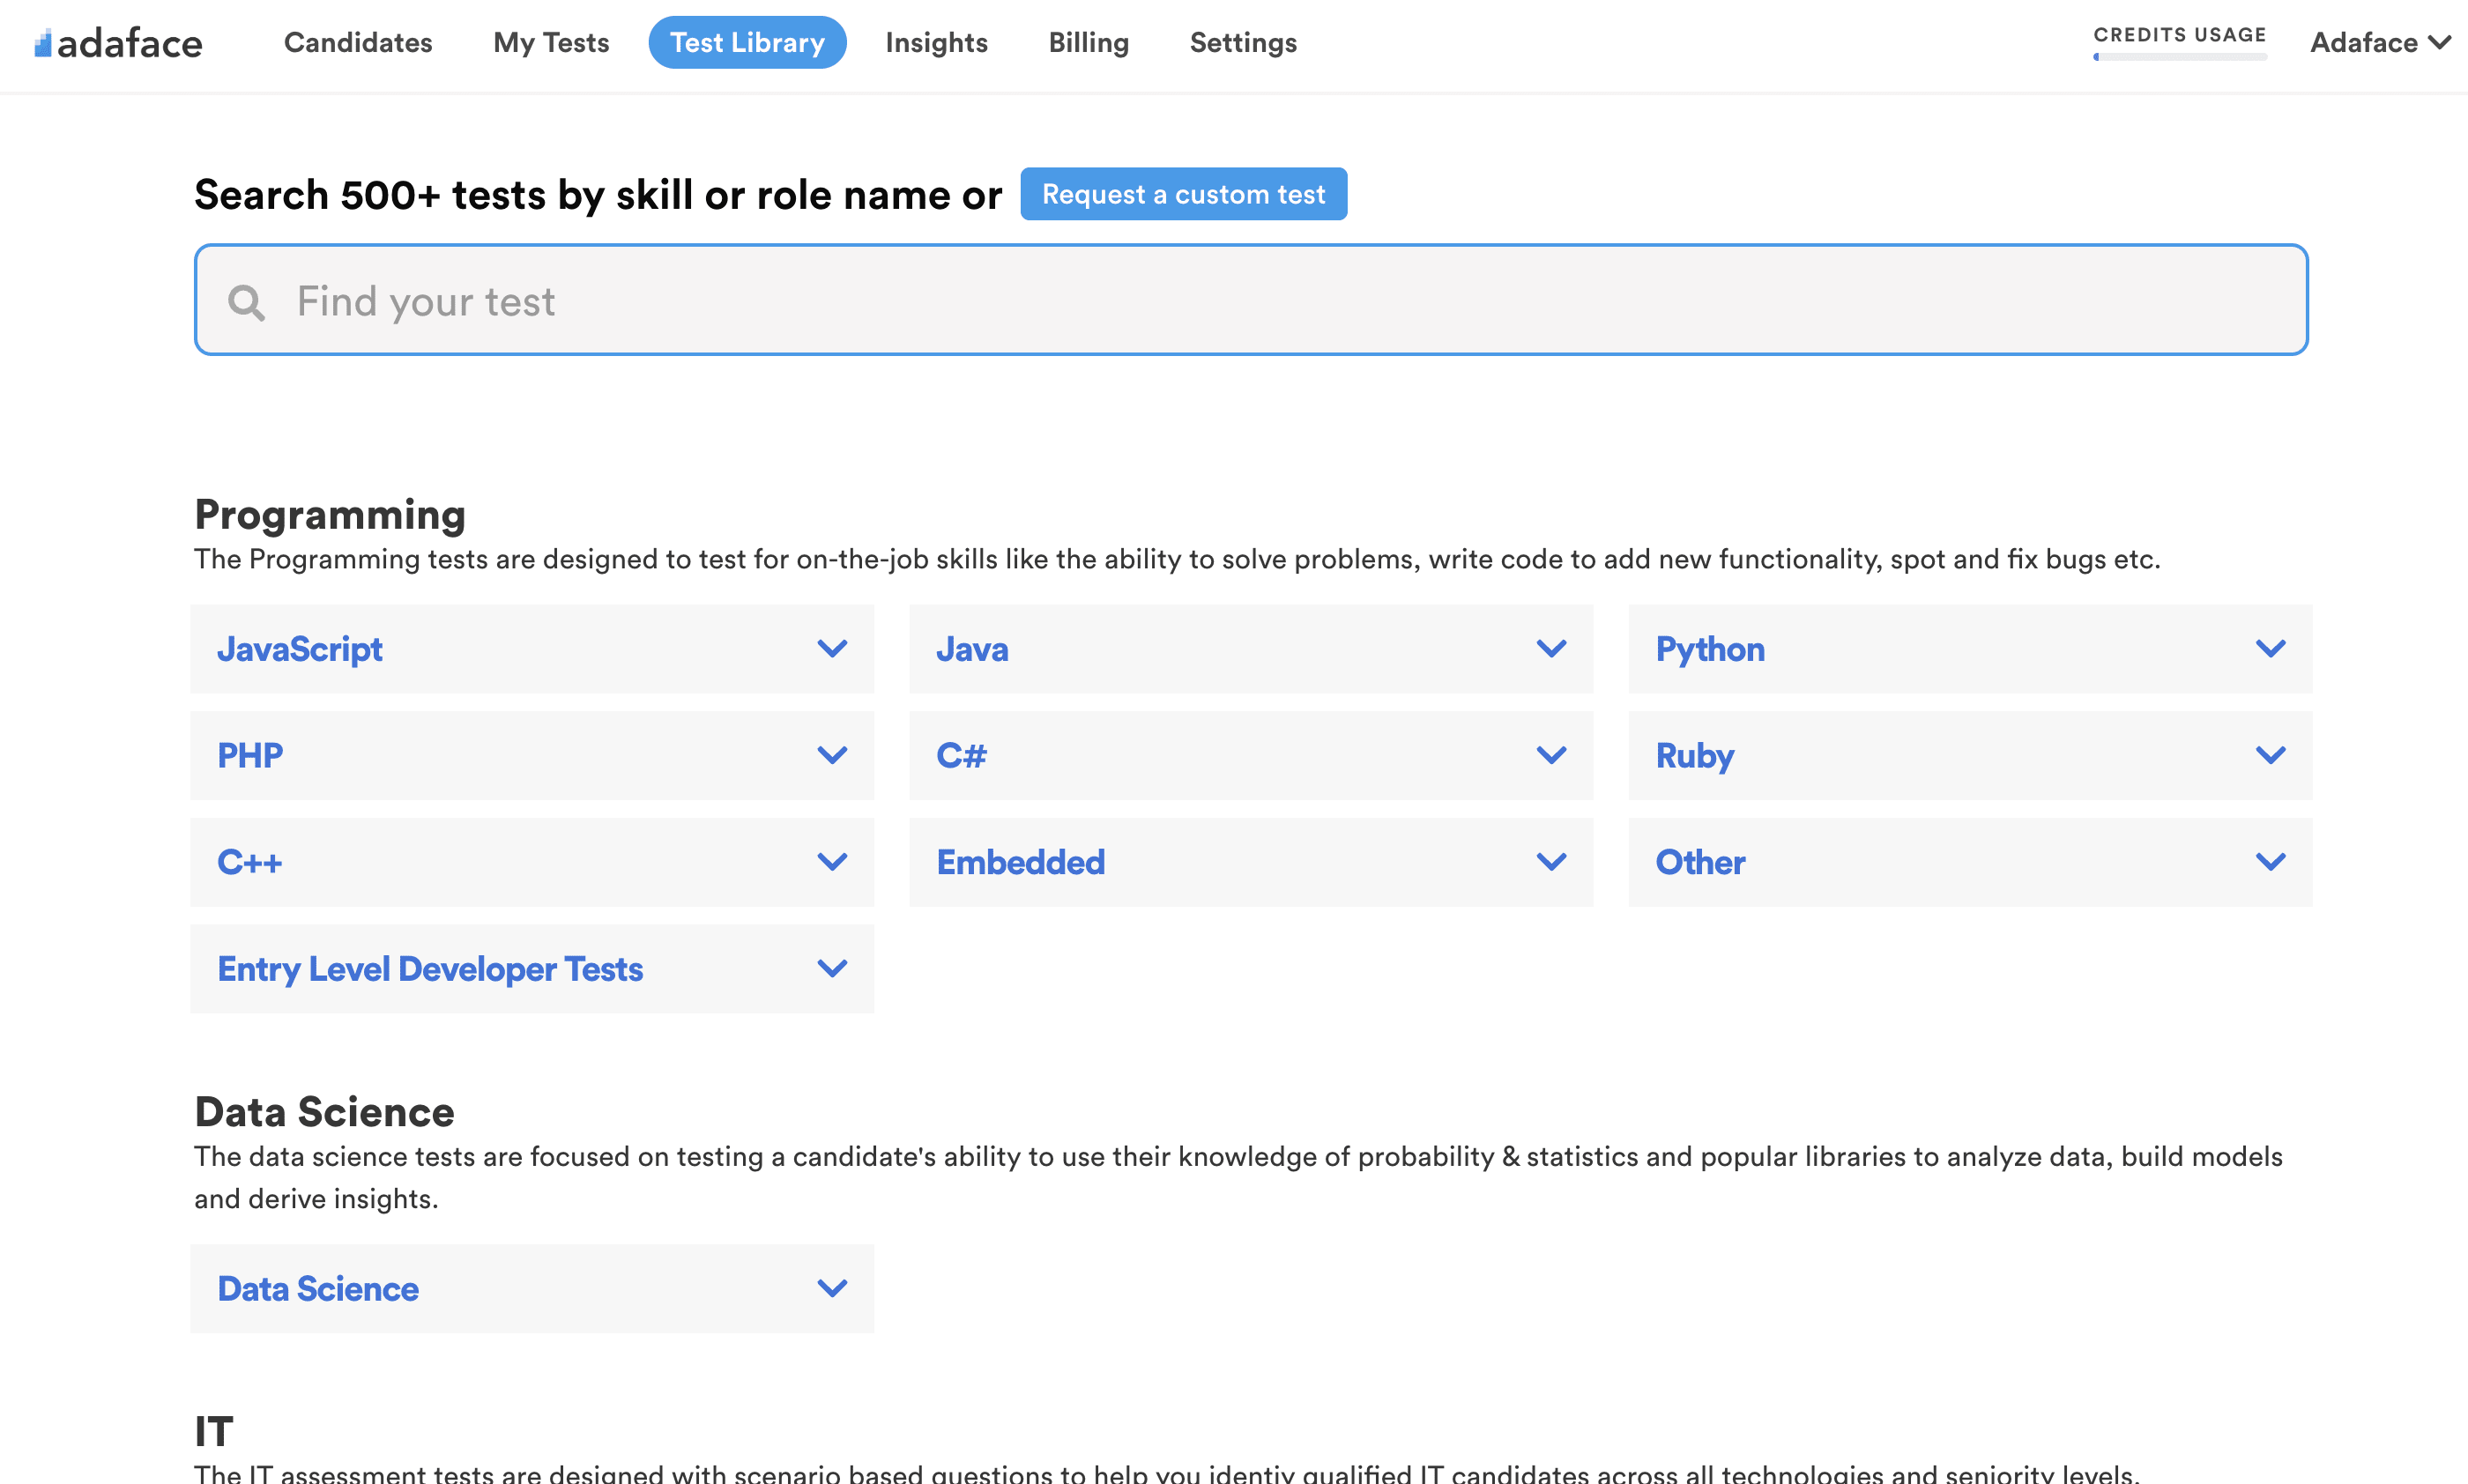
Search test library by skills or roles
⌘ K

About the test:

La prueba de desarrollador de inteligencia empresarial utiliza preguntas de opción múltiple basadas en escenarios para evaluar el conocimiento y las habilidades de un candidato relacionados con el modelado de datos y los procesos ETL, el almacenamiento de datos y la minería de datos, los informes y la visualización de BI, el análisis de datos y el modelado predictivo, y la gestión de proyectos de BI. Los candidatos también se evalúan sobre su capacidad para utilizar herramientas y tecnologías de BI, como SQL Server, Power BI, Tableau y otras herramientas relacionadas, y su competencia en la aplicación de análisis de datos y técnicas de inteligencia empresarial para resolver problemas comerciales complejos.

Covered skills:

  • Conectarse a fuentes de datos en Power BI
  • Fórmulas Dax
  • Creación de paneles y acciones en Tableau
  • Filtrar y analizar datos de Tableau
  • Manipulación de cadenas en r
  • Sintaxis de pitón
  • Operaciones SQL CRUD
  • Programación de Python
  • Data disputas y transformaciones en Power BI
  • Conectarse con datos de múltiples fuentes
  • Gestión de hojas de trabajo y libros de trabajo de Tableau
  • Vectores y marcos de datos en R
  • Análisis con R
  • Python oops
  • SQL se une e índices

9 reasons why
9 reasons why

Adaface Prueba de desarrollador de BI is the most accurate way to shortlist Desarrollador de bis


Reason #1

Tests for on-the-job skills

The Prueba de desarrollador de BI helps recruiters and hiring managers identify qualified candidates from a pool of resumes, and helps in taking objective hiring decisions. It reduces the administrative overhead of interviewing too many candidates and saves time by filtering out unqualified candidates at the first step of the hiring process.

The test screens for the following skills that hiring managers look for in candidates:

  • Conectarse a fuentes de datos en Power BI
  • Realización de disputas de datos y transformaciones en Power BI
  • Utilización de fórmulas DAX en Power BI
  • Conectarse con datos de múltiples fuentes
  • Creación de paneles y acciones interactivas en Tableau
  • Gestión de hojas de trabajo y libros de trabajo de Tableau
  • Filtrar y analizar datos en Tableau
  • Trabajar con vectores y marcos de datos en R
  • Manipulando cuerdas en r
  • Realización de análisis con R
  • Comprender la sintaxis de Python
  • Implementación de conceptos de python oops
  • Ejecución de operaciones SQL CRUD
  • Dominar SQL se une e índices
  • Demostrando competencia en la programación de Python
Reason #2

No trick questions

no trick questions

Traditional assessment tools use trick questions and puzzles for the screening, which creates a lot of frustration among candidates about having to go through irrelevant screening assessments.

View sample questions

The main reason we started Adaface is that traditional pre-employment assessment platforms are not a fair way for companies to evaluate candidates. At Adaface, our mission is to help companies find great candidates by assessing on-the-job skills required for a role.

Why we started Adaface
Reason #3

Non-googleable questions

We have a very high focus on the quality of questions that test for on-the-job skills. Every question is non-googleable and we have a very high bar for the level of subject matter experts we onboard to create these questions. We have crawlers to check if any of the questions are leaked online. If/ when a question gets leaked, we get an alert. We change the question for you & let you know.

How we design questions

Estas son solo una pequeña muestra de nuestra biblioteca de más de 10,000 preguntas. Las preguntas reales sobre esto Prueba de desarrollador de BI no se puede obtener.

🧐 Question

Medium

Data Filtering
Report Development
M Language
Data Visualization
Solve
You are creating a Power BI report where users need to dynamically filter data based on a range of dates. The report has a Sales table with columns Date, ProductID, and Amount. You decide to use a Power Query parameter to allow users to select a start and end date, which will then filter the Sales table accordingly. The parameter is named DateRange and has a type of List. You need to write a Power Query M formula to filter the Sales table based on the selected date range. The DateRange parameter contains two dates: the first item is the start date, and the second item is the end date. How should the M formula be structured to achieve this functionality?
A: Table.SelectRows(Sales, each [Date] >= DateRange{0} and [Date] <= DateRange{1})

B: Sales{[Date] >= DateRange{0}, [Date] <= DateRange{1}}

C: Table.FilterRows(Sales, each [Date] >= List.First(DateRange) and [Date] <= List.Last(DateRange))

D: Table.SelectRows(Sales, each [Date] >= List.First(DateRange) and [Date] <= List.Last(DateRange))

E: Filter.Table(Sales, [Date] >= DateRange{0}, [Date] <= DateRange{1})

Medium

Many-to-one error
Data Modeling
Solve
Consider the following two tables in Power BI:
 image
We received the following error when we tried to set many-to-one cardinality between devices to users tables: “The cardinality you selected isn’t valid for this relationship”. What should we do before creating the many-to-one relationship?

Medium

Power Query Functions
Power Query
Solve
Review the following Microsoft SQL Server table:
 image
Complete the following Power Query formula used to create a custom column to replace the numbers present in last 11 characters of ISBN with 11 ‘*’. Example ‘978-0-365-51051-4’ is converted to ‘978-0-***-*****-*’
 image
A: Text.Insert
B: Text.Replace
C: Text.Start
D: Text.End

Medium

Calculated Properties
Data Analysis
Solve
Here’s sample data imported into Tableau:
 image
Assume only three rows of data is present in the source. Once the data is imported, we added to new calculated fields:

Measure 1 with the formula: SUM([Profit])/SUM([Sales])
Measure 2 with the formula: SUM([Profit]/[Sales])

If we dragged Profit, Sales, Measure 1 and Measure 2 in the viewer as shown here:
 image
Pick the correct statements regarding columns Measure 1, Measure 2 and the row Grand total:
A: Values of Measure 1 would be 0.08, 0.075 and 0.1
B: Values of Measure 2 would be 0.08, 0.075 and 0.1
C: Values of Measure 1 would be 0.08, 0.769 and 0.08
D: Values of Measure 2 would be 0.08, 0.769 and 0.08
E: Values of Measure 1 would be 0.08, 0.155 and 0.255
F: Values of Measure 2 would be 0.08, 0.155 and 0.255
G: Grand total of Measure 1 would be 0.08
H: Grand total of Measure 2 would be 0.08
I: Grand total of Measure 1 would be 0.255
J: Grand total of Measure 2 would be 0.255

Medium

Change display icon
Solve
What steps would you take to change the following view so that Office Supplies is represented by a different symbol?
 image
A: Click on shapes in the marks area. Then select Office Supplies and the icon of choice and click okay.
B: Right-click on product category, select default properties, and select shape. Then select Office Supplies and the icon of choice and click okay.
C: Right click on the square and select "change shape" from the popup menu. Select the icon of choice and click okay.
D: A, B or C
E: None of these would work

Easy

Pie Chart
Data Analysis
Charts
Solve
We have the following dataset in Tableau:
 image
Which of the following Marks settings will result in following Pie chart?
 image
A: Drag Name to Color
B: Drag Share to Color
C: Drag Name to Label
D: Drag Share to Label
E: Drag Name to Angle
F: Drag Share to Angle
G: Drag Name to Detail

Medium

Applying Functions
Data frames
Functions
Math
Solve
Consider the following R code:
 image
This script defines a function apply_fun that calculates the mean of a vector and adds it to the standard deviation of the vector. The apply function is then used to apply this function to each column of the data frame df. What will be the value of result after the script is run?

Medium

Dataframe Transform
Solve
Review the following Dataframe 'bazinga':
 image
Which of the following commands would turn it into the Dataframe shown below:
 image
 image

Medium

Matrix Manipulation
Matrices
Lists
Solve
Consider the following pseudo code:
 image
What will be the state of list_of_matrices after running the script?
 image

Medium

ZeroDivisionError and IndexError
Exceptions
Solve
What will the following Python code output?
 image

Medium

Session
File Handling
Dictionary
Solve
 image
The function high_sess should compute the highest number of events per session of each user in the database by reading a comma-separated value input file of session data. The result should be returned from the function as a dictionary. The first column of each line in the input file is expected to contain the user’s name represented as a string. The second column is expected to contain an integer representing the events in a session. Here is an example input file:
Tony,10
Stark,12
Black,25
Your program should ignore a non-conforming line like this one.
Stark,3
Widow,6
Widow,14
The resulting return value for this file should be the following dictionary: { 'Stark':12, 'Black':25, 'Tony':10, 'Widow':14 }
What should replace the CODE TO FILL line to complete the function?
 image

Medium

Max Code
Arrays
Solve
Below are code lines to create a Python function. Ignoring indentation, what lines should be used and in what order for the following function to be complete:
 image

Medium

Recursive Function
Recursion
Dictionary
Lists
Solve
Consider the following Python code:
 image
In the above code, recursive_search is a function that takes a dictionary (data) and a target key (target) as arguments. It searches for the target key within the dictionary, which could potentially have nested dictionaries and lists as values, and returns the value associated with the target key. If the target key is not found, it returns None.

nested_dict is a dictionary that contains multiple levels of nested dictionaries and lists. The recursive_search function is then called with nested_dict as the data and 'target_key' as the target.

What will the output be after executing the above code?

Medium

Stacking problem
Stack
Linkedlist
Solve
What does the below function ‘fun’ does?
 image
A: Sum of digits of the number passed to fun.
B: Number of digits of the number passed to fun.
C: 0 if the number passed to fun is divisible by 10. 1 otherwise.
D: Sum of all digits number passed to fun except for the last digit.

Medium

Multi Select
JOIN
GROUP BY
Solve
Consider the following SQL table:
 image
How many rows does the following SQL query return?
 image

Medium

nth highest sales
Nested queries
User Defined Functions
Solve
Consider the following SQL table:
 image
Which of the following SQL commands will find the ‘nth highest Sales’ if it exists (returns null otherwise)?
 image

Medium

Select & IN
Nested queries
Solve
Consider the following SQL table:
 image
Which of the following SQL queries would return the year when neither a football or cricket winner was chosen?
 image

Medium

Sorting Ubers
Nested queries
Join
Comparison operators
Solve
Consider the following SQL table:
 image
What will be the first two tuples resulting from the following SQL command?
 image

Hard

With, AVG & SUM
MAX() MIN()
Aggregate functions
Solve
Consider the following SQL table:
 image
How many tuples does the following query return?
 image

Easy

Registration Queue
Logic
Queues
Solve
We want to register students for the next semester. All students have a receipt which shows the amount pending for the previous semester. A positive amount (or zero) represents that the student has paid extra fees, and a negative amount represents that they have pending fees to be paid. The students are in a queue for the registration. We want to arrange the students in a way such that the students who have a positive amount on the receipt get registered first as compared to the students who have a negative amount. We are given a queue in the form of an array containing the pending amount.
For example, if the initial queue is [20, 70, -40, 30, -10], then the final queue will be [20, 70, 30, -40, -10]. Note that the sequence of students should not be changed while arranging them unless required to meet the condition.
⚠️⚠️⚠️ Note:
- The first line of the input is the length of the array. The second line contains all the elements of the array.
- The input is already parsed into an array of "strings" and passed to a function. You will need to convert string to integer/number type inside the function.
- You need to "print" the final result (not return it) to pass the test cases.

For the example discussed above, the input will be:
5
20 70 -40 30 -10

Your code needs to print the following to the standard output:
20 70 30 -40 -10

Medium

Visitors Count
Strings
Logic
Solve
A manager hires a staff member to keep a record of the number of men, women, and children visiting the museum daily. The staff will note W if any women visit, M for men, and C for children. You need to write code that takes the string that represents the visits and prints the count of men, woman and children. The sequencing should be in decreasing order. 
Example:

Input:
WWMMWWCCC

Expected Output: 
4W3C2M

Explanation: 
‘W’ has the highest count, then ‘C’, then ‘M’. 
⚠️⚠️⚠️ Note:
- The input is already parsed and passed to a function.
- You need to "print" the final result (not return it) to pass the test cases.
- If the input is- “MMW”, then the expected output is "2M1W" since there is no ‘C’.
- If any of them have the same count, the output should follow this order - M, W, C.
🧐 Question🔧 Skill

Medium

Data Filtering
Report Development
M Language
Data Visualization

2 mins

Power BI
Solve

Medium

Many-to-one error
Data Modeling

2 mins

Power BI
Solve

Medium

Power Query Functions
Power Query

2 mins

Power BI
Solve

Medium

Calculated Properties
Data Analysis

3 mins

Tableau
Solve

Medium

Change display icon

2 mins

Tableau
Solve

Easy

Pie Chart
Data Analysis
Charts

3 mins

Tableau
Solve

Medium

Applying Functions
Data frames
Functions
Math

3 mins

R
Solve

Medium

Dataframe Transform

3 mins

R
Solve

Medium

Matrix Manipulation
Matrices
Lists

3 mins

R
Solve

Medium

ZeroDivisionError and IndexError
Exceptions

2 mins

Python
Solve

Medium

Session
File Handling
Dictionary

2 mins

Python
Solve

Medium

Max Code
Arrays

2 mins

Python
Solve

Medium

Recursive Function
Recursion
Dictionary
Lists

3 mins

Python
Solve

Medium

Stacking problem
Stack
Linkedlist

4 mins

Python
Solve

Medium

Multi Select
JOIN
GROUP BY

2 mins

SQL
Solve

Medium

nth highest sales
Nested queries
User Defined Functions

3 mins

SQL
Solve

Medium

Select & IN
Nested queries

3 mins

SQL
Solve

Medium

Sorting Ubers
Nested queries
Join
Comparison operators

3 mins

SQL
Solve

Hard

With, AVG & SUM
MAX() MIN()
Aggregate functions

2 mins

SQL
Solve

Easy

Registration Queue
Logic
Queues

30 mins

Coding
Solve

Medium

Visitors Count
Strings
Logic

30 mins

Coding
Solve
🧐 Question🔧 Skill💪 Difficulty⌛ Time
Data Filtering
Report Development
M Language
Data Visualization
Power BI
Medium2 mins
Solve
Many-to-one error
Data Modeling
Power BI
Medium2 mins
Solve
Power Query Functions
Power Query
Power BI
Medium2 mins
Solve
Calculated Properties
Data Analysis
Tableau
Medium3 mins
Solve
Change display icon
Tableau
Medium2 mins
Solve
Pie Chart
Data Analysis
Charts
Tableau
Easy3 mins
Solve
Applying Functions
Data frames
Functions
Math
R
Medium3 mins
Solve
Dataframe Transform
R
Medium3 mins
Solve
Matrix Manipulation
Matrices
Lists
R
Medium3 mins
Solve
ZeroDivisionError and IndexError
Exceptions
Python
Medium2 mins
Solve
Session
File Handling
Dictionary
Python
Medium2 mins
Solve
Max Code
Arrays
Python
Medium2 mins
Solve
Recursive Function
Recursion
Dictionary
Lists
Python
Medium3 mins
Solve
Stacking problem
Stack
Linkedlist
Python
Medium4 mins
Solve
Multi Select
JOIN
GROUP BY
SQL
Medium2 mins
Solve
nth highest sales
Nested queries
User Defined Functions
SQL
Medium3 mins
Solve
Select & IN
Nested queries
SQL
Medium3 mins
Solve
Sorting Ubers
Nested queries
Join
Comparison operators
SQL
Medium3 mins
Solve
With, AVG & SUM
MAX() MIN()
Aggregate functions
SQL
Hard2 mins
Solve
Registration Queue
Logic
Queues
Coding
Easy30 minsSolve
Visitors Count
Strings
Logic
Coding
Medium30 minsSolve
Reason #4

1200+ customers in 75 countries

customers in 75 countries
Brandon

Con Adaface, pudimos optimizar nuestro proceso de selección inicial en más de un 75 %, liberando un tiempo precioso tanto para los gerentes de contratación como para nuestro equipo de adquisición de talentos.


Brandon Lee, jefe de personas, Love, Bonito

Reason #5

Designed for elimination, not selection

The most important thing while implementing the pre-employment Prueba de desarrollador de BI in your hiring process is that it is an elimination tool, not a selection tool. In other words: you want to use the test to eliminate the candidates who do poorly on the test, not to select the candidates who come out at the top. While they are super valuable, pre-employment tests do not paint the entire picture of a candidate’s abilities, knowledge, and motivations. Multiple easy questions are more predictive of a candidate's ability than fewer hard questions. Harder questions are often "trick" based questions, which do not provide any meaningful signal about the candidate's skillset.

Science behind Adaface tests
Reason #6

1 click candidate invites

Email invites: You can send candidates an email invite to the Prueba de desarrollador de BI from your dashboard by entering their email address.

Public link: You can create a public link for each test that you can share with candidates.

API or integrations: You can invite candidates directly from your ATS by using our pre-built integrations with popular ATS systems or building a custom integration with your in-house ATS.

invite candidates
Reason #7

Detailed scorecards & benchmarks

Ver cuadro de mando de muestra
Reason #8

High completion rate

Adaface tests are conversational, low-stress, and take just 25-40 mins to complete.

This is why Adaface has the highest test-completion rate (86%), which is more than 2x better than traditional assessments.

test completion rate
Reason #9

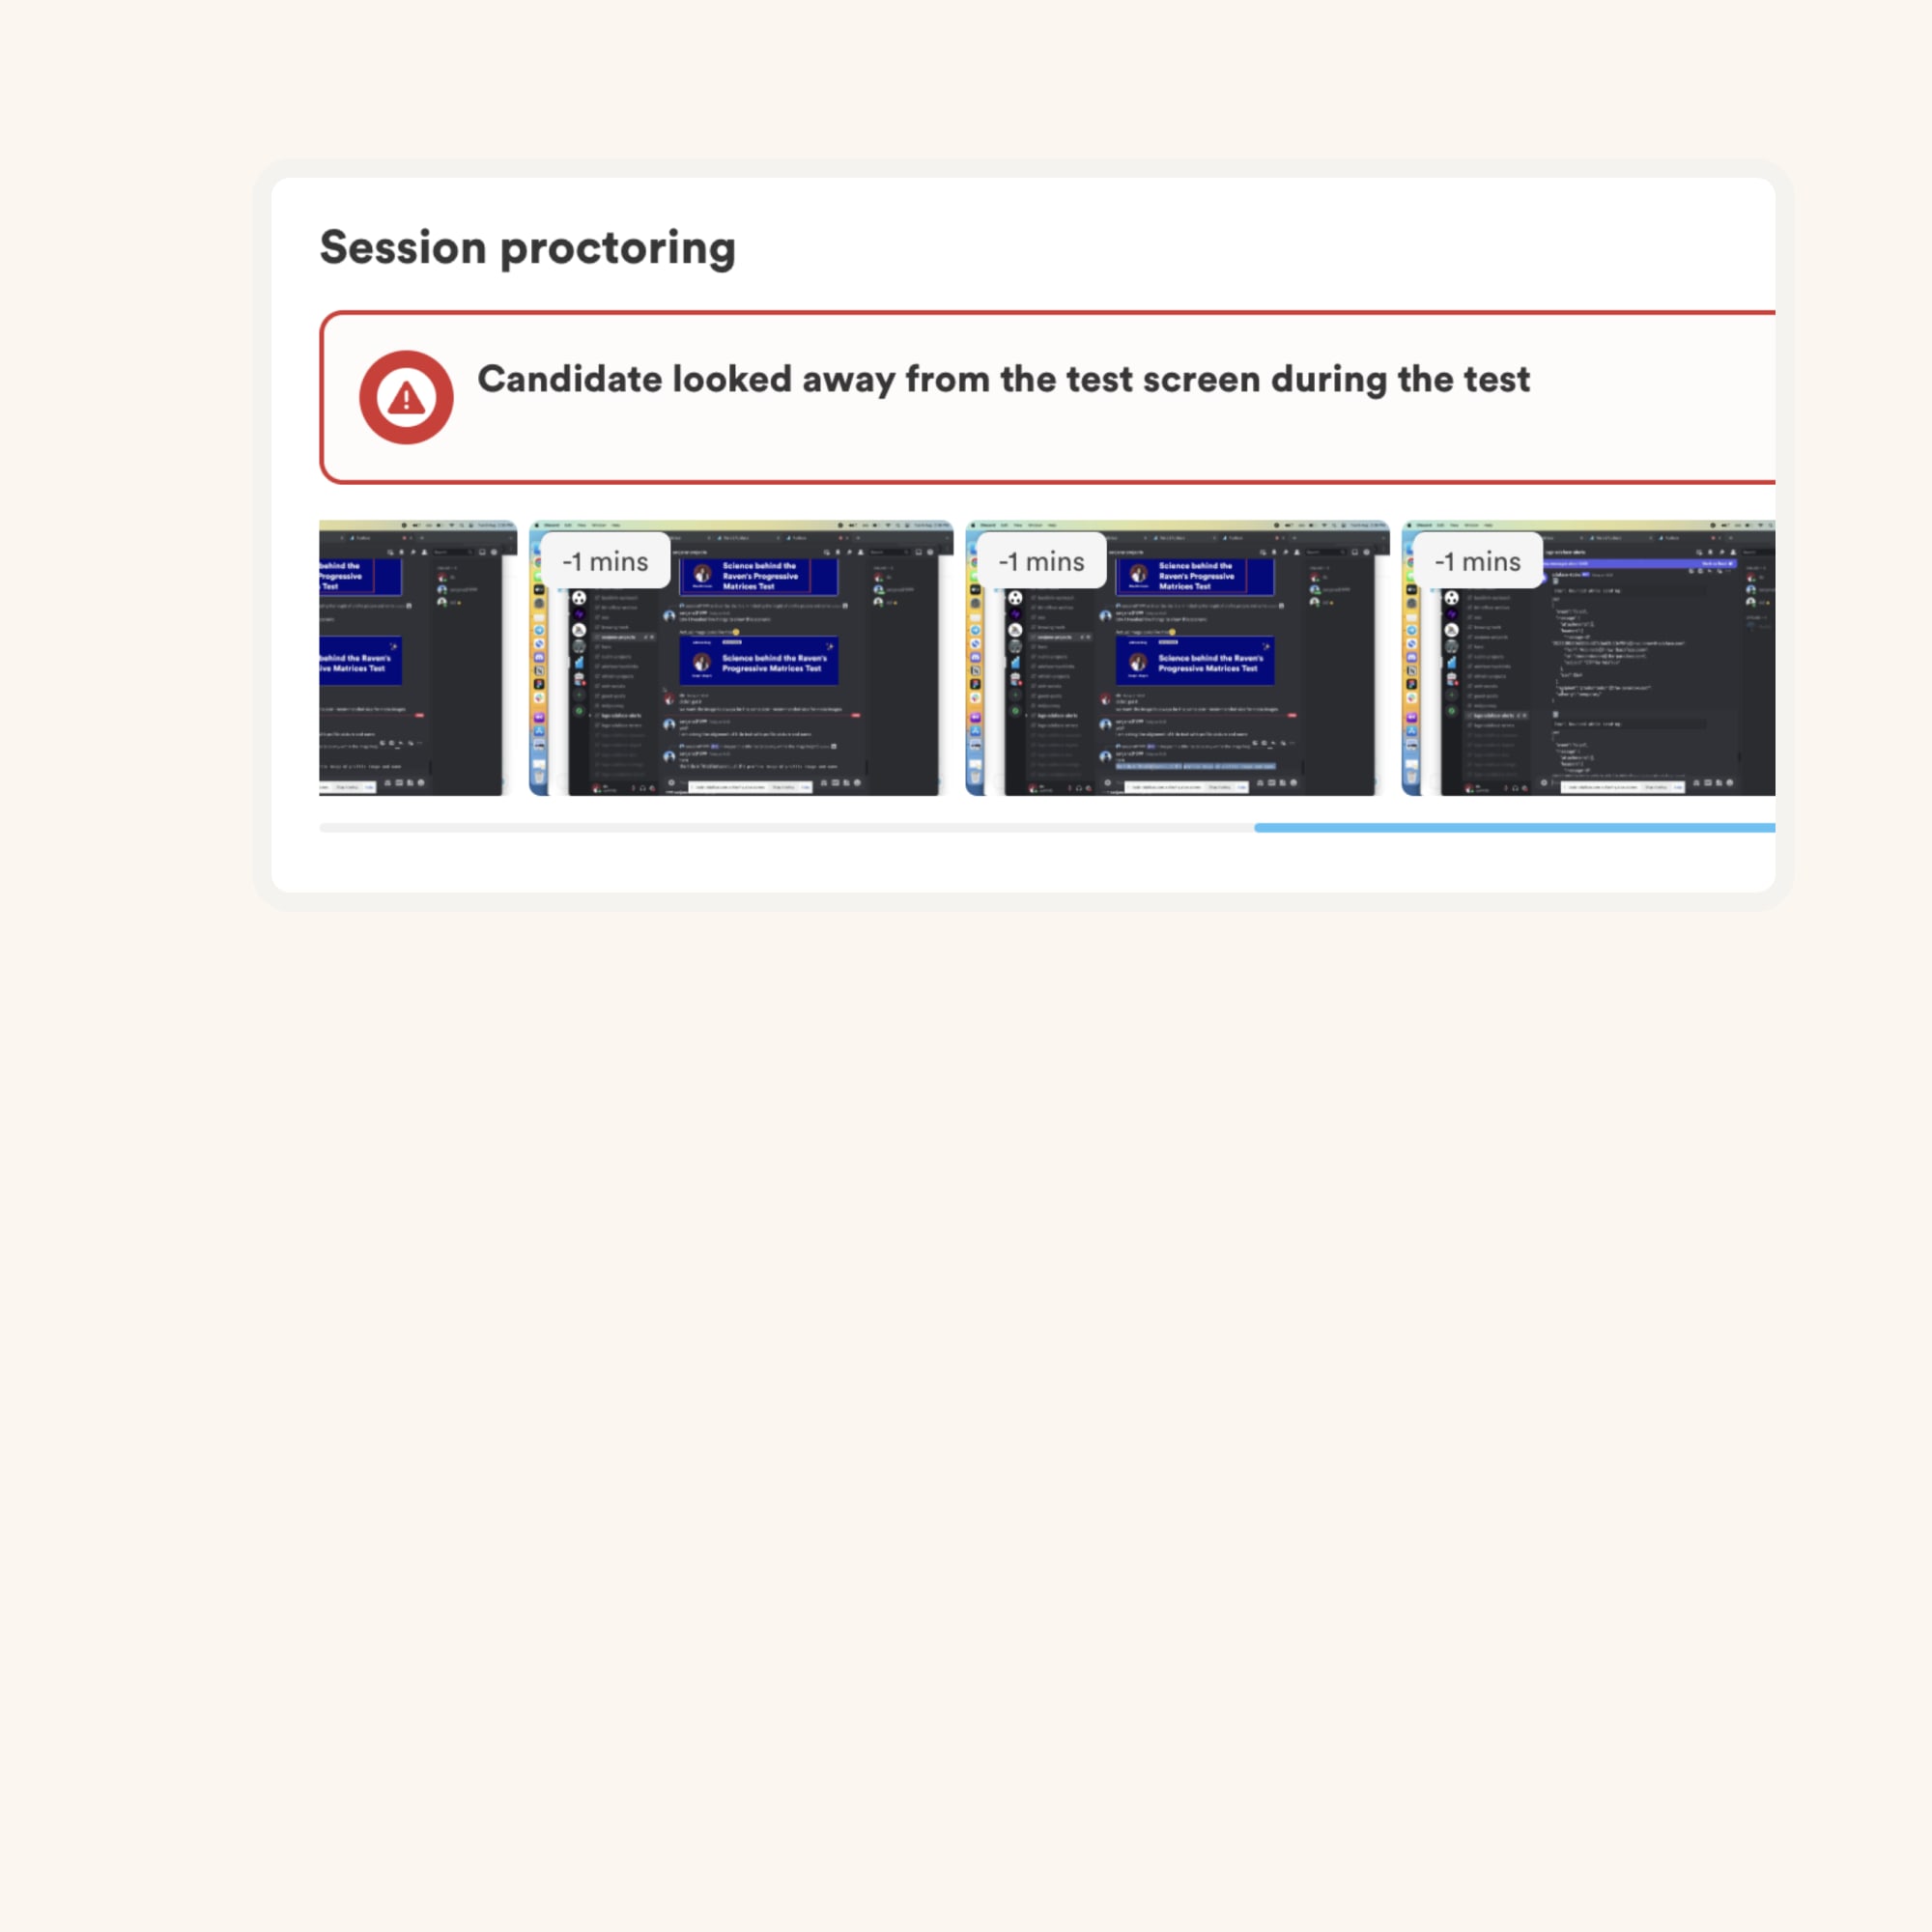
Advanced Proctoring


Learn more

About the Prueba de desarrollador de BI

Why you should use Prueba de desarrollador de BI?

The Prueba de desarrollador de BI makes use of scenario-based questions to test for on-the-job skills as opposed to theoretical knowledge, ensuring that candidates who do well on this screening test have the relavant skills. The questions are designed to covered following on-the-job aspects:

  • Conectarse a fuentes de datos en Power BI
  • Data disputas y transformaciones en Power BI
  • Fórmulas Dax
  • Conectarse con datos de múltiples fuentes
  • Creación de paneles y acciones en Tableau
  • Gestión de hojas de trabajo y libros de trabajo de Tableau
  • Filtrar y analizar datos de Tableau
  • Vectores y marcos de datos en R
  • Manipulación de cadenas en r
  • Análisis con R

Once the test is sent to a candidate, the candidate receives a link in email to take the test. For each candidate, you will receive a detailed report with skills breakdown and benchmarks to shortlist the top candidates from your pool.

What topics are covered in the Prueba de desarrollador de BI?

  • Datos y transformaciones en Power BI

    con esta habilidad , los candidatos pueden limpiar y transformar datos sin procesar para que sean adecuados para un análisis adicional en Power BI. Pueden realizar tareas como eliminar columnas innecesarias, fusionar datos y crear columnas calculadas. Esta habilidad es crucial para garantizar la precisión y calidad de los datos utilizados en los informes y visualizaciones de Power BI.

  • Fórmulas Dax

    Dax (expresiones de análisis de datos) es un lenguaje de fórmula utilizado en potencia BI para crear cálculos y agregaciones personalizadas. Esta habilidad mide la competencia de un candidato al escribir fórmulas DAX para realizar cálculos sobre datos, crear nuevas medidas y crear cálculos complejos. Es esencial evaluar esta habilidad en la prueba para evaluar la capacidad del candidato para manipular y analizar los datos de manera efectiva en Power BI.

  • Conectarse con datos de múltiples fuentes

    Esta habilidad evalúa un candidato a un candidato Capacidad para conectar e integrar datos de múltiples fuentes en una herramienta de visualización, como Tableau. Mide la capacidad del candidato para combinar y fusionar datos de diferentes bases de datos o formatos de archivo y analizarlos colectivamente. Esta habilidad es importante para garantizar que el candidato pueda trabajar con escenarios de datos complejos y crear paneles e informes completos en Tableau.

  • Creación de paneles y acciones en Tableau

    Esta habilidad evalúa la competencia de un candidato en Uso de Tableau para diseñar paneles interactivos que permitan a los usuarios explorar los datos visualmente y realizar acciones como filtrar, clasificar y perforar. Evalúa la capacidad del candidato para presentar los datos de una manera convincente y fácil de usar, proporcionando visualizaciones perspicaces e interacciones significativas.

  • Administración de hojas de trabajo y libros de trabajo de Tableau

    , los candidatos pueden efectivamente pueden Organizar y administrar visualizaciones en hojas de trabajo y libros de trabajo de Tableau. Mide la capacidad del candidato para organizar y formatear visualizaciones, crear jerarquías y administrar conexiones de datos. Esta habilidad es importante, ya que garantiza que el candidato pueda navegar y mantener eficientemente proyectos de Tableau, mejorando la productividad y la colaboración.

  • Filtrado y análisis de datos de Tableau

    Esta habilidad evalúa la capacidad de un candidato para filtrar y filtrar y Analice los datos en Tableau utilizando diversas técnicas, como aplicar filtros, crear campos calculados y realizar agregaciones. Evalúa la capacidad del candidato para obtener ideas significativas de los datos y presentarlos a través de visualizaciones. Esta habilidad es importante para medir las habilidades analíticas del candidato y su comprensión de la exploración de datos en Tableau.

  • vectores y marcos de datos en r

    Esta habilidad implica trabajar con vectores y marcos de datos en R, que son estructuras de datos fundamentales utilizadas para almacenar y manipular datos. Los vectores son matrices unidimensionales, mientras que los marcos de datos son estructuras multidimensionales que pueden contener diferentes tipos de datos. Esta habilidad es esencial en la prueba, ya que mide la capacidad de un candidato para realizar operaciones y análisis de datos utilizando estas estructuras de datos clave en R Capacidad para manipular cadenas en R, como extraer sustros, reemplazar caracteres o dividir cadenas. La manipulación de la cadena es importante para la limpieza de datos, el procesamiento de texto y las tareas de ingeniería de características en R. Esta habilidad se evalúa en la prueba para medir el dominio del candidato en el manejo y manipulación de los datos textuales utilizando funciones y técnicas apropiadas.

  • Análisis con R

    Esta habilidad mide la capacidad de un candidato para aplicar técnicas estadísticas y analíticas utilizando R. evalúa el conocimiento del candidato de varios paquetes y funciones R para el análisis de datos, la regresión, la agrupación y la visualización. El análisis con R es una habilidad significativa para tener en un desarrollador de BI, ya que les permite obtener información, construir modelos y tomar decisiones basadas en datos utilizando R Esta habilidad evalúa la comprensión de un candidato de la sintaxis y la estructura del lenguaje de programación de Python. Evalúa su conocimiento de variables, tipos de datos, declaraciones de flujo de control, bucles, funciones y otros conceptos básicos de Python. La sintaxis de Python es una habilidad fundamental para medir en la prueba, ya que forma los bloques de construcción de la redacción del código de Python para tareas de manipulación, análisis y visualización de datos. La competencia de un candidato en la programación orientada a objetos (OOP) usando Python. Evalúa su conocimiento y capacidad para definir y usar clases, objetos, herencia, polimorfismo y encapsulación. Python OOPS es una habilidad importante para medir en la prueba, ya que demuestra la comprensión del candidato de los principios de OOP y su capacidad para escribir código modular y reutilizable en Python.

  • SQL CRUD OPERACIONES </H4> <P > Esta habilidad mide la competencia de un candidato en la realización de operaciones de crud (crear, leer, actualizar, eliminar) en SQL, que son operaciones fundamentales de la base de datos. Evalúa su capacidad para insertar, recuperar, actualizar y eliminar datos de bases de datos relacionales utilizando consultas SQL. Las operaciones SQL CRUD es una habilidad esencial para evaluar en la prueba, ya que demuestra la capacidad del candidato para interactuar con bases de datos y manipular datos utilizando SQL. </p> <h4> SQL se une e índices

    Esta habilidad evalúa una El conocimiento del candidato y la comprensión de SQL se utilizan, que se utilizan para combinar datos de múltiples tablas basadas en columnas comunes. También evalúa su dominio de trabajar con índices, que mejoran el rendimiento de las consultas SQL. SQL se unen e índices son habilidades importantes para medir en la prueba, ya que demuestran la capacidad del candidato para recuperar y manipular datos de estructuras de bases de datos relacionales complejas.

  • Python Programming

    Esta habilidad evalúa a un candidato a un candidato Competencia en la programación con Python, que cubre temas como la manipulación de datos, el análisis, la visualización y la automatización. Mide su capacidad para escribir código Python para resolver problemas comerciales, manejar tareas de procesamiento de datos y crear aplicaciones. La programación de Python es una habilidad crucial para evaluar en la prueba, ya que muestra la capacidad del candidato para aprovechar la versatilidad y el poder de Python en varios aspectos del desarrollo de BI.

  • Full list of covered topics

    The actual topics of the questions in the final test will depend on your job description and requirements. However, here's a list of topics you can expect the questions for Prueba de desarrollador de BI to be based on.

    Power Bi
    Fuentes de datos
    Disputas de datos
    Fórmulas Dax
    Conectarse a múltiples fuentes
    Paneles interactivos
    Hojas de trabajo de Tableau
    Tableau Workbooks
    Filtrado de datos
    Análisis de datos
    Vectores
    Marcos de datos
    Manipulación de cuerdas
    Analítica
    Sintaxis de pitón
    Python oops
    Operaciones SQL CRUD
    SQL se une
    Índices SQL
    Programación de Python

What roles can I use the Prueba de desarrollador de BI for?

  • Desarrollador de bi
  • Analista de datos
  • Ingeniero de datos
  • Analista de negocios
  • Administrador de base de datos
  • Gerente de almacén de datos
  • Desarrollador de ETL

How is the Prueba de desarrollador de BI customized for senior candidates?

For intermediate/ experienced candidates, we customize the assessment questions to include advanced topics and increase the difficulty level of the questions. This might include adding questions on topics like

  • Sintaxis de pitón
  • Python oops
  • Operaciones SQL CRUD
  • SQL se une e índices
  • Programación de Python
  • Modelado de datos avanzado en Power BI
  • Trabajar con visualizaciones de datos complejas en Tableau
  • Análisis avanzado con R
  • Limpieza de datos y preprocesamiento en Python
  • Consultas y optimización SQL avanzadas

The coding question for experienced candidates will be of a higher difficulty level to evaluate more hands-on experience.

Singapore government logo

Los gerentes de contratación sintieron que a través de las preguntas técnicas que hicieron durante las entrevistas del panel, pudieron decir qué candidatos tenían mejores puntajes y diferenciarse de aquellos que no obtuvieron tan buenos puntajes. Ellos son altamente satisfecho con la calidad de los candidatos preseleccionados con la selección de Adaface.


85%
Reducción en el tiempo de detección

Prueba de desarrollador de BI Preguntas frecuentes

¿Puedo combinar múltiples habilidades en una evaluación personalizada?

Si, absolutamente. Las evaluaciones personalizadas se configuran en función de la descripción de su trabajo e incluirán preguntas sobre todas las habilidades imprescindibles que especifique.

¿Tiene alguna característica anti-trato o procuración en su lugar?

Tenemos las siguientes características anti-trate en su lugar:

  • Preguntas no postradas
  • Procuración de IP
  • Procedor web
  • Procedores de cámara web
  • Detección de plagio
  • navegador seguro

Lea más sobre las funciones de procuración.

¿Cómo interpreto los puntajes de las pruebas?

Lo principal a tener en cuenta es que una evaluación es una herramienta de eliminación, no una herramienta de selección. Una evaluación de habilidades está optimizada para ayudarlo a eliminar a los candidatos que no están técnicamente calificados para el rol, no está optimizado para ayudarlo a encontrar el mejor candidato para el papel. Por lo tanto, la forma ideal de usar una evaluación es decidir un puntaje umbral (generalmente del 55%, lo ayudamos a comparar) e invitar a todos los candidatos que obtienen un puntaje por encima del umbral para las próximas rondas de la entrevista.

¿Para qué nivel de experiencia puedo usar esta prueba?

Cada evaluación de AdaFace está personalizada para su descripción de trabajo/ persona candidata ideal (nuestros expertos en la materia elegirán las preguntas correctas para su evaluación de nuestra biblioteca de más de 10000 preguntas). Esta evaluación se puede personalizar para cualquier nivel de experiencia.

¿Cada candidato tiene las mismas preguntas?

Sí, te hace mucho más fácil comparar los candidatos. Las opciones para las preguntas de MCQ y el orden de las preguntas son aleatorizados. Tenemos características anti-trato/procuración en su lugar. En nuestro plan empresarial, también tenemos la opción de crear múltiples versiones de la misma evaluación con cuestiones de niveles de dificultad similares.

Soy candidato. ¿Puedo probar una prueba de práctica?

No. Desafortunadamente, no apoyamos las pruebas de práctica en este momento. Sin embargo, puede usar nuestras preguntas de muestra para la práctica.

¿Cuál es el costo de usar esta prueba?

Puede consultar nuestros planes de precios.

¿Puedo obtener una prueba gratuita?

Sí, puede registrarse gratis y previsualice esta prueba.

Me acabo de mudar a un plan pagado. ¿Cómo puedo solicitar una evaluación personalizada?

Aquí hay una guía rápida sobre cómo solicitar una evaluación personalizada en Adaface.

customers across world
Join 1200+ companies in 75+ countries.
Pruebe la herramienta de evaluación de habilidades más amigables para los candidatos hoy en día.
g2 badges
Ready to use the Adaface Prueba de desarrollador de BI?
habla con nosotros
ada
Ada
● Online
Previous
Score: NA
Next
✖️