Test Duration
60 minsDifficulty Level
Moderate
Questions
- 5 Power BI MCQs
- 5 Tableau MCQs
- 4 R MCQs
- 5 Python MCQs
- 5 SQL MCQs
- 1 Python Coding Question
Availability
Ready to useThe Business Intelligence Developer test uses scenario-based multiple-choice questions to evaluate a candidate's knowledge and skills related to data modeling and ETL processes, data warehousing and data mining, BI reporting and visualization, data analysis and predictive modeling, and BI project management. Candidates are also be evaluated on their ability to use BI tools and technologies such as SQL Server, Power BI, Tableau, and other related tools, and their proficiency in applying data analysis and business intelligence techniques to solve complex business problems.
Covered skills:
Test Duration
60 minsDifficulty Level
Moderate
Questions
Availability
Ready to useThe BI Developer Test helps recruiters and hiring managers identify qualified candidates from a pool of resumes, and helps in taking objective hiring decisions. It reduces the administrative overhead of interviewing too many candidates and saves time by filtering out unqualified candidates at the first step of the hiring process.
The test screens for the following skills that hiring managers look for in candidates:
Use Adaface tests trusted by recruitment teams globally. Adaface skill assessments measure on-the-job skills of candidates, providing employers with an accurate tool for screening potential hires.
We have a very high focus on the quality of questions that test for on-the-job skills. Every question is non-googleable and we have a very high bar for the level of subject matter experts we onboard to create these questions. We have crawlers to check if any of the questions are leaked online. If/ when a question gets leaked, we get an alert. We change the question for you & let you know.
How we design questionsThese are just a small sample from our library of 15,000+ questions. The actual questions on this BI Developer Test will be non-googleable.
| 🧐 Question | |||||
|---|---|---|---|---|---|
|
Medium
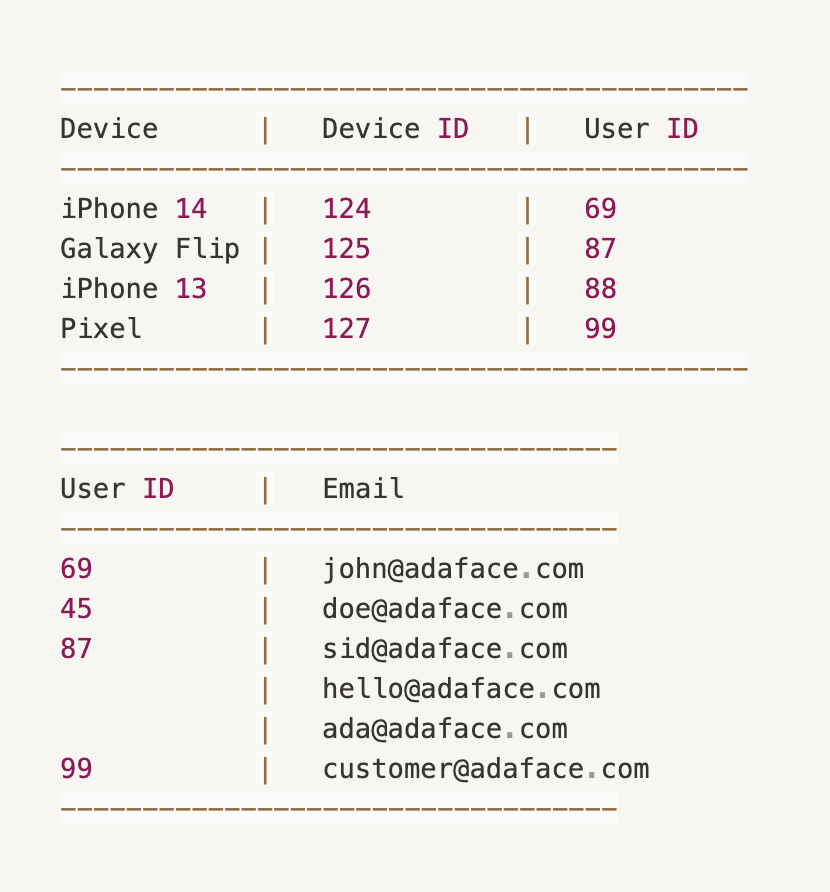
Data Filtering
|
Solve
|
||||
|
|
|||||
|
Medium
Many-to-one error
|
Solve
|
||||
|
|
|||||
|
Medium
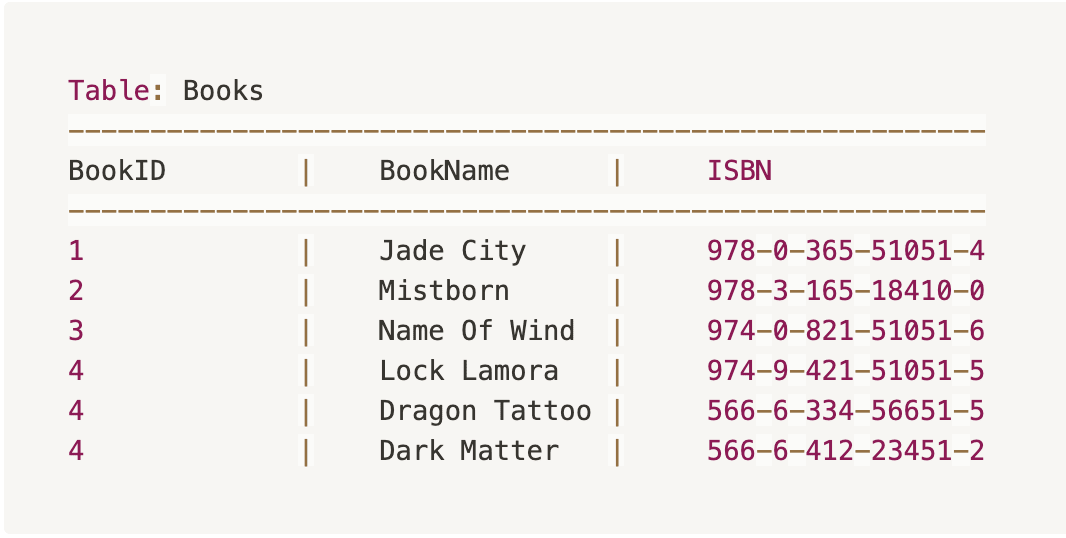
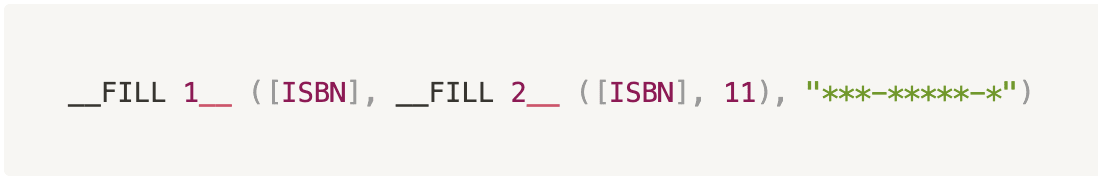
Power Query Functions
|
Solve
|
||||
|
|
|||||
|
Medium
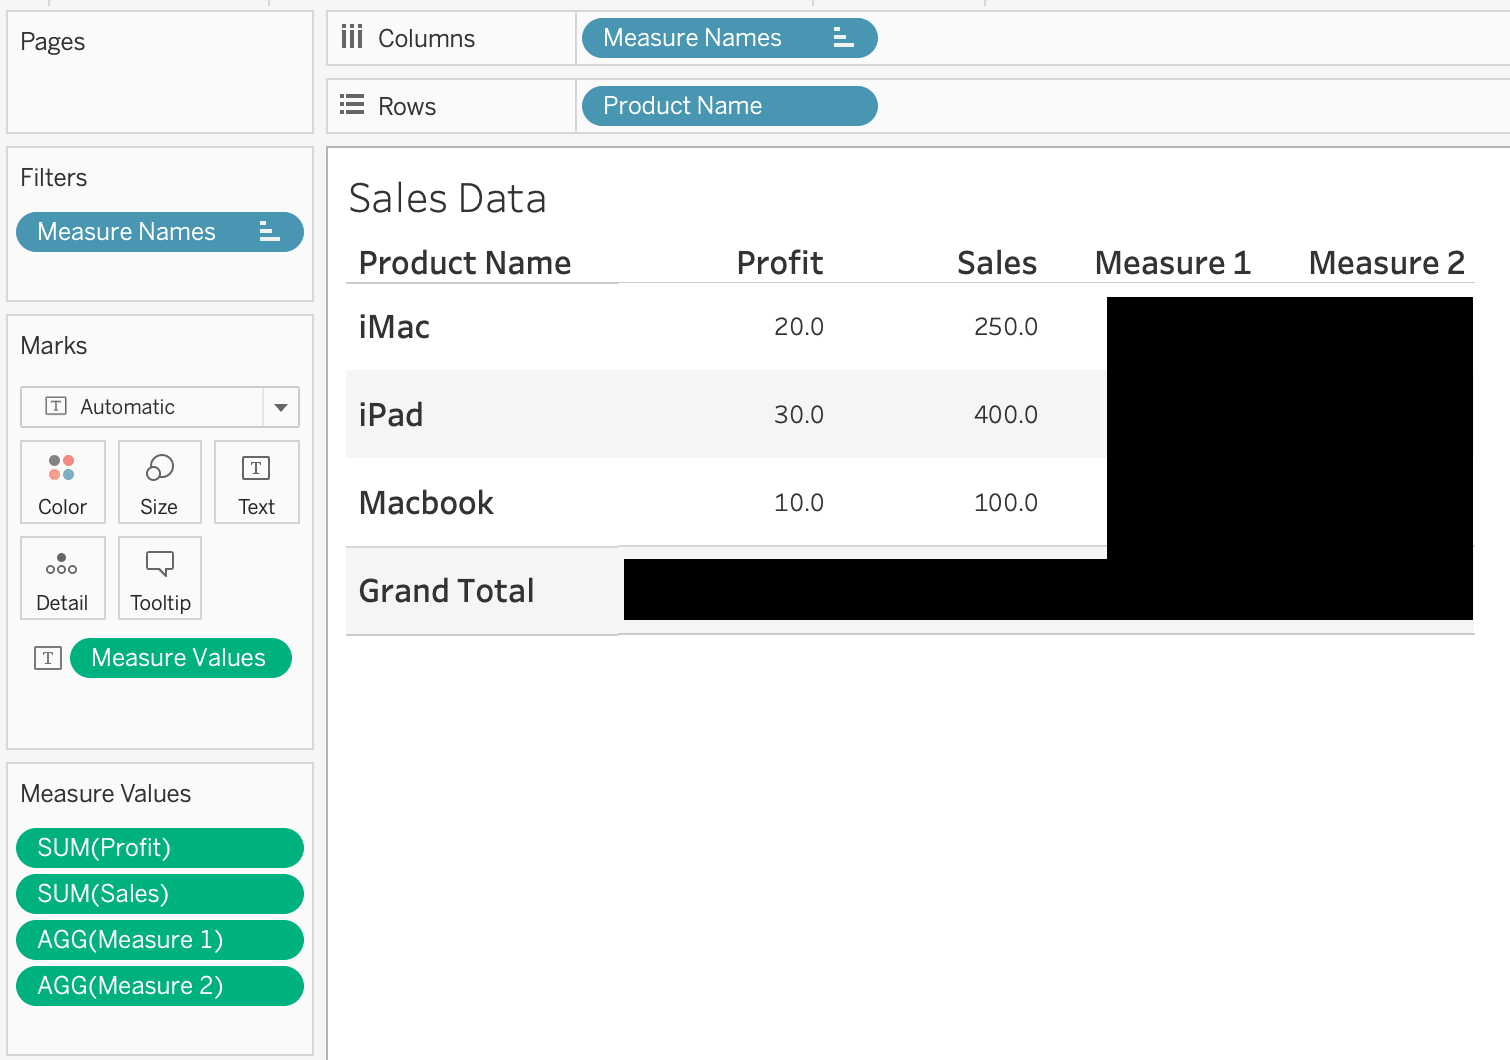
Calculated Properties
|
Solve
|
||||
|
|
|||||
|
Medium
Change display icon
|
Solve
|
||||
|
|
|||||
|
Easy
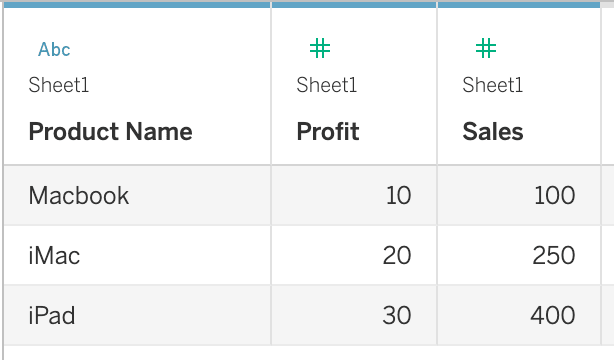
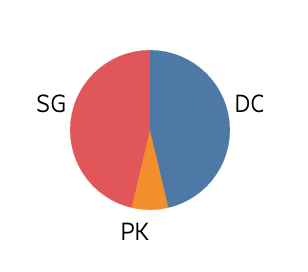
Pie Chart
|
Solve
|
||||
|
|
|||||
|
Medium
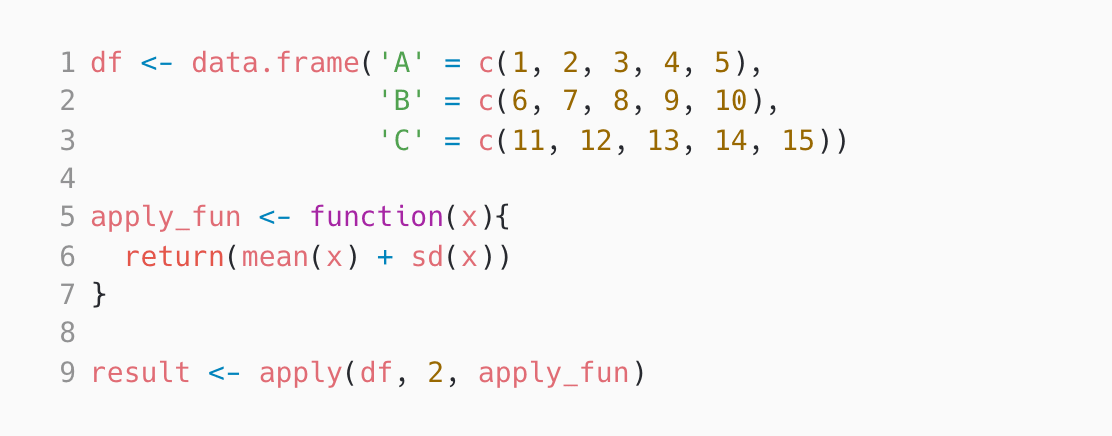
Applying Functions
|
Solve
|
||||
|
|
|||||
|
Medium
Dataframe Transform
|
Solve
|
||||
|
|
|||||
|
Medium
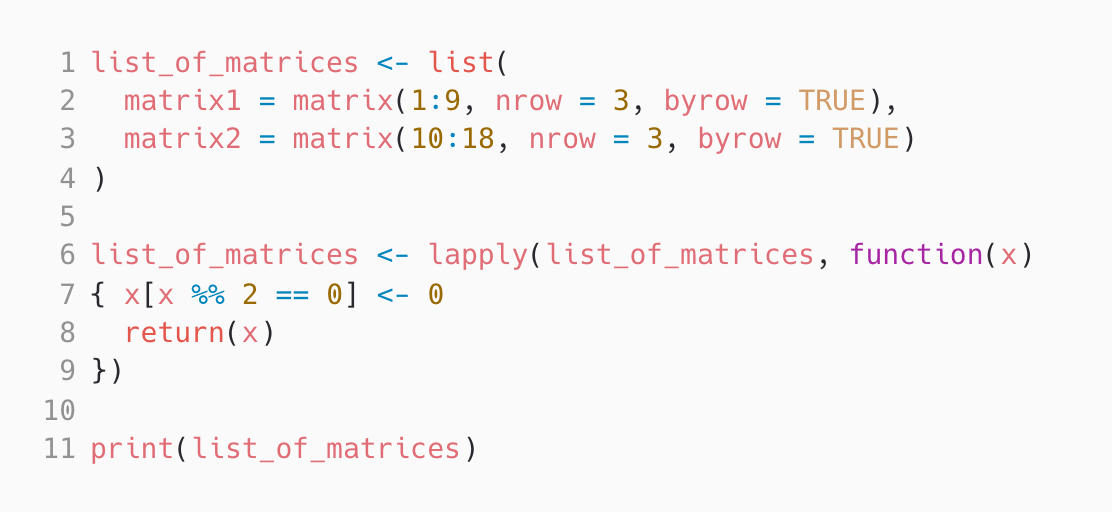
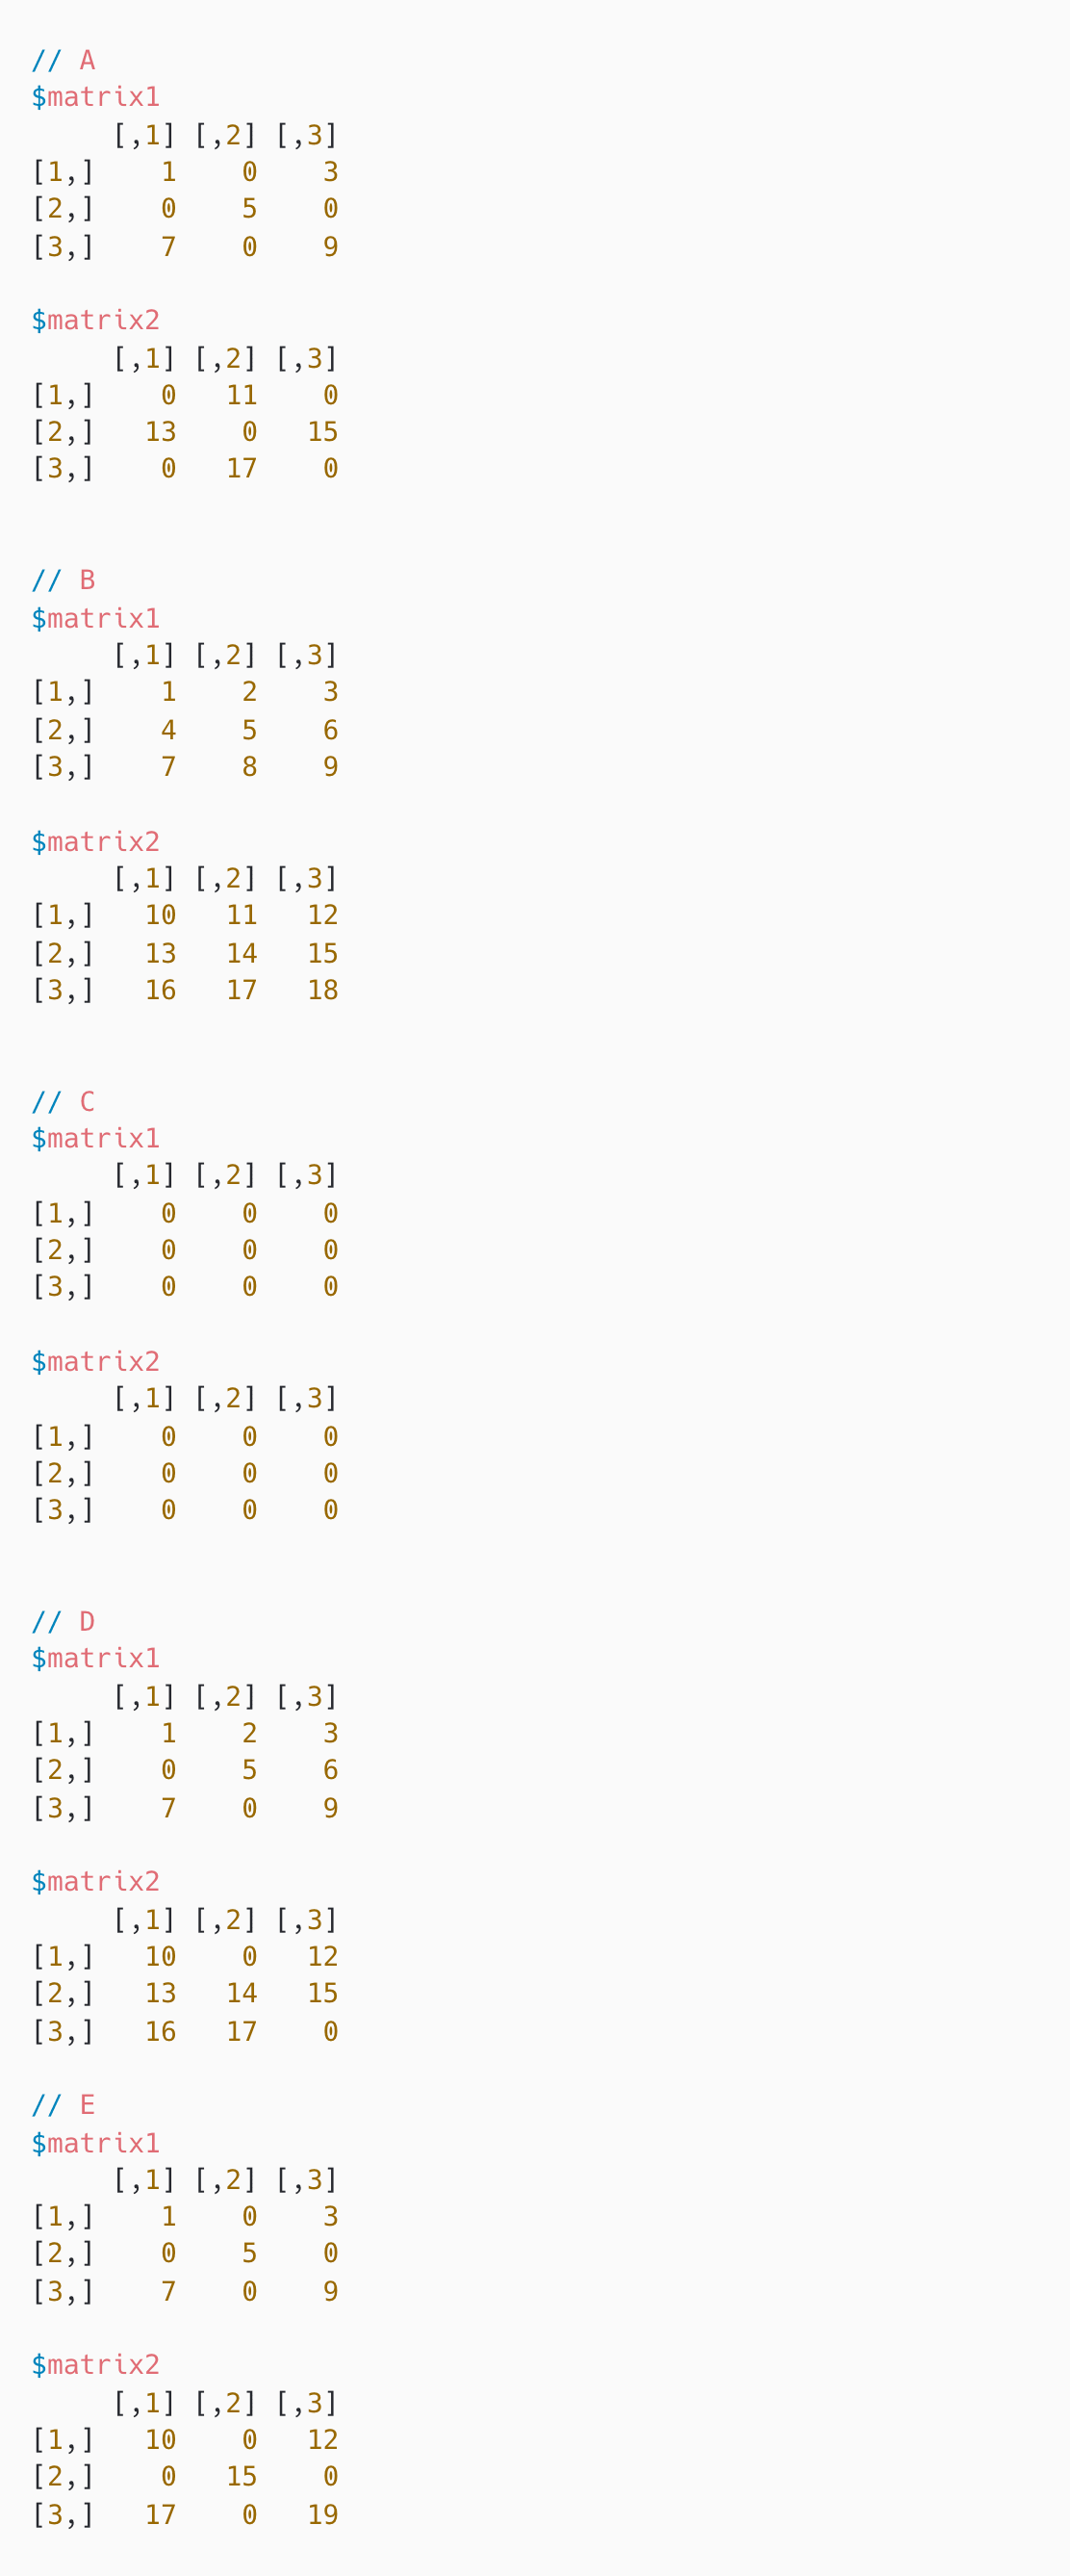
Matrix Manipulation
|
Solve
|
||||
|
|
|||||
|
Medium
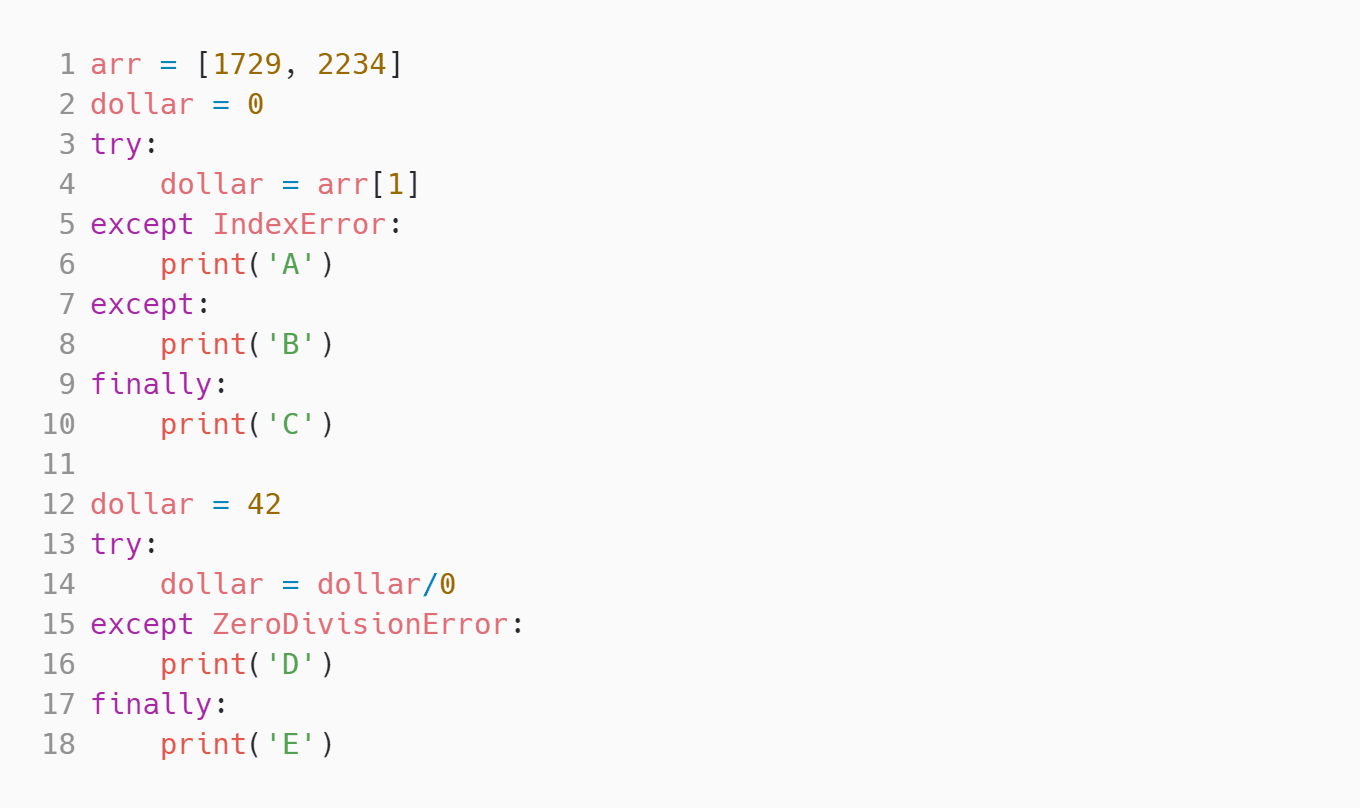
ZeroDivisionError and IndexError
|
Solve
|
||||
|
|
|||||
|
Medium
Session
|
Solve
|
||||
|
|
|||||
|
Medium
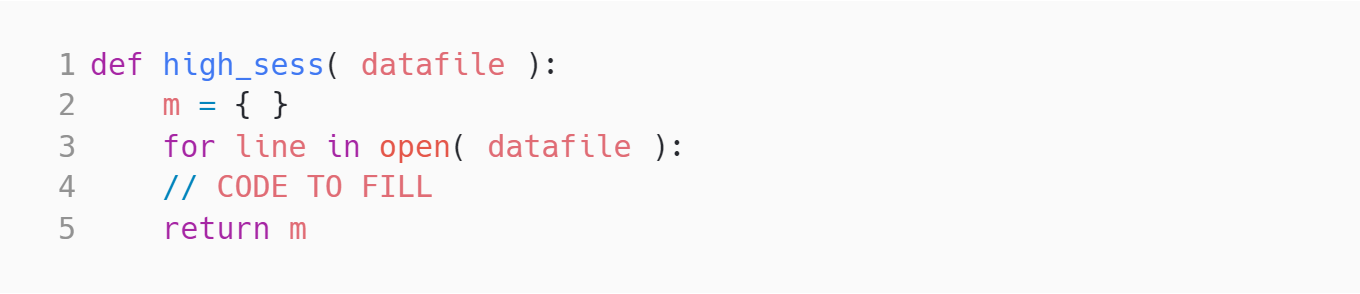
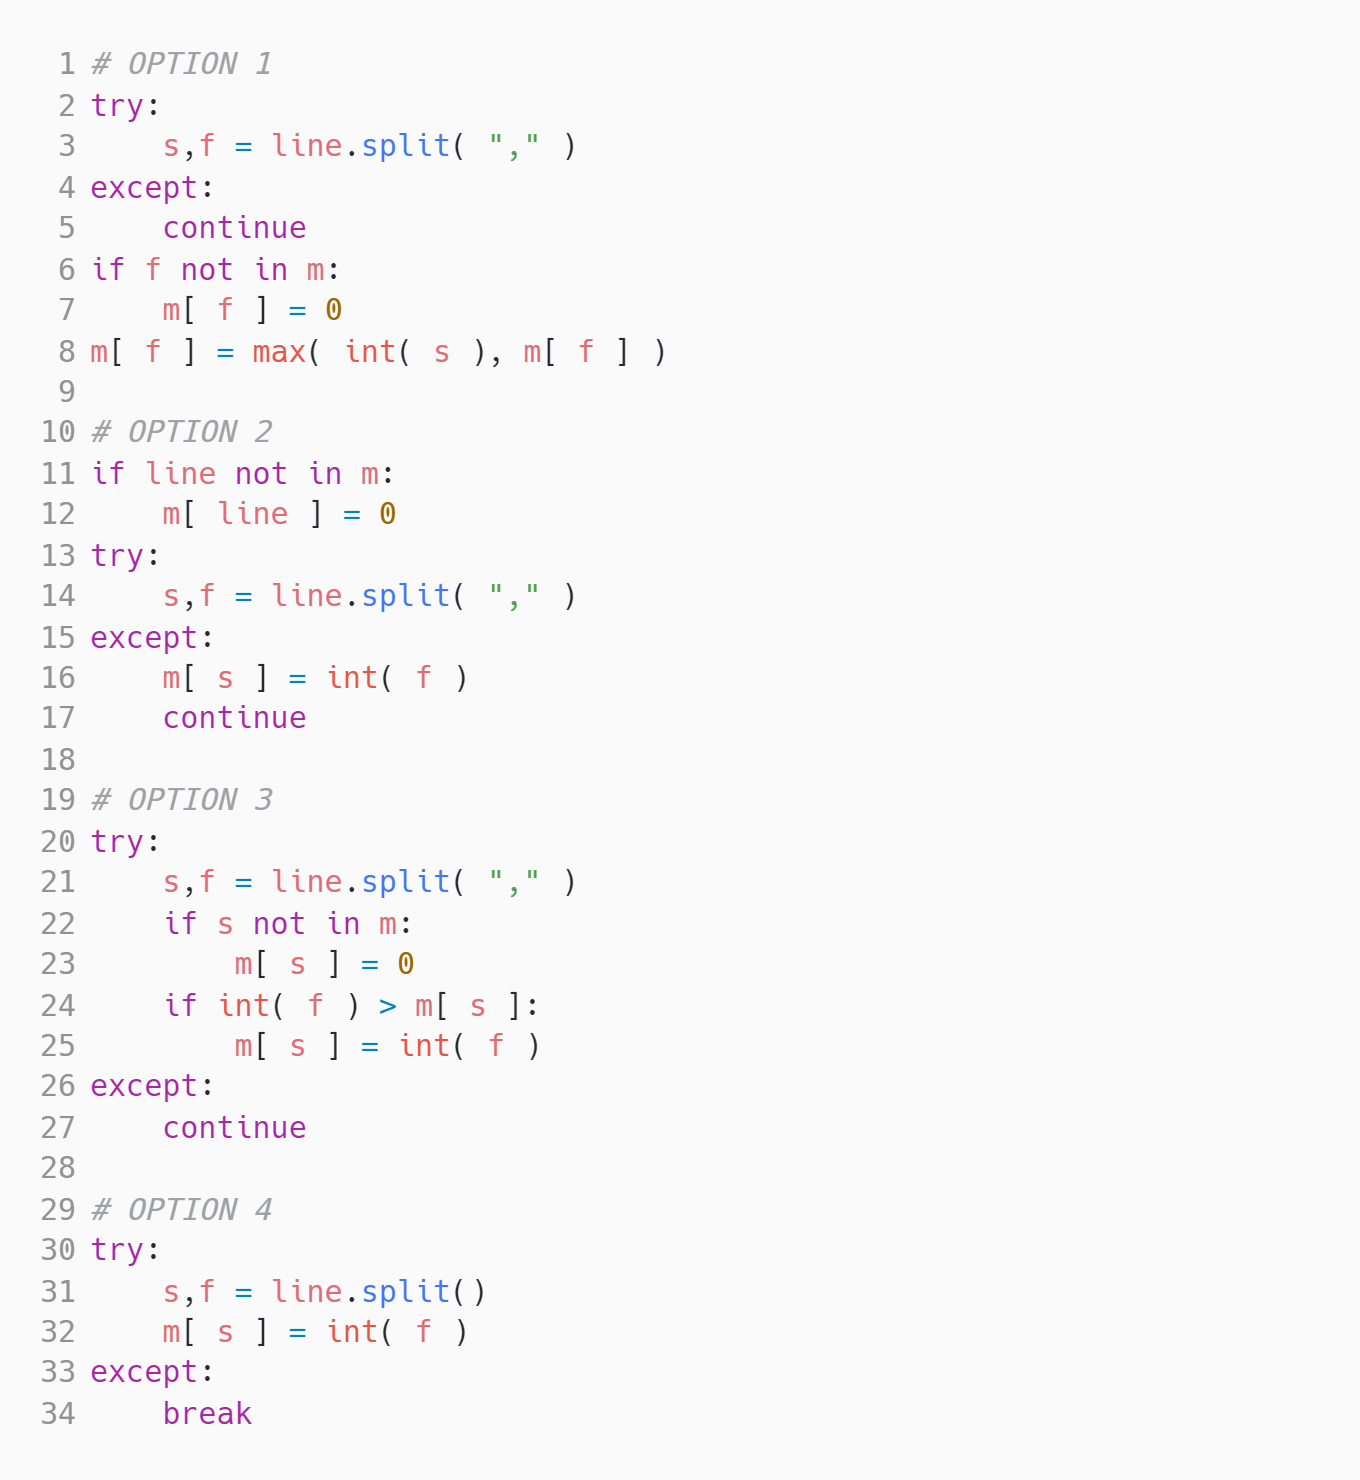
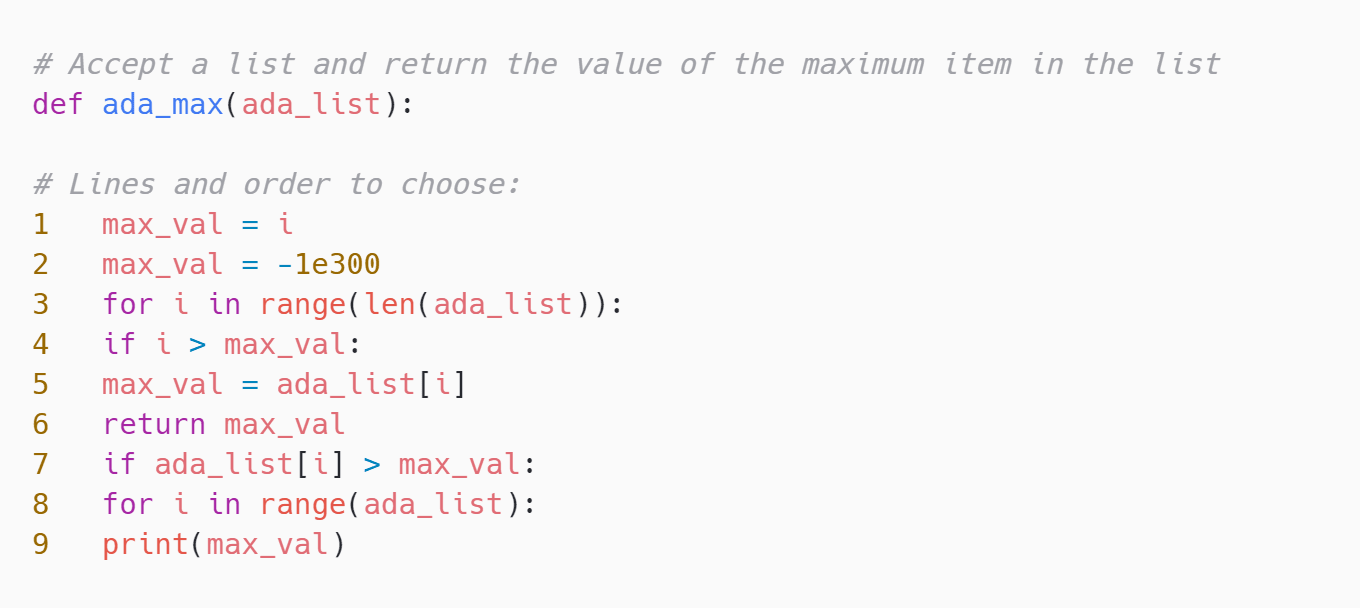
Max Code
|
Solve
|
||||
|
|
|||||
|
Medium
Recursive Function
|
Solve
|
||||
|
|
|||||
|
Medium
Stacking problem
|
Solve
|
||||
|
|
|||||
|
Medium
Multi Select
|
Solve
|
||||
|
|
|||||
|
Medium
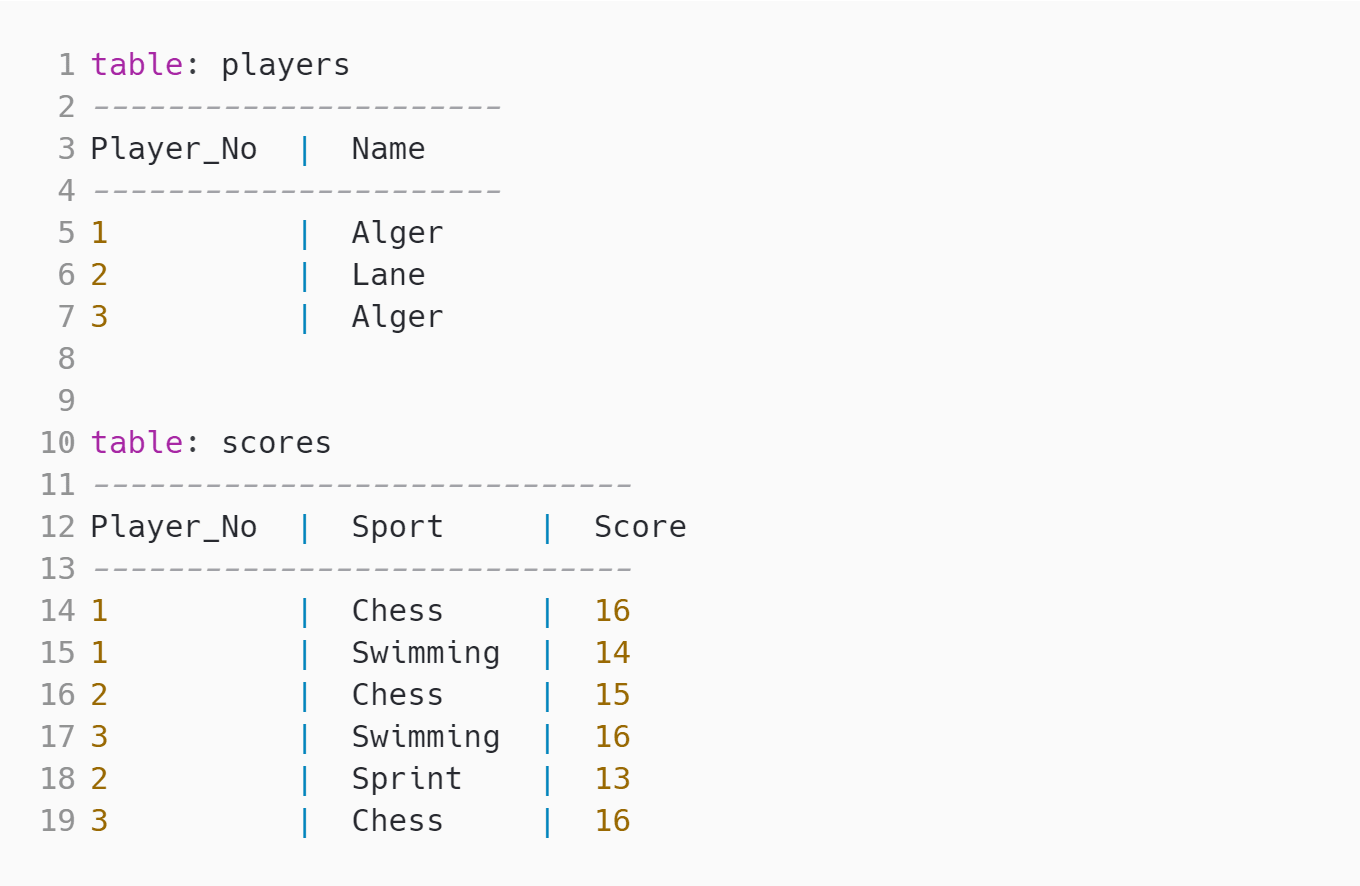
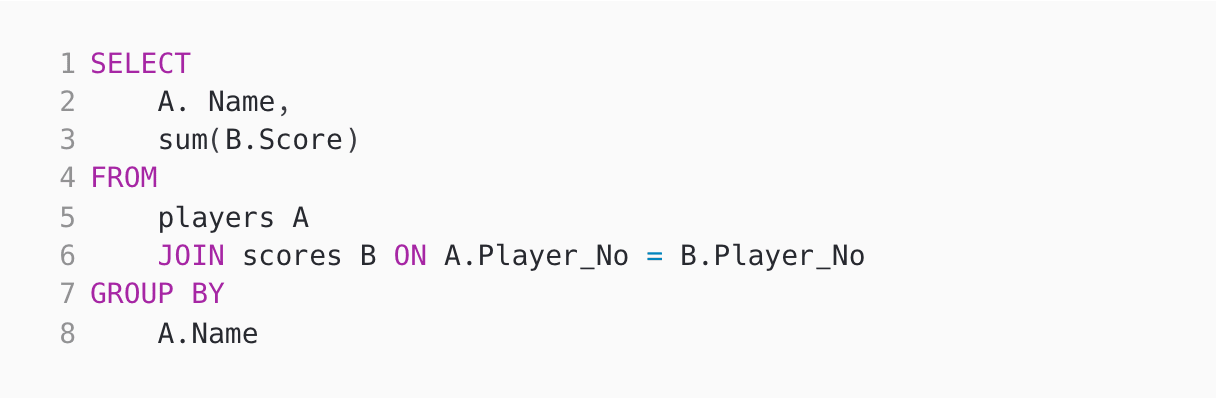
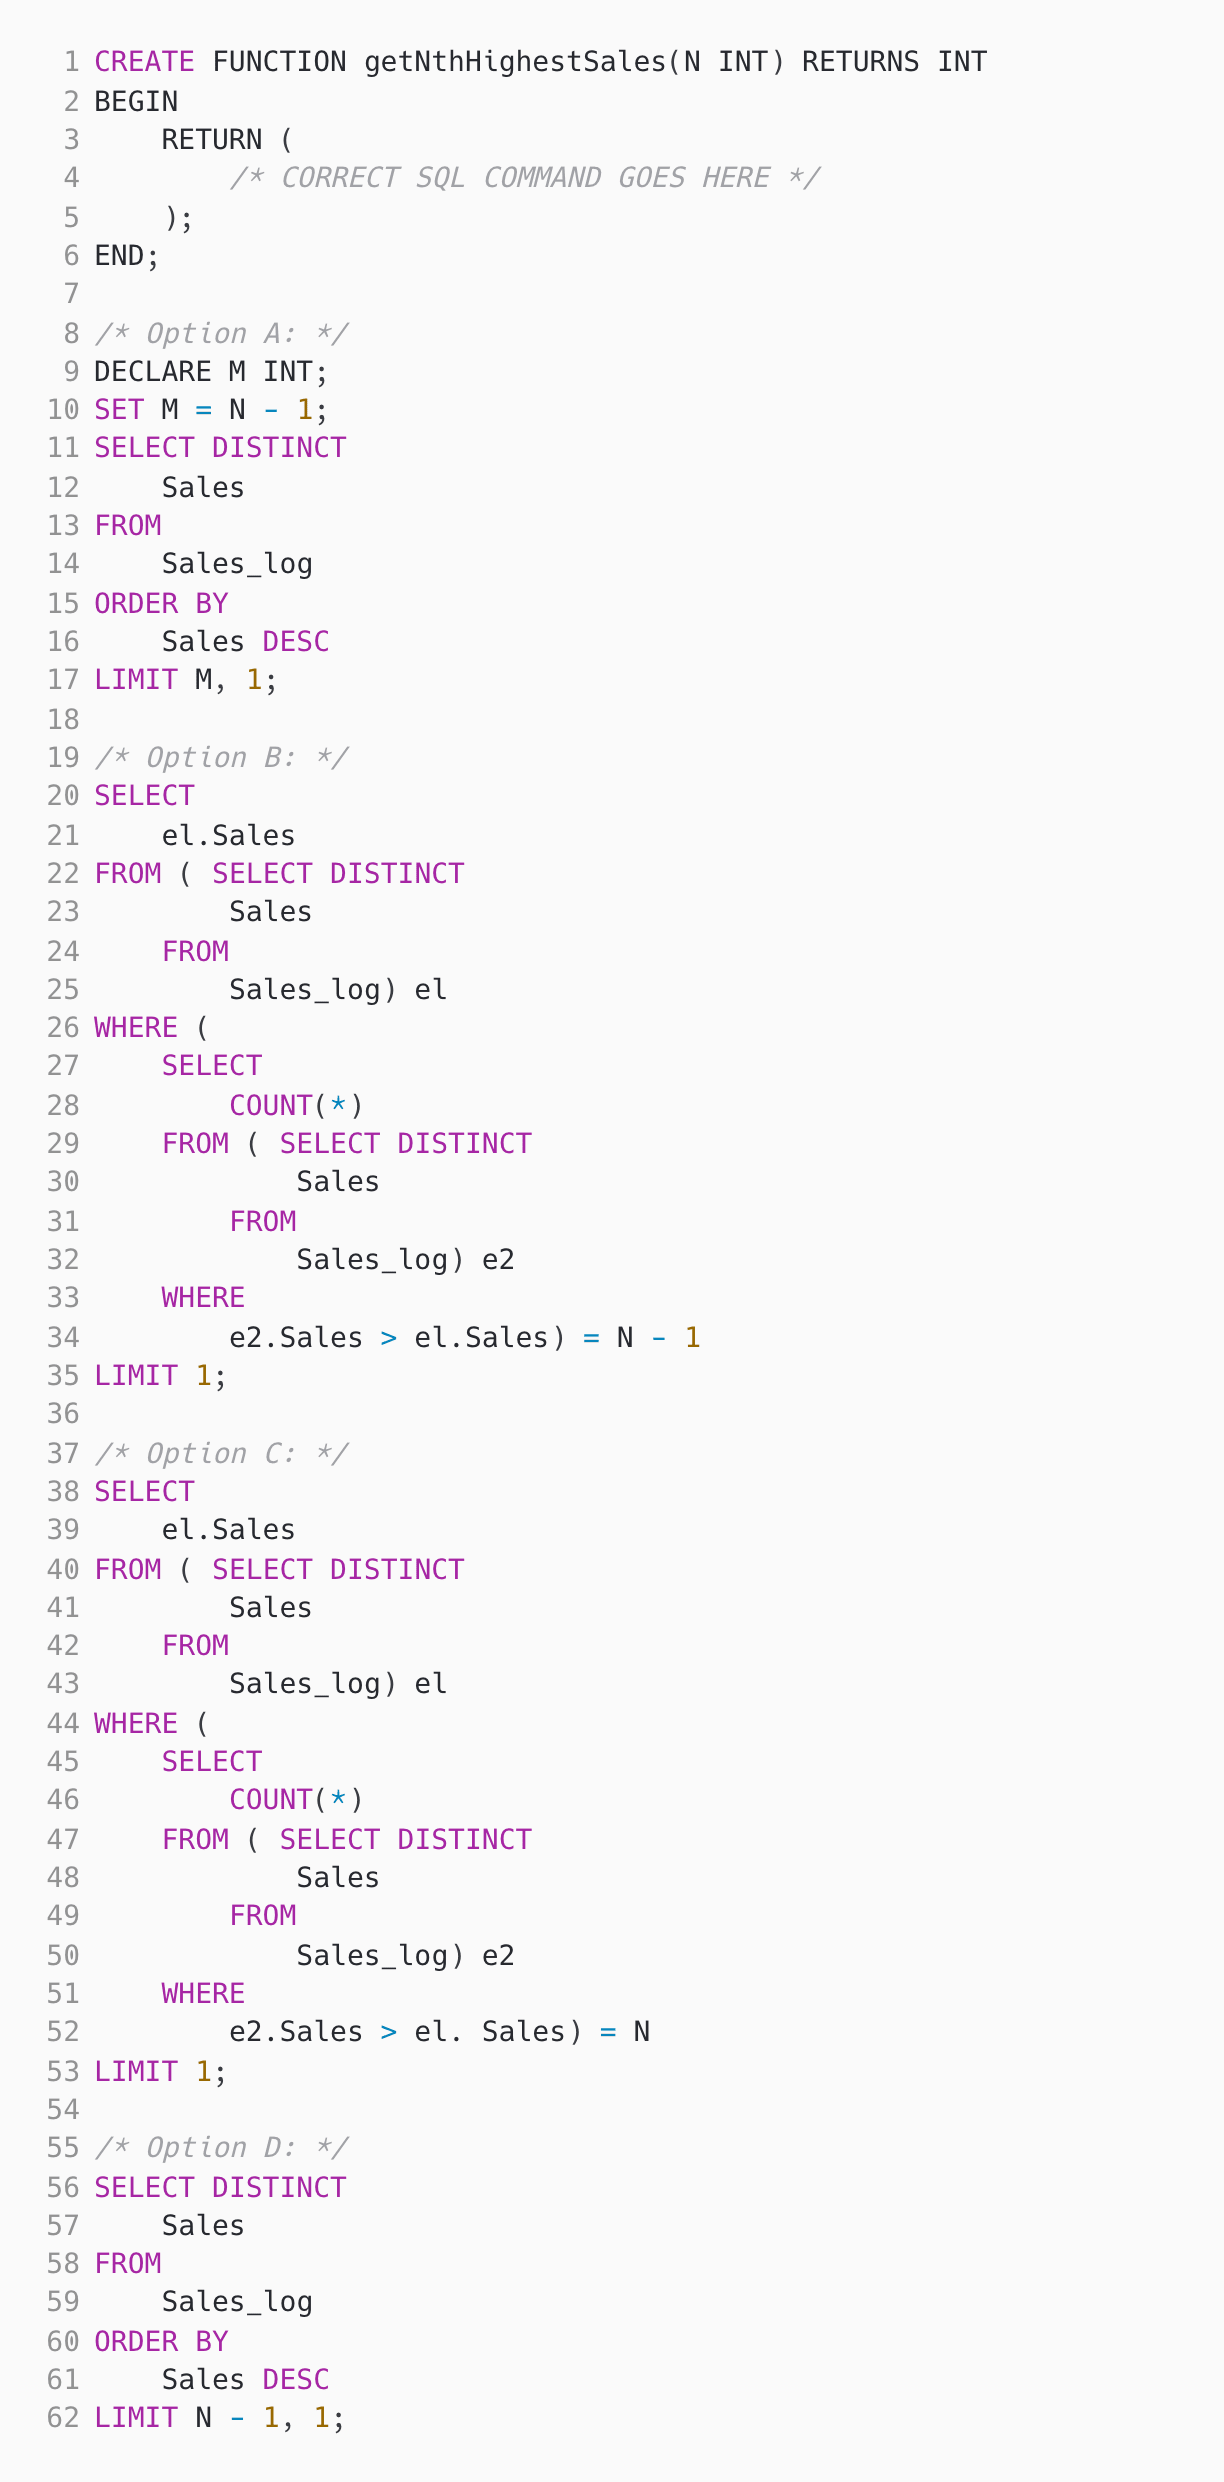
nth highest sales
|
Solve
|
||||
|
|
|||||
|
Medium
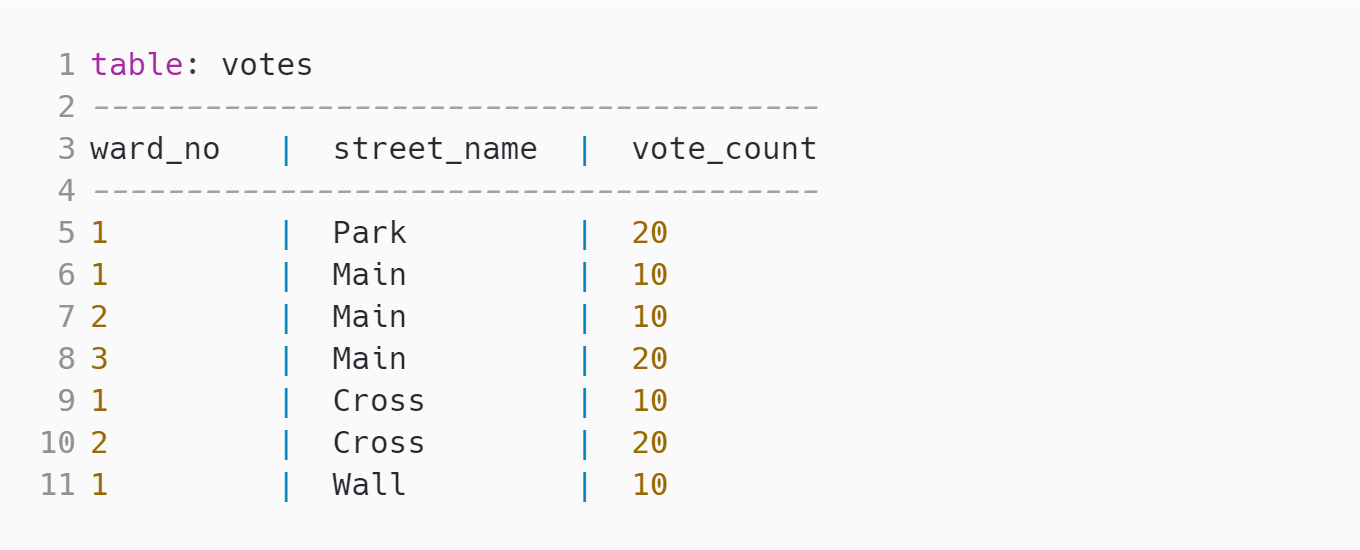
Select & IN
|
Solve
|
||||
|
|
|||||
|
Medium
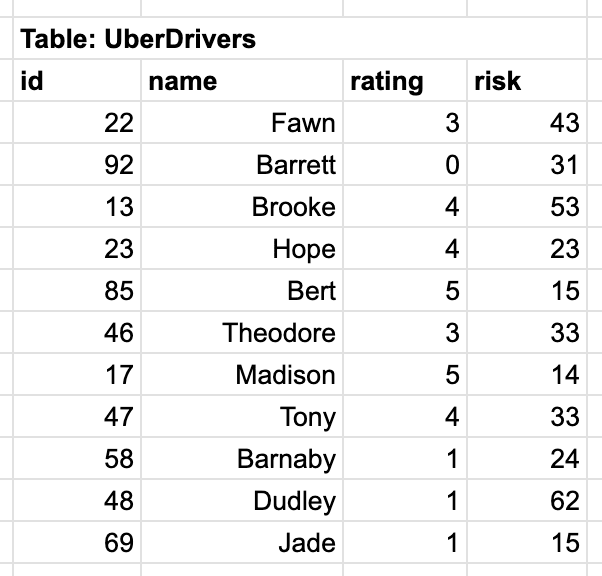
Sorting Ubers
|
Solve
|
||||
|
|
|||||
|
Hard
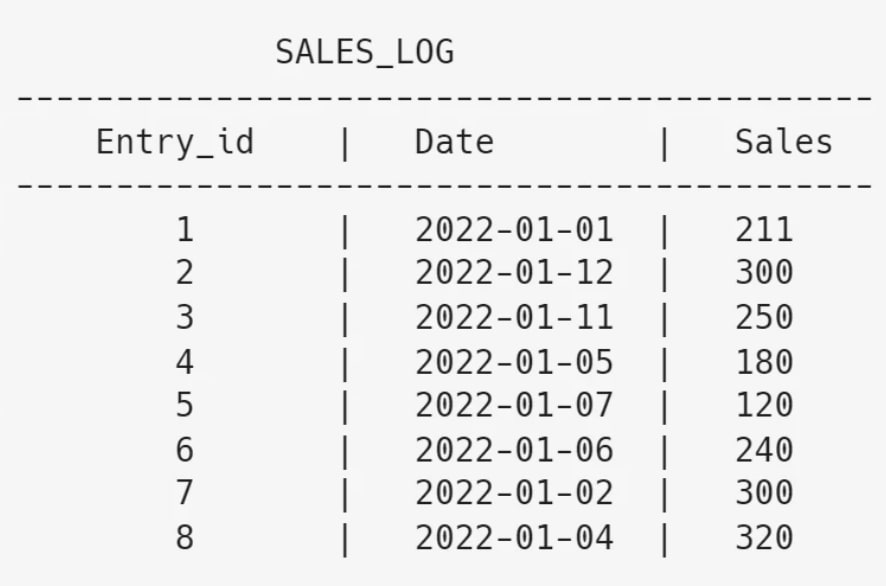
With, AVG & SUM
|
Solve
|
||||
|
|
|||||
|
Easy
Registration Queue
|
Solve | ||||
|
|
|||||
|
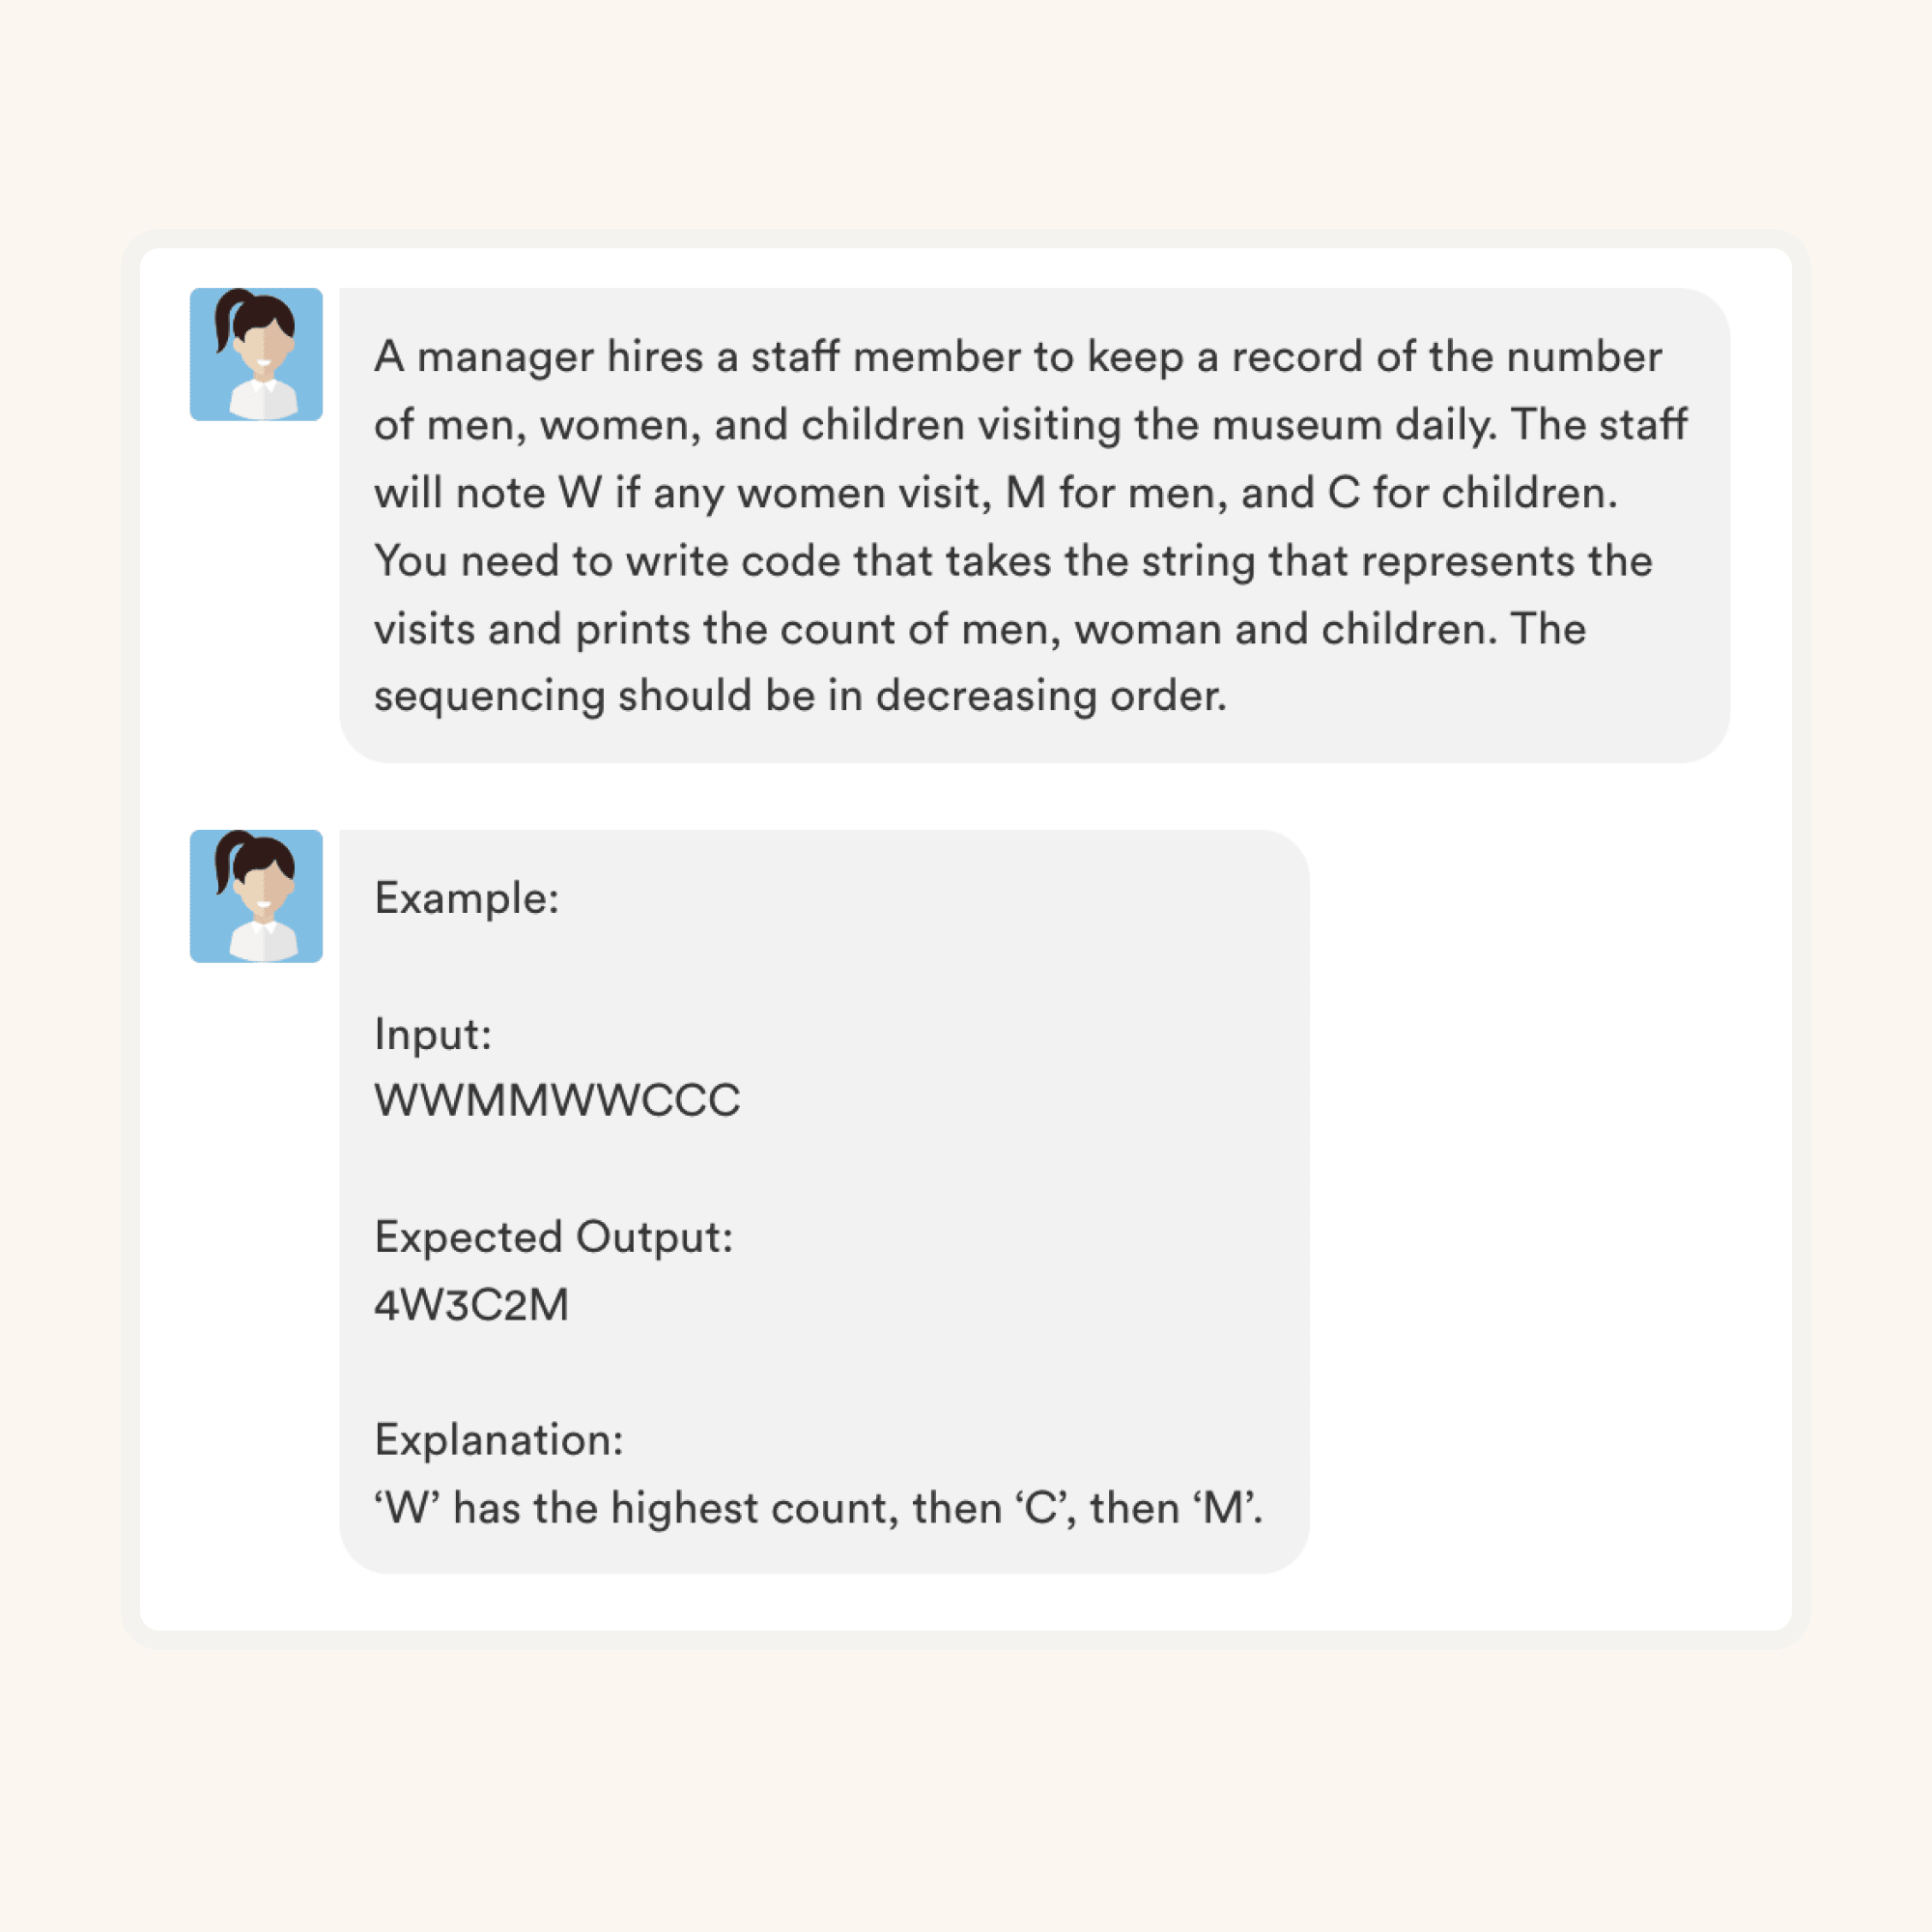
Medium
Visitors Count
|
Solve | ||||
|
|
|||||
| 🧐 Question | 🔧 Skill | ||
|---|---|---|---|
|
Medium
Data Filtering
|
2 mins Power BI
|
Solve
|
|
|
Medium
Many-to-one error
|
2 mins Power BI
|
Solve
|
|
|
Medium
Power Query Functions
|
2 mins Power BI
|
Solve
|
|
|
Medium
Calculated Properties
|
3 mins Tableau
|
Solve
|
|
|
Medium
Change display icon
|
2 mins Tableau
|
Solve
|
|
|
Easy
Pie Chart
|
3 mins Tableau
|
Solve
|
|
|
Medium
Applying Functions
|
3 mins R
|
Solve
|
|
|
Medium
Dataframe Transform
|
3 mins R
|
Solve
|
|
|
Medium
Matrix Manipulation
|
3 mins R
|
Solve
|
|
|
Medium
ZeroDivisionError and IndexError
|
2 mins Python
|
Solve
|
|
|
Medium
Session
|
2 mins Python
|
Solve
|
|
|
Medium
Max Code
|
2 mins Python
|
Solve
|
|
|
Medium
Recursive Function
|
3 mins Python
|
Solve
|
|
|
Medium
Stacking problem
|
4 mins Python
|
Solve
|
|
|
Medium
Multi Select
|
2 mins SQL
|
Solve
|
|
|
Medium
nth highest sales
|
3 mins SQL
|
Solve
|
|
|
Medium
Select & IN
|
3 mins SQL
|
Solve
|
|
|
Medium
Sorting Ubers
|
3 mins SQL
|
Solve
|
|
|
Hard
With, AVG & SUM
|
2 mins SQL
|
Solve
|
|
|
Easy
Registration Queue
|
30 mins Coding
|
Solve | |
|
Medium
Visitors Count
|
30 mins Coding
|
Solve |
| 🧐 Question | 🔧 Skill | 💪 Difficulty | ⌛ Time | ||
|---|---|---|---|---|---|
|
Data Filtering
|
Power BI
|
Medium | 2 mins |
Solve
|
|
|
Many-to-one error
|
Power BI
|
Medium | 2 mins |
Solve
|
|
|
Power Query Functions
|
Power BI
|
Medium | 2 mins |
Solve
|
|
|
Calculated Properties
|
Tableau
|
Medium | 3 mins |
Solve
|
|
|
Change display icon
|
Tableau
|
Medium | 2 mins |
Solve
|
|
|
Pie Chart
|
Tableau
|
Easy | 3 mins |
Solve
|
|
|
Applying Functions
|
R
|
Medium | 3 mins |
Solve
|
|
|
Dataframe Transform
|
R
|
Medium | 3 mins |
Solve
|
|
|
Matrix Manipulation
|
R
|
Medium | 3 mins |
Solve
|
|
|
ZeroDivisionError and IndexError
|
Python
|
Medium | 2 mins |
Solve
|
|
|
Session
|
Python
|
Medium | 2 mins |
Solve
|
|
|
Max Code
|
Python
|
Medium | 2 mins |
Solve
|
|
|
Recursive Function
|
Python
|
Medium | 3 mins |
Solve
|
|
|
Stacking problem
|
Python
|
Medium | 4 mins |
Solve
|
|
|
Multi Select
|
SQL
|
Medium | 2 mins |
Solve
|
|
|
nth highest sales
|
SQL
|
Medium | 3 mins |
Solve
|
|
|
Select & IN
|
SQL
|
Medium | 3 mins |
Solve
|
|
|
Sorting Ubers
|
SQL
|
Medium | 3 mins |
Solve
|
|
|
With, AVG & SUM
|
SQL
|
Hard | 2 mins |
Solve
|
|
|
Registration Queue
|
Coding
|
Easy | 30 mins | Solve | |
|
Visitors Count
|
Coding
|
Medium | 30 mins | Solve |
With Adaface, we were able to optimise our initial screening process by upwards of 75%, freeing up precious time for both hiring managers and our talent acquisition team alike!
Brandon Lee, Head of People, Love, Bonito
It's very easy to share assessments with candidates and for candidates to use. We get good feedback from candidates about completing the tests. Adaface are very responsive and friendly to deal with.
Kirsty Wood, Human Resources, WillyWeather
We were able to close 106 positions in a record time of 45 days! Adaface enables us to conduct aptitude and psychometric assessments seamlessly. My hiring managers have never been happier with the quality of candidates shortlisted.
Amit Kataria, CHRO, Hanu
We evaluated several of their competitors and found Adaface to be the most compelling. Great library of questions that are designed to test for fit rather than memorization of algorithms.
Swayam Narain, CTO, Affable
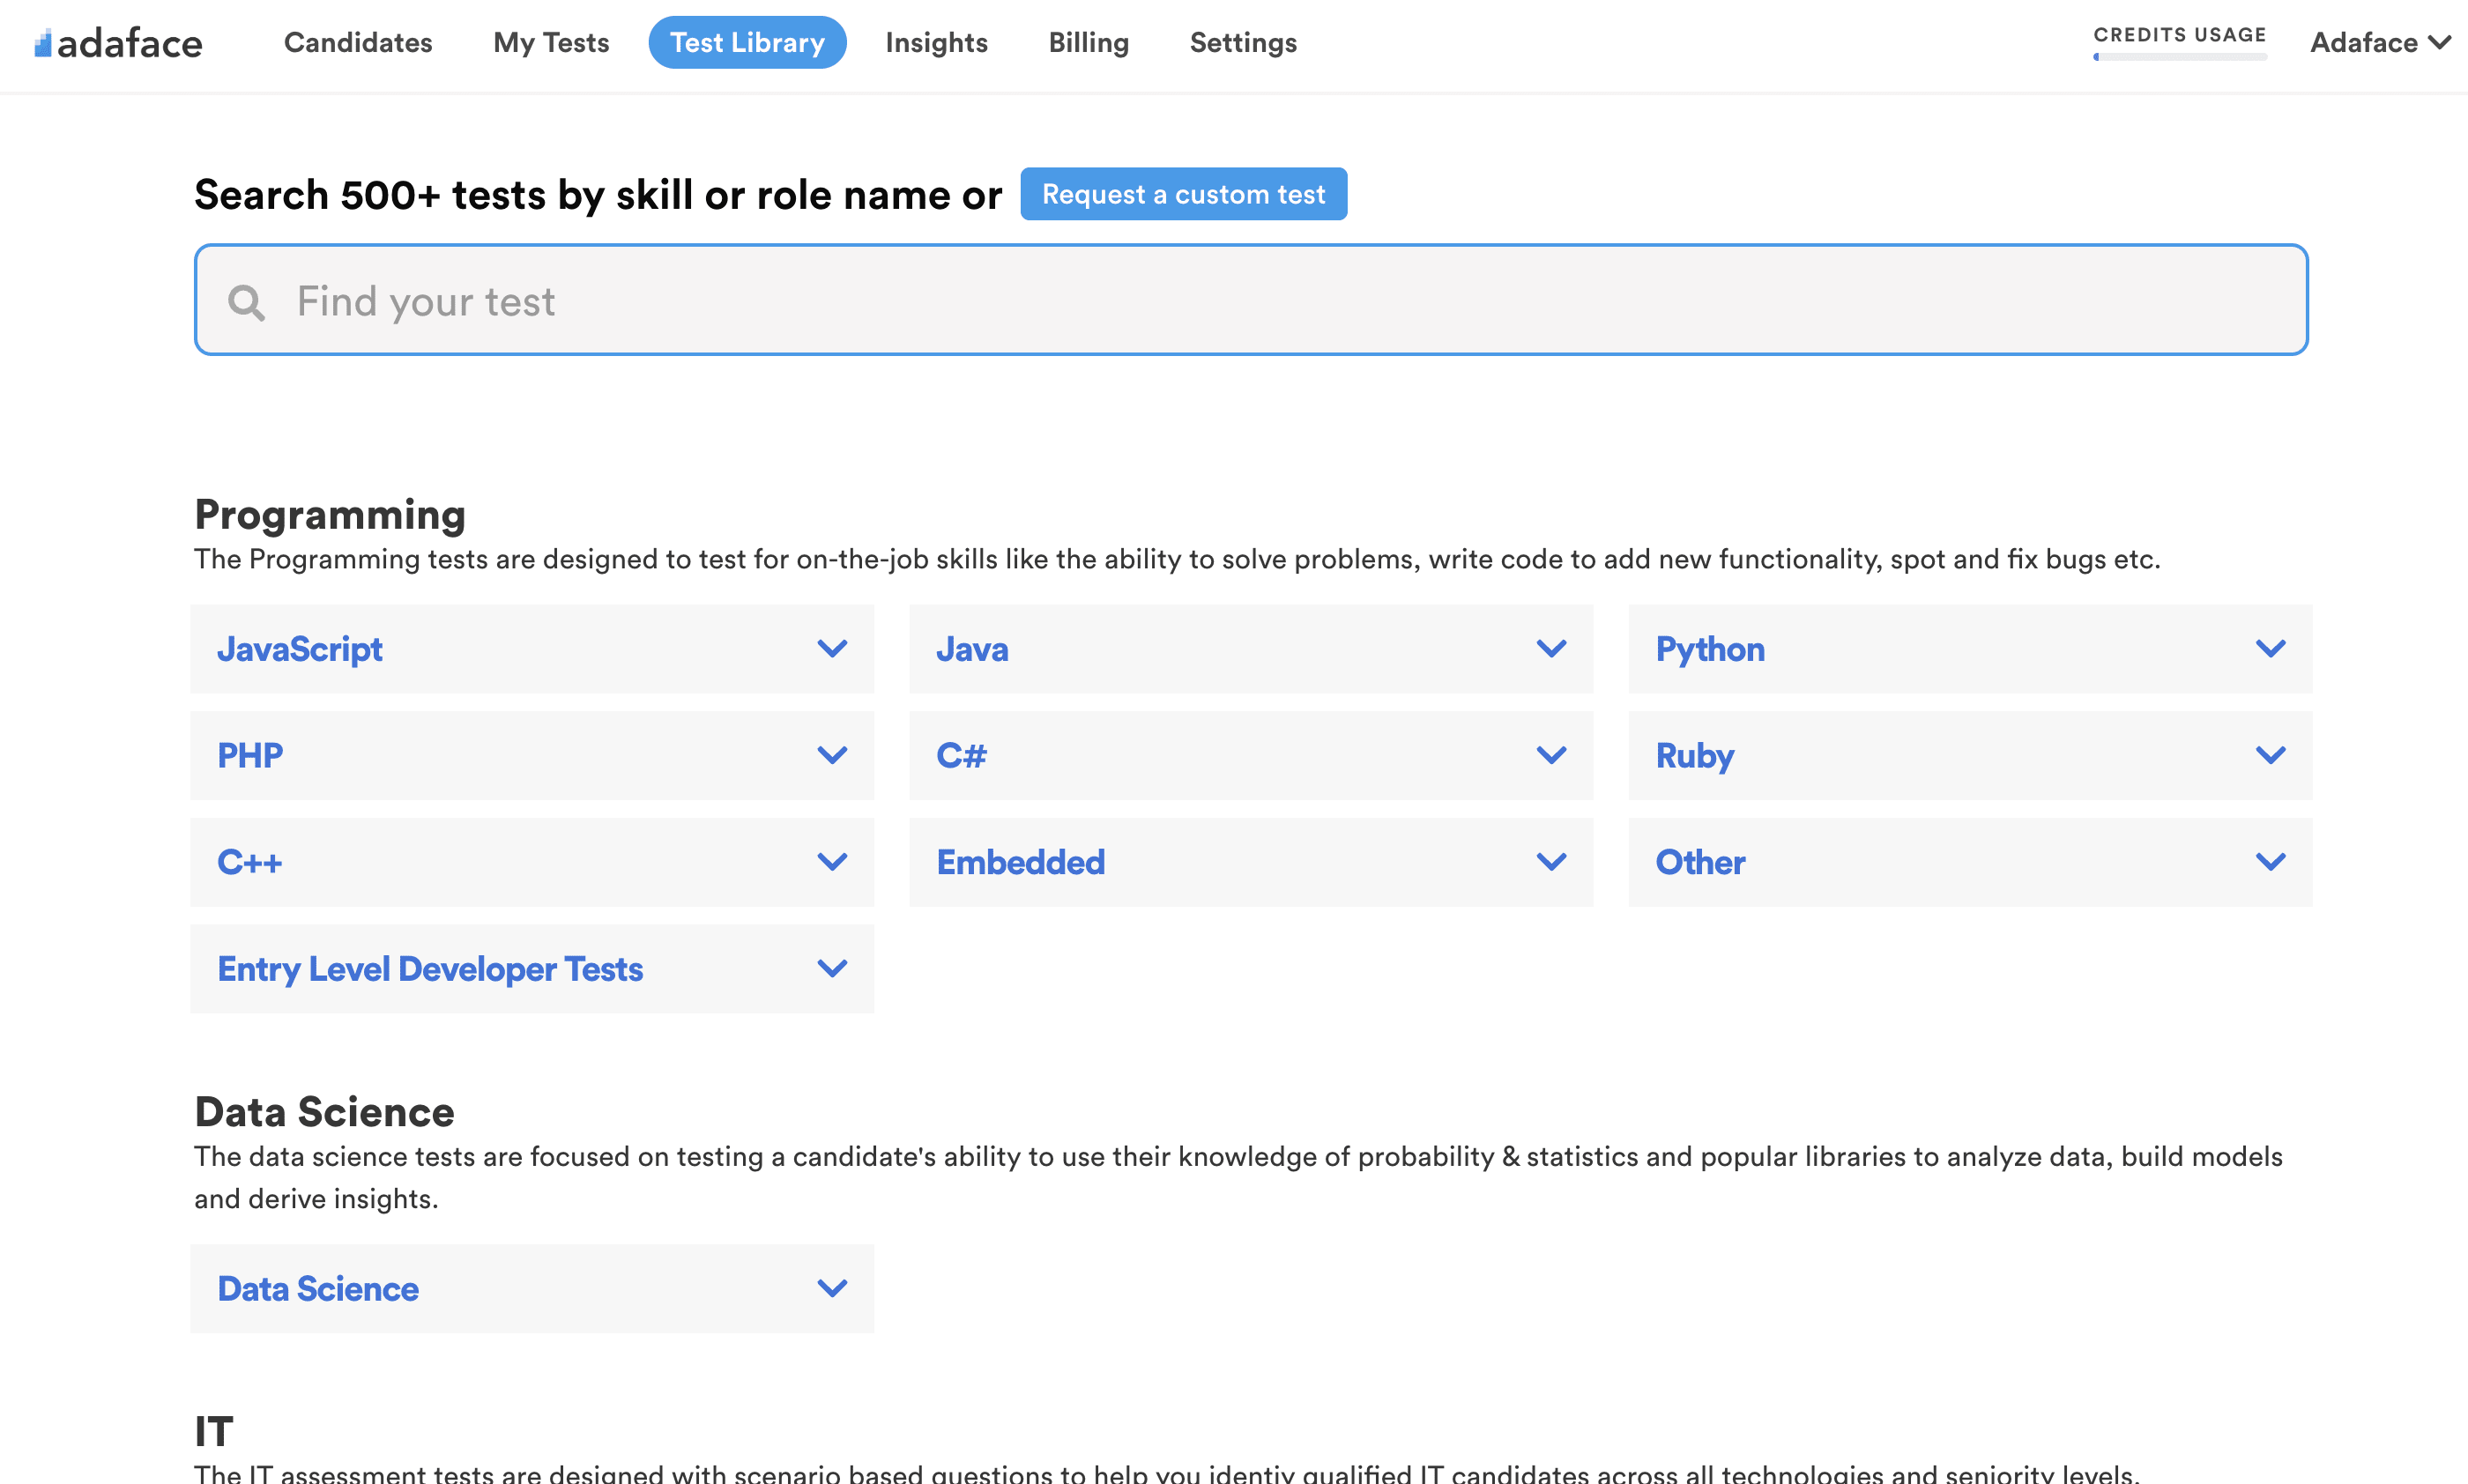
The Adaface test library features 500+ tests to enable you to test candidates on all popular skills- everything from programming languages, software frameworks, devops, logical reasoning, abstract reasoning, critical thinking, fluid intelligence, content marketing, talent acquisition, customer service, accounting, product management, sales and more.
The BI Developer Test assesses candidates' skills in Business Intelligence tools and languages. It's used by recruiters to measure proficiency in Power BI, Tableau, R, Python, and SQL.
Yes, recruiters can request a single custom test with multiple skills. For more details on SQL assessment, check the SQL Online Test.
The test evaluates skills like Power BI data wrangling, Tableau dashboards, Python programming, R analytics, and SQL CRUD operations and joins.
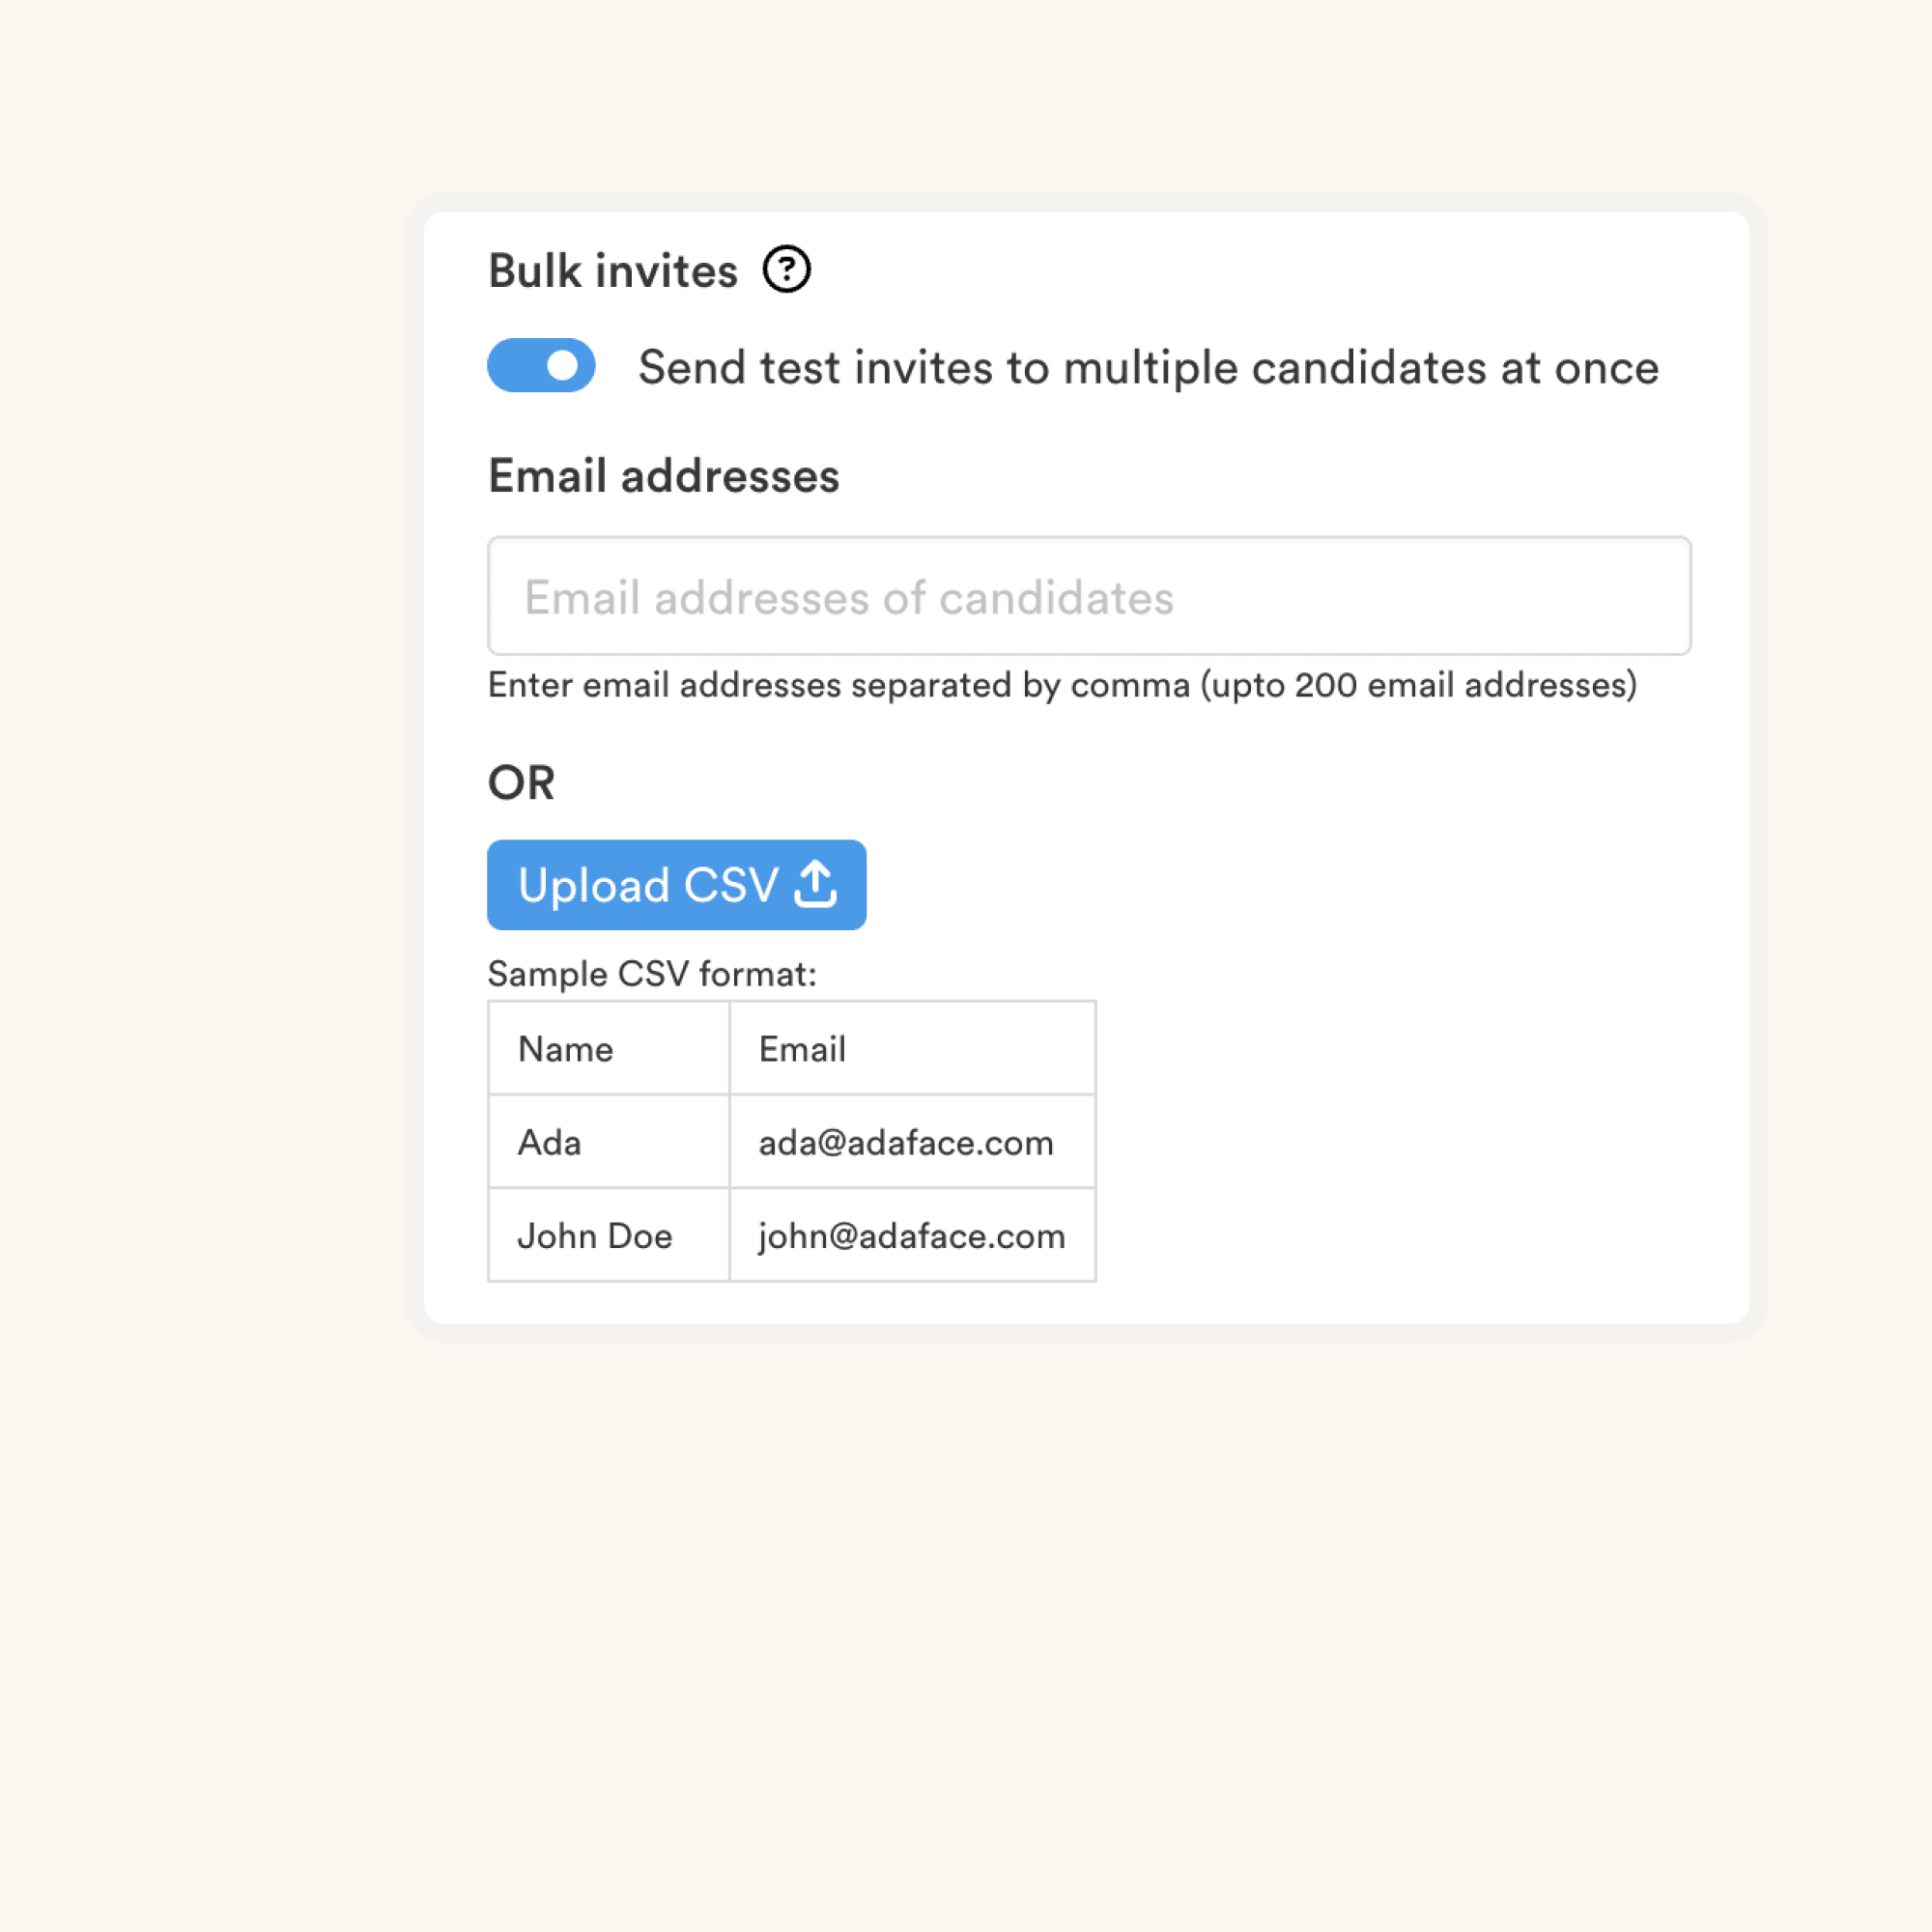
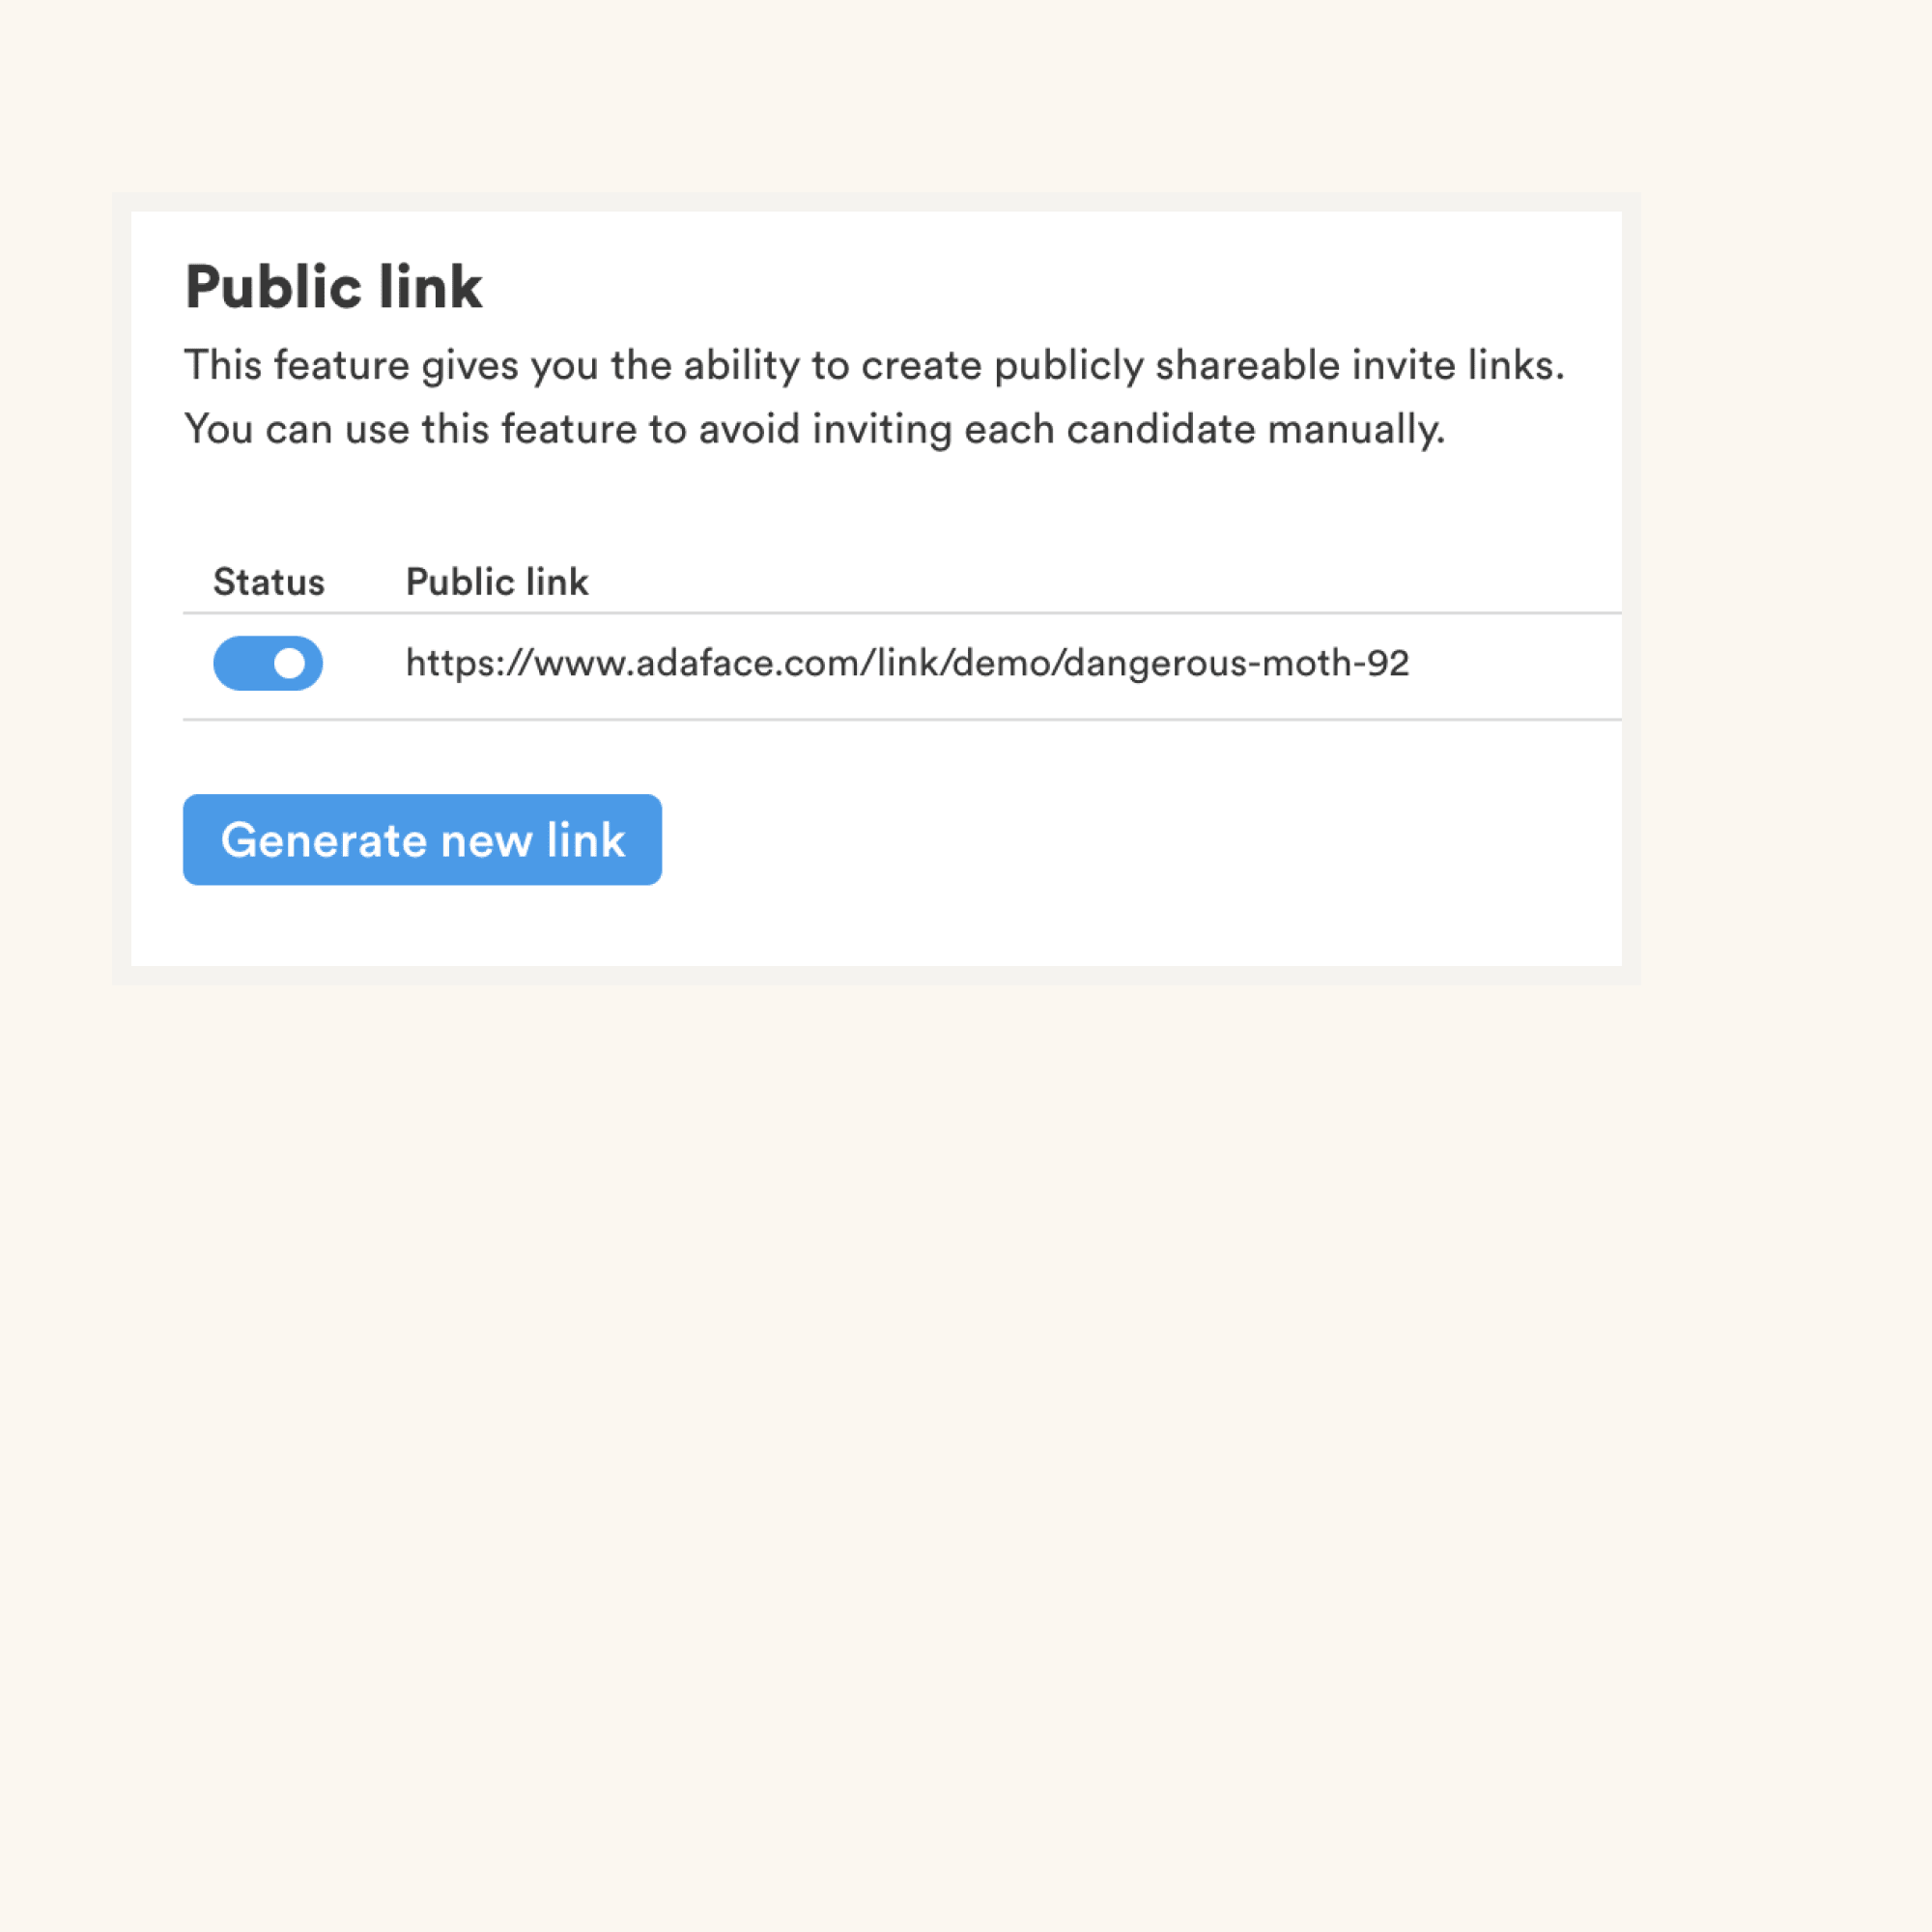
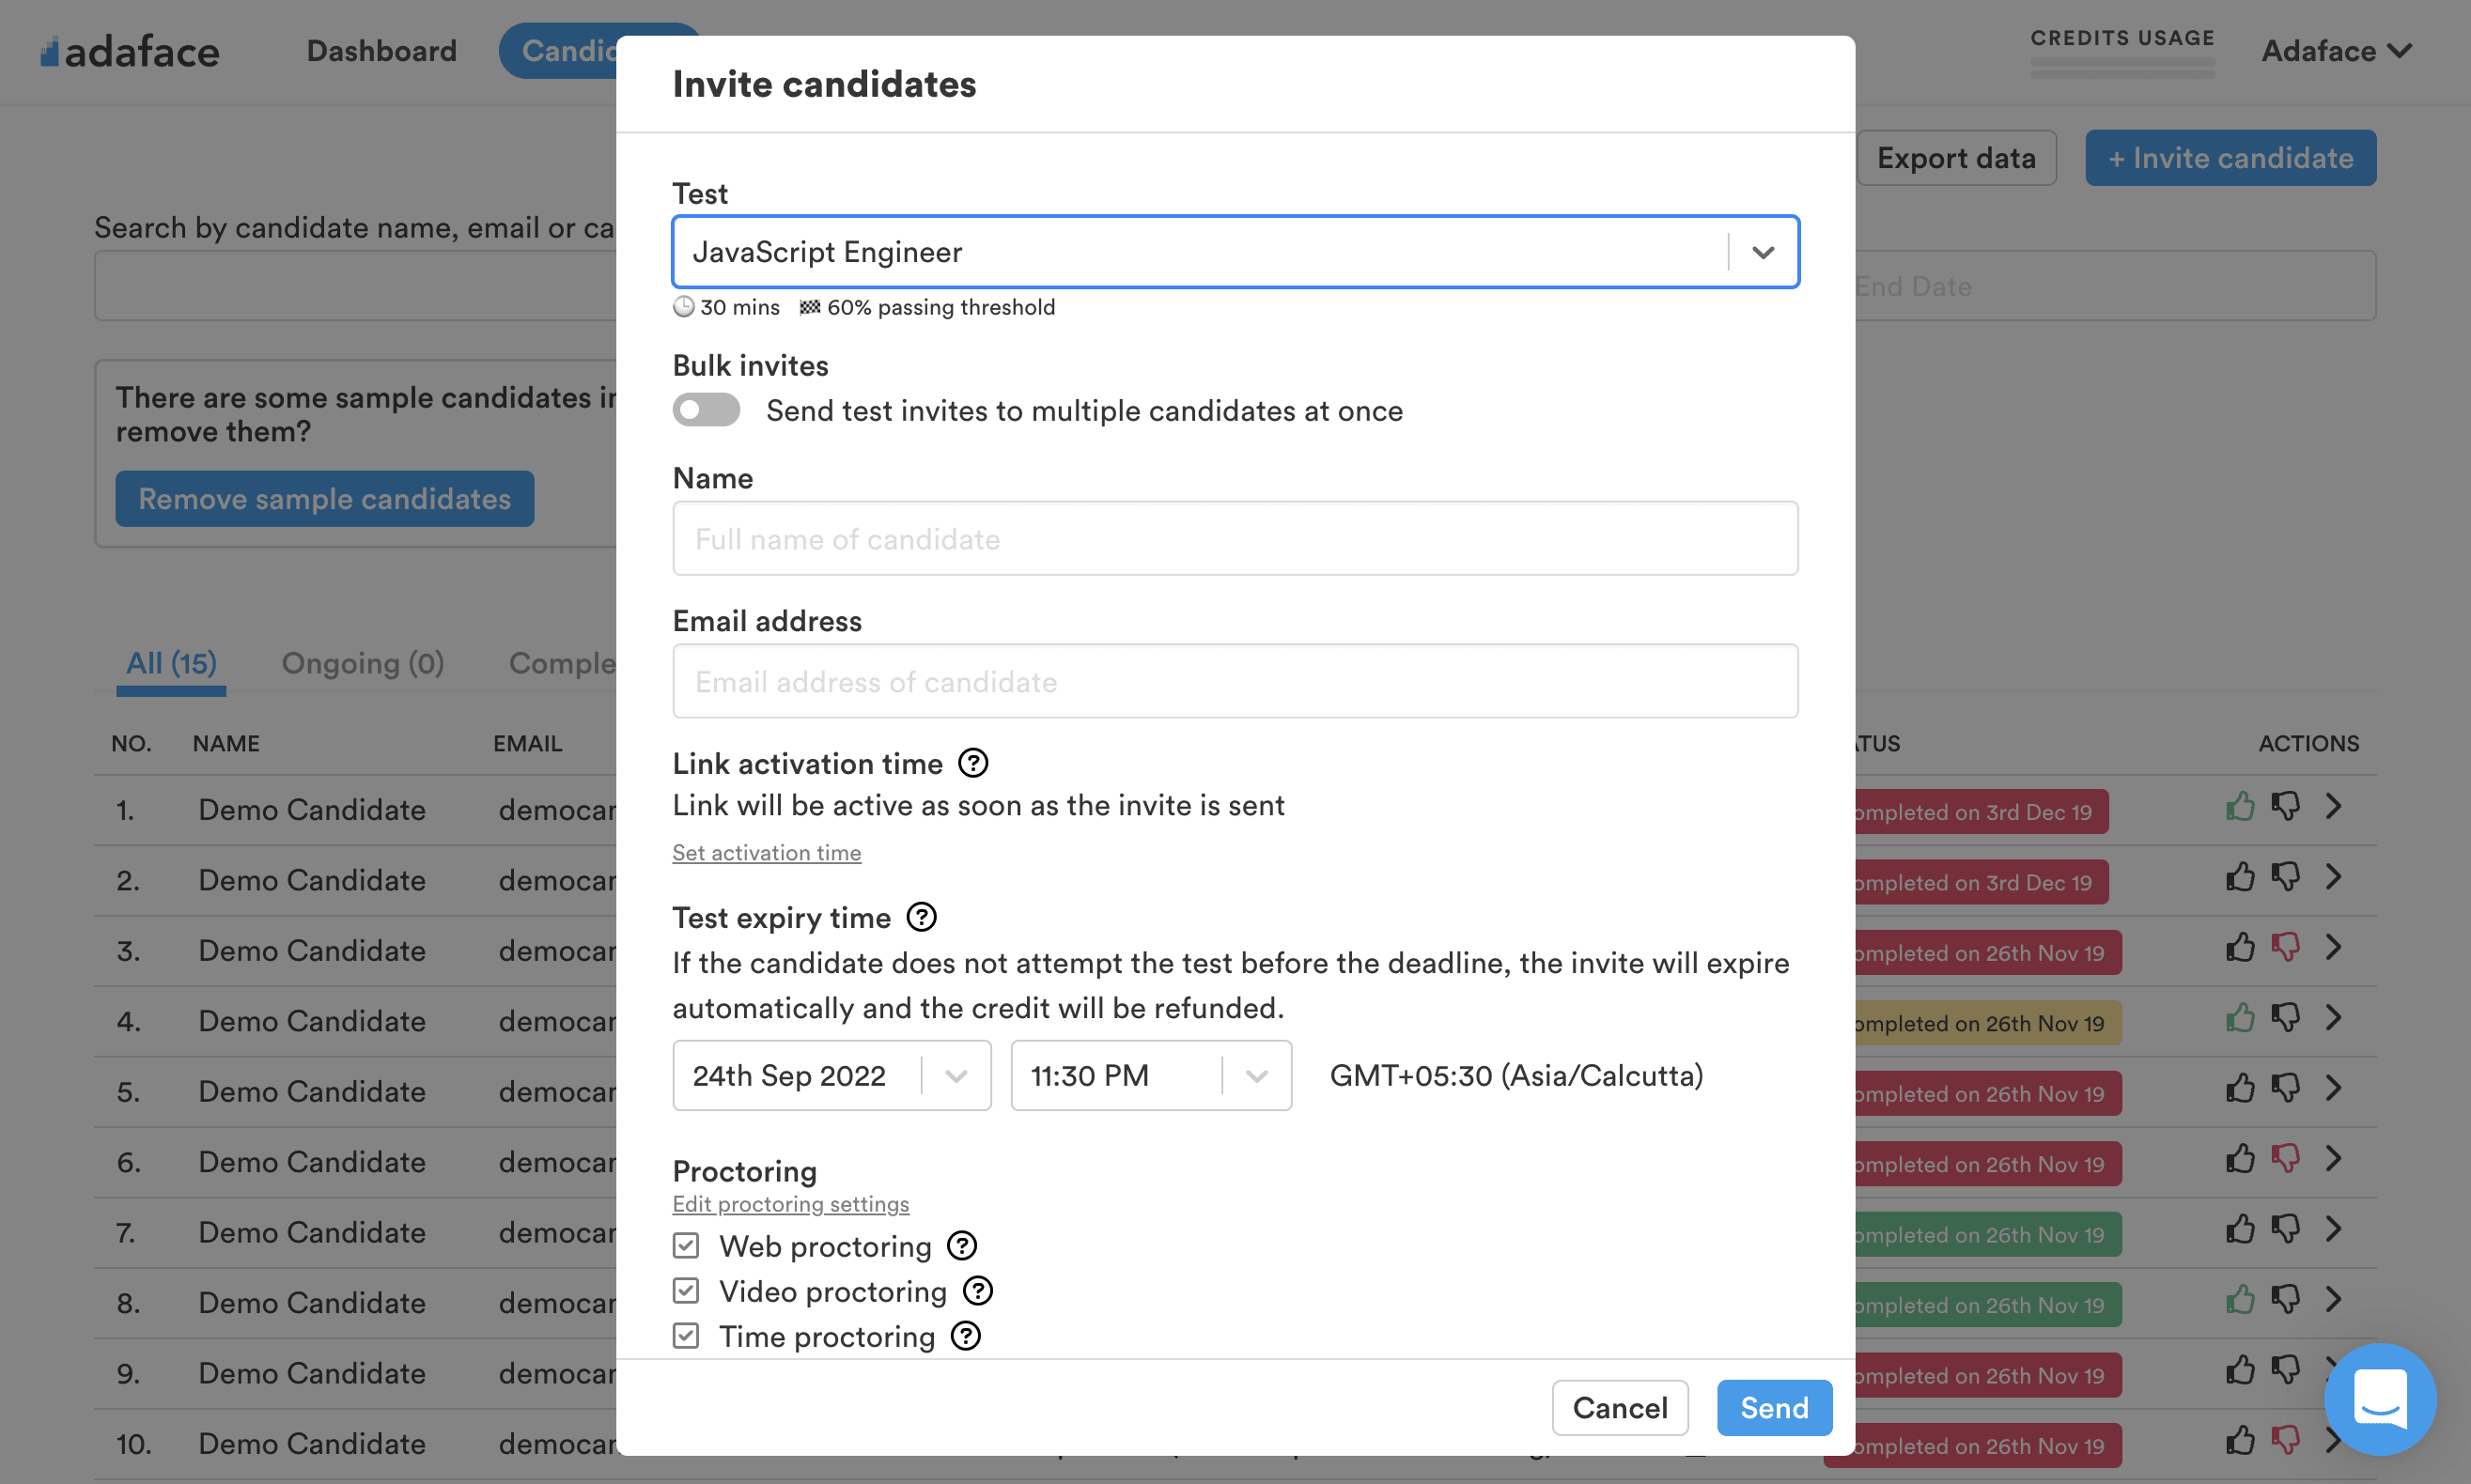
We recommend using our assessment software as a pre-screening tool at the beginning of your recruitment process. You can add a link to the assessment in your job post or directly invite candidates by email.
Yes, you can. We offer a combined test for Python & SQL. It's recommended for assessing both programming and database skills in one go.
The main Business Intelligence tests include:
Yes, absolutely. Custom assessments are set up based on your job description, and will include questions on all must-have skills you specify. Here's a quick guide on how you can request a custom test.
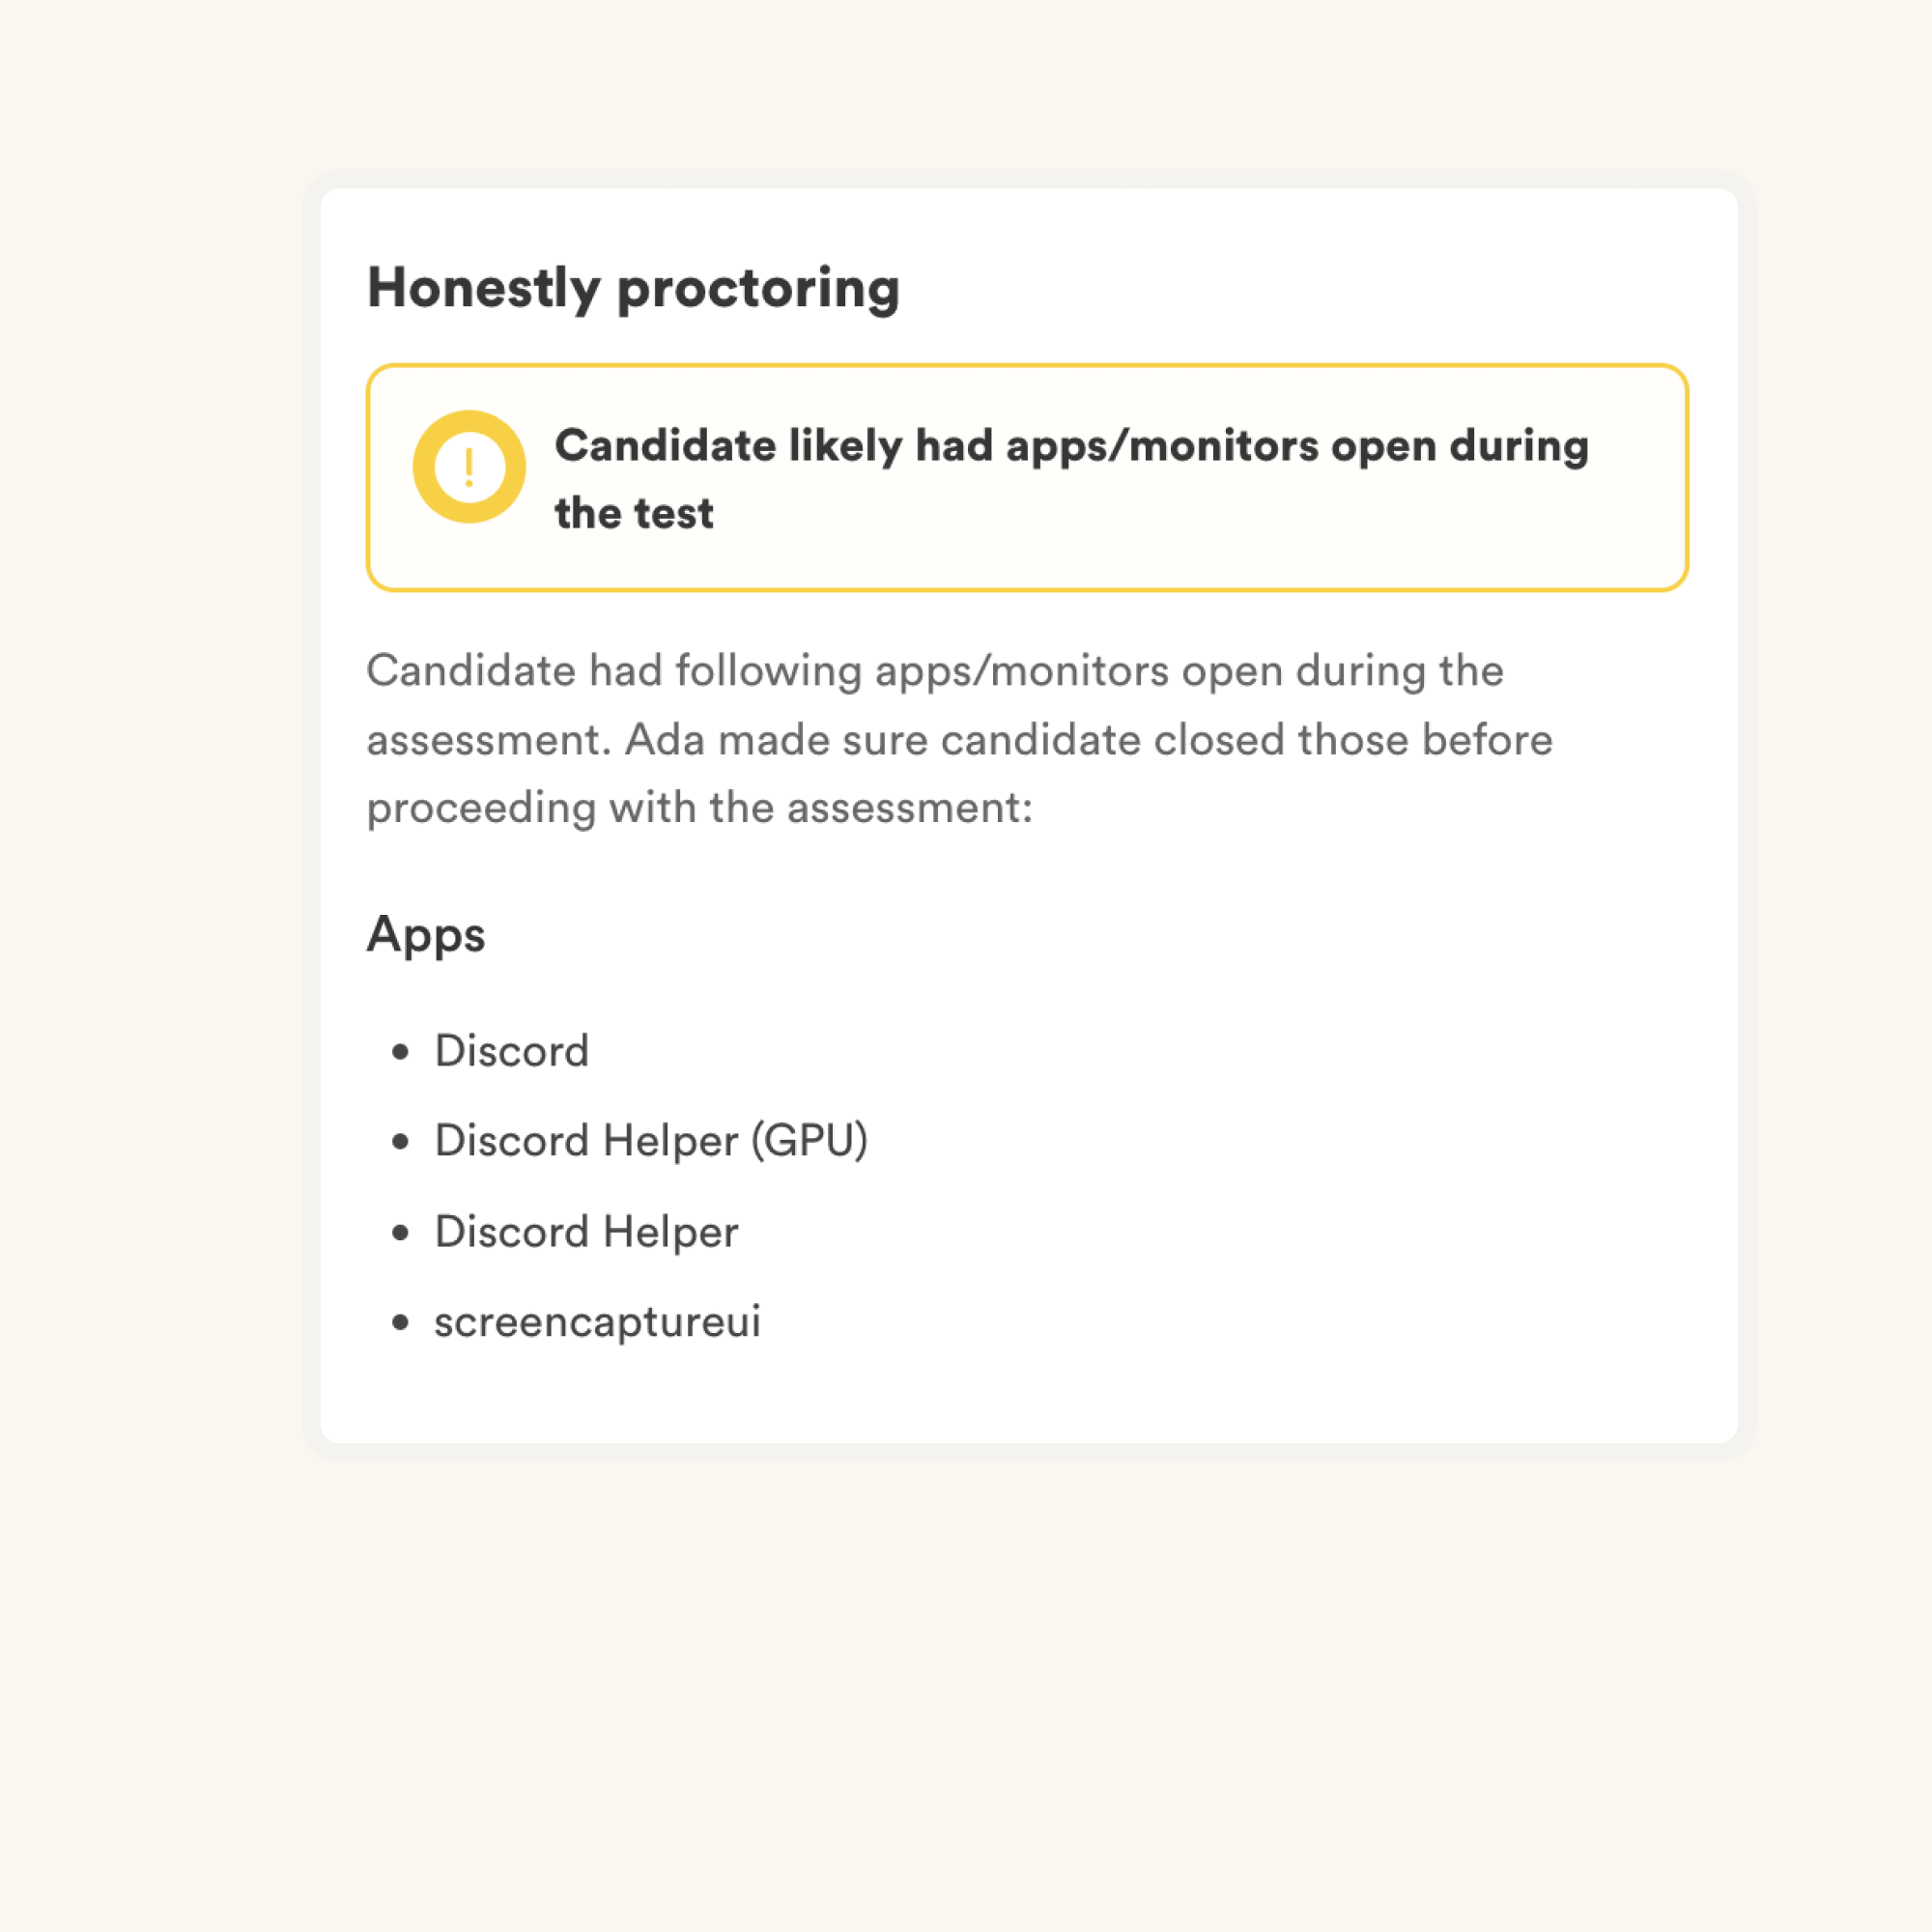
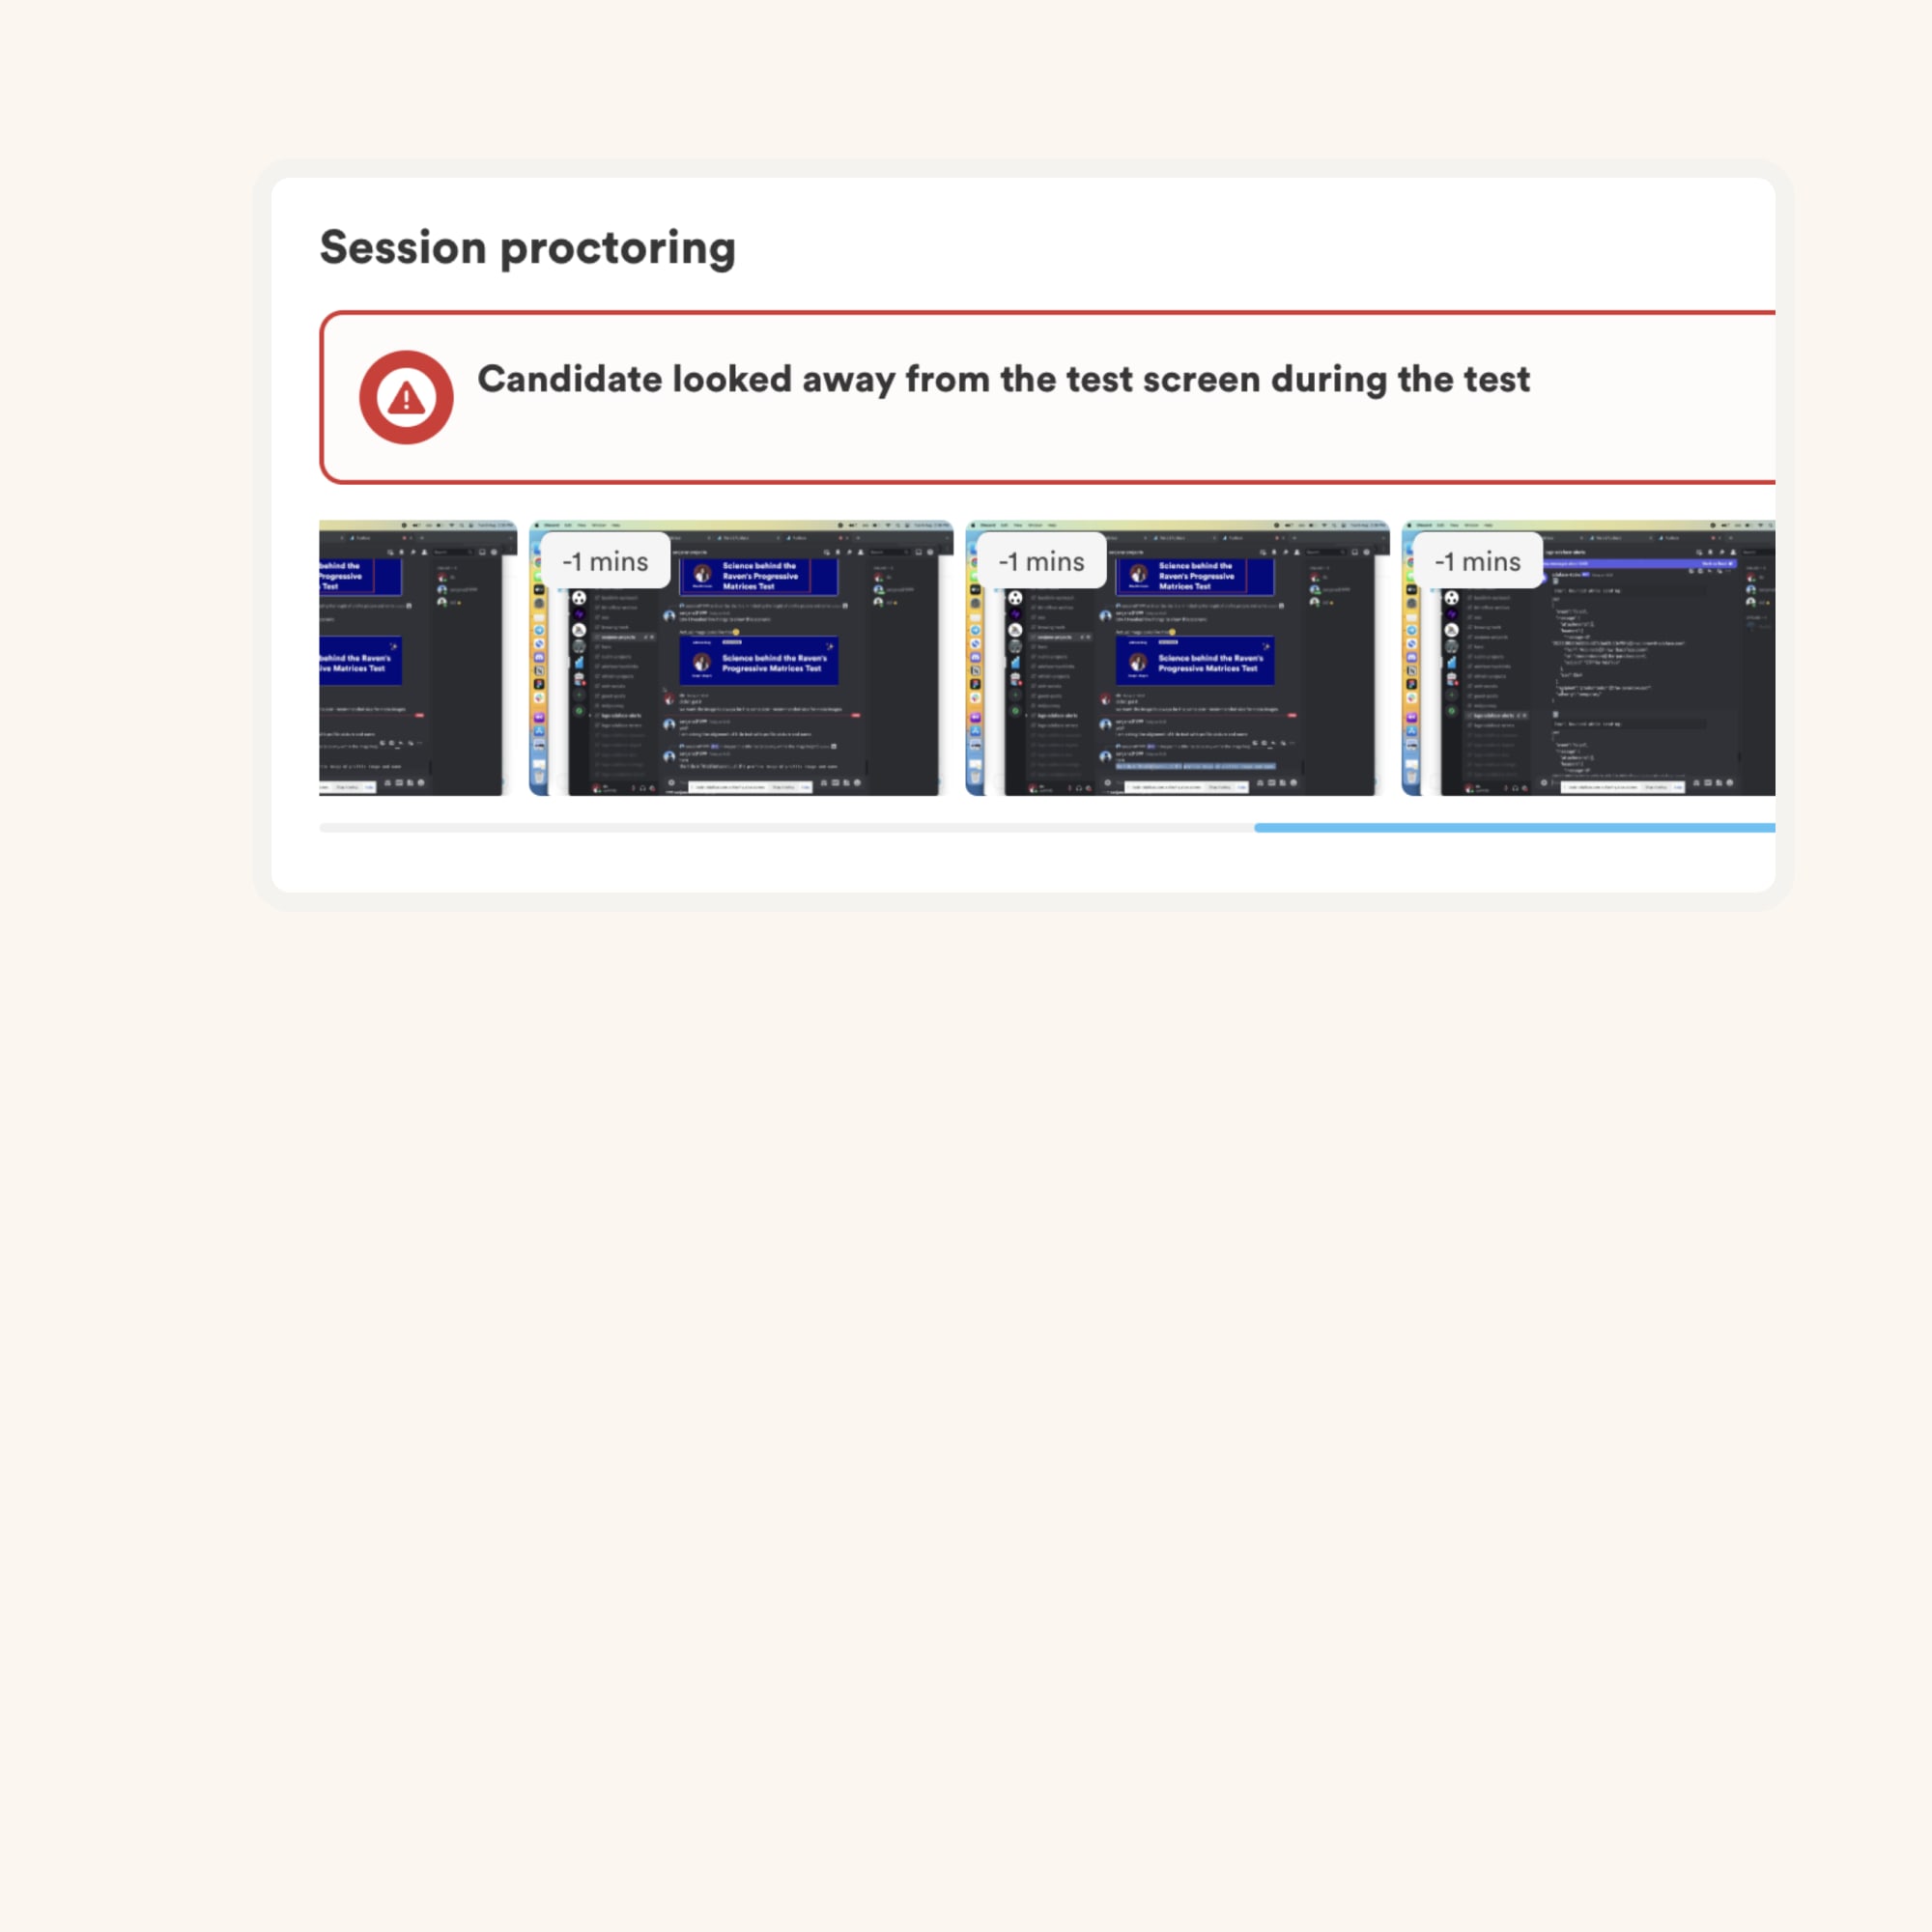
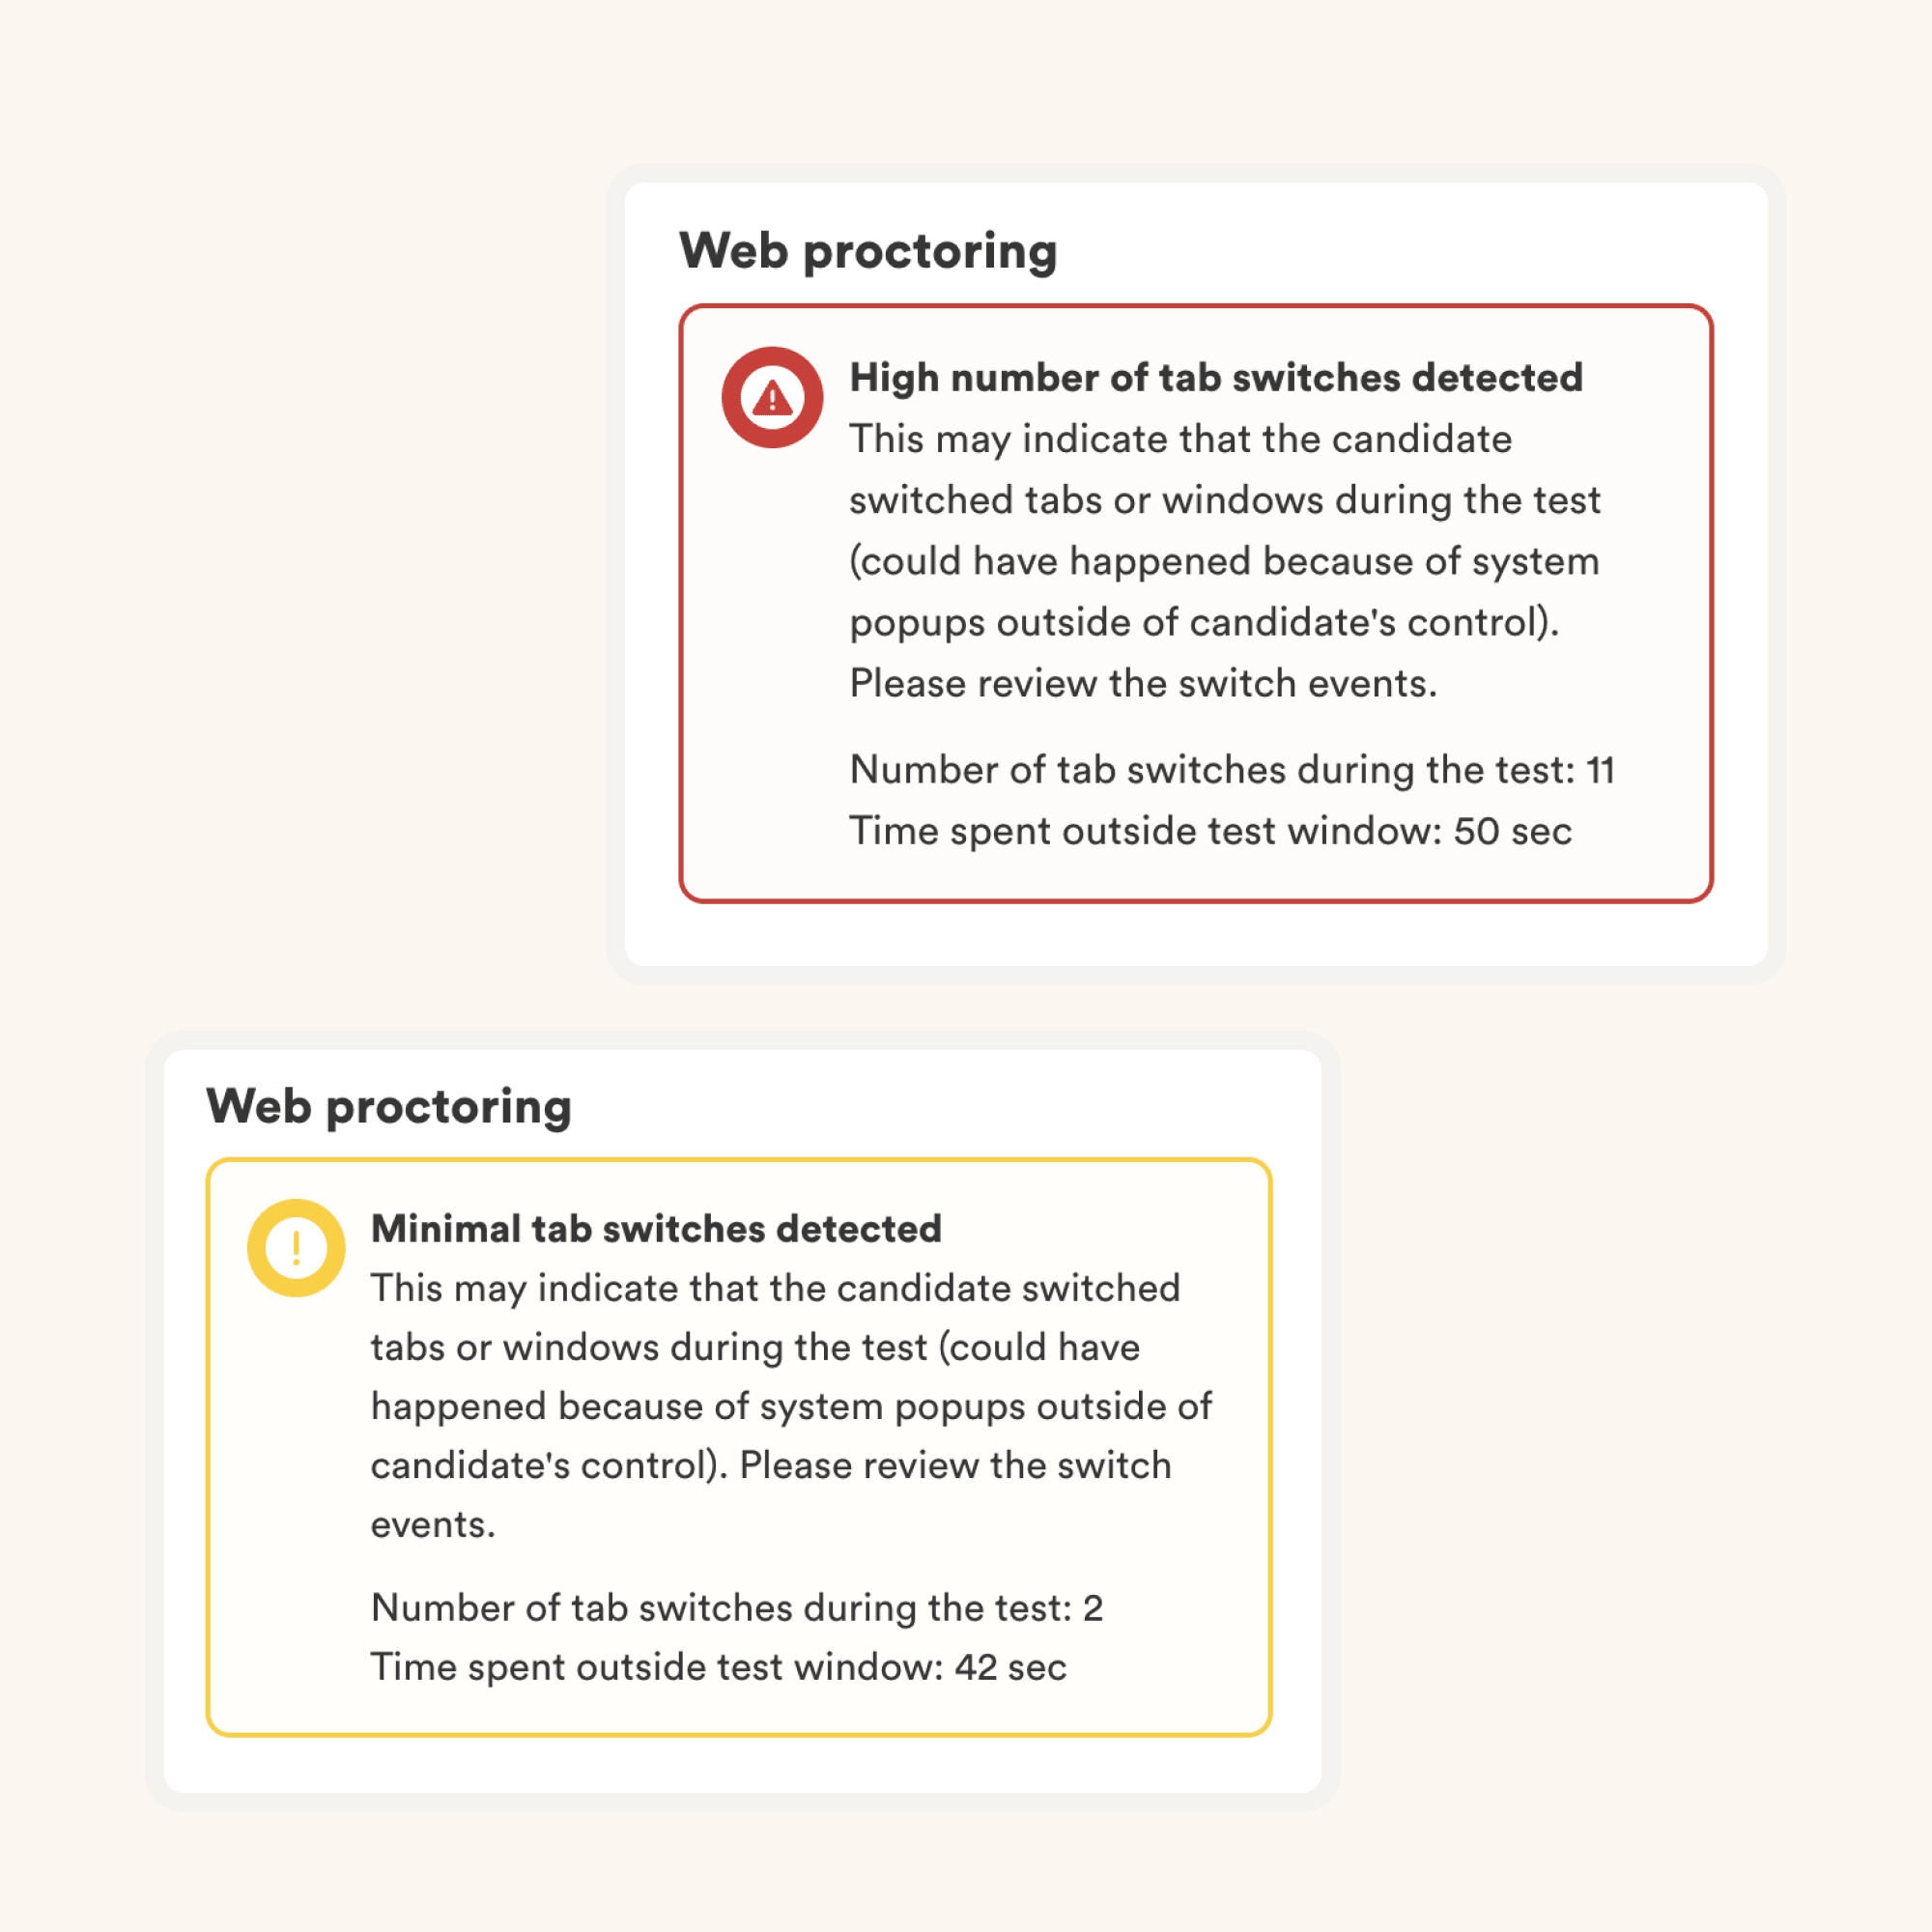
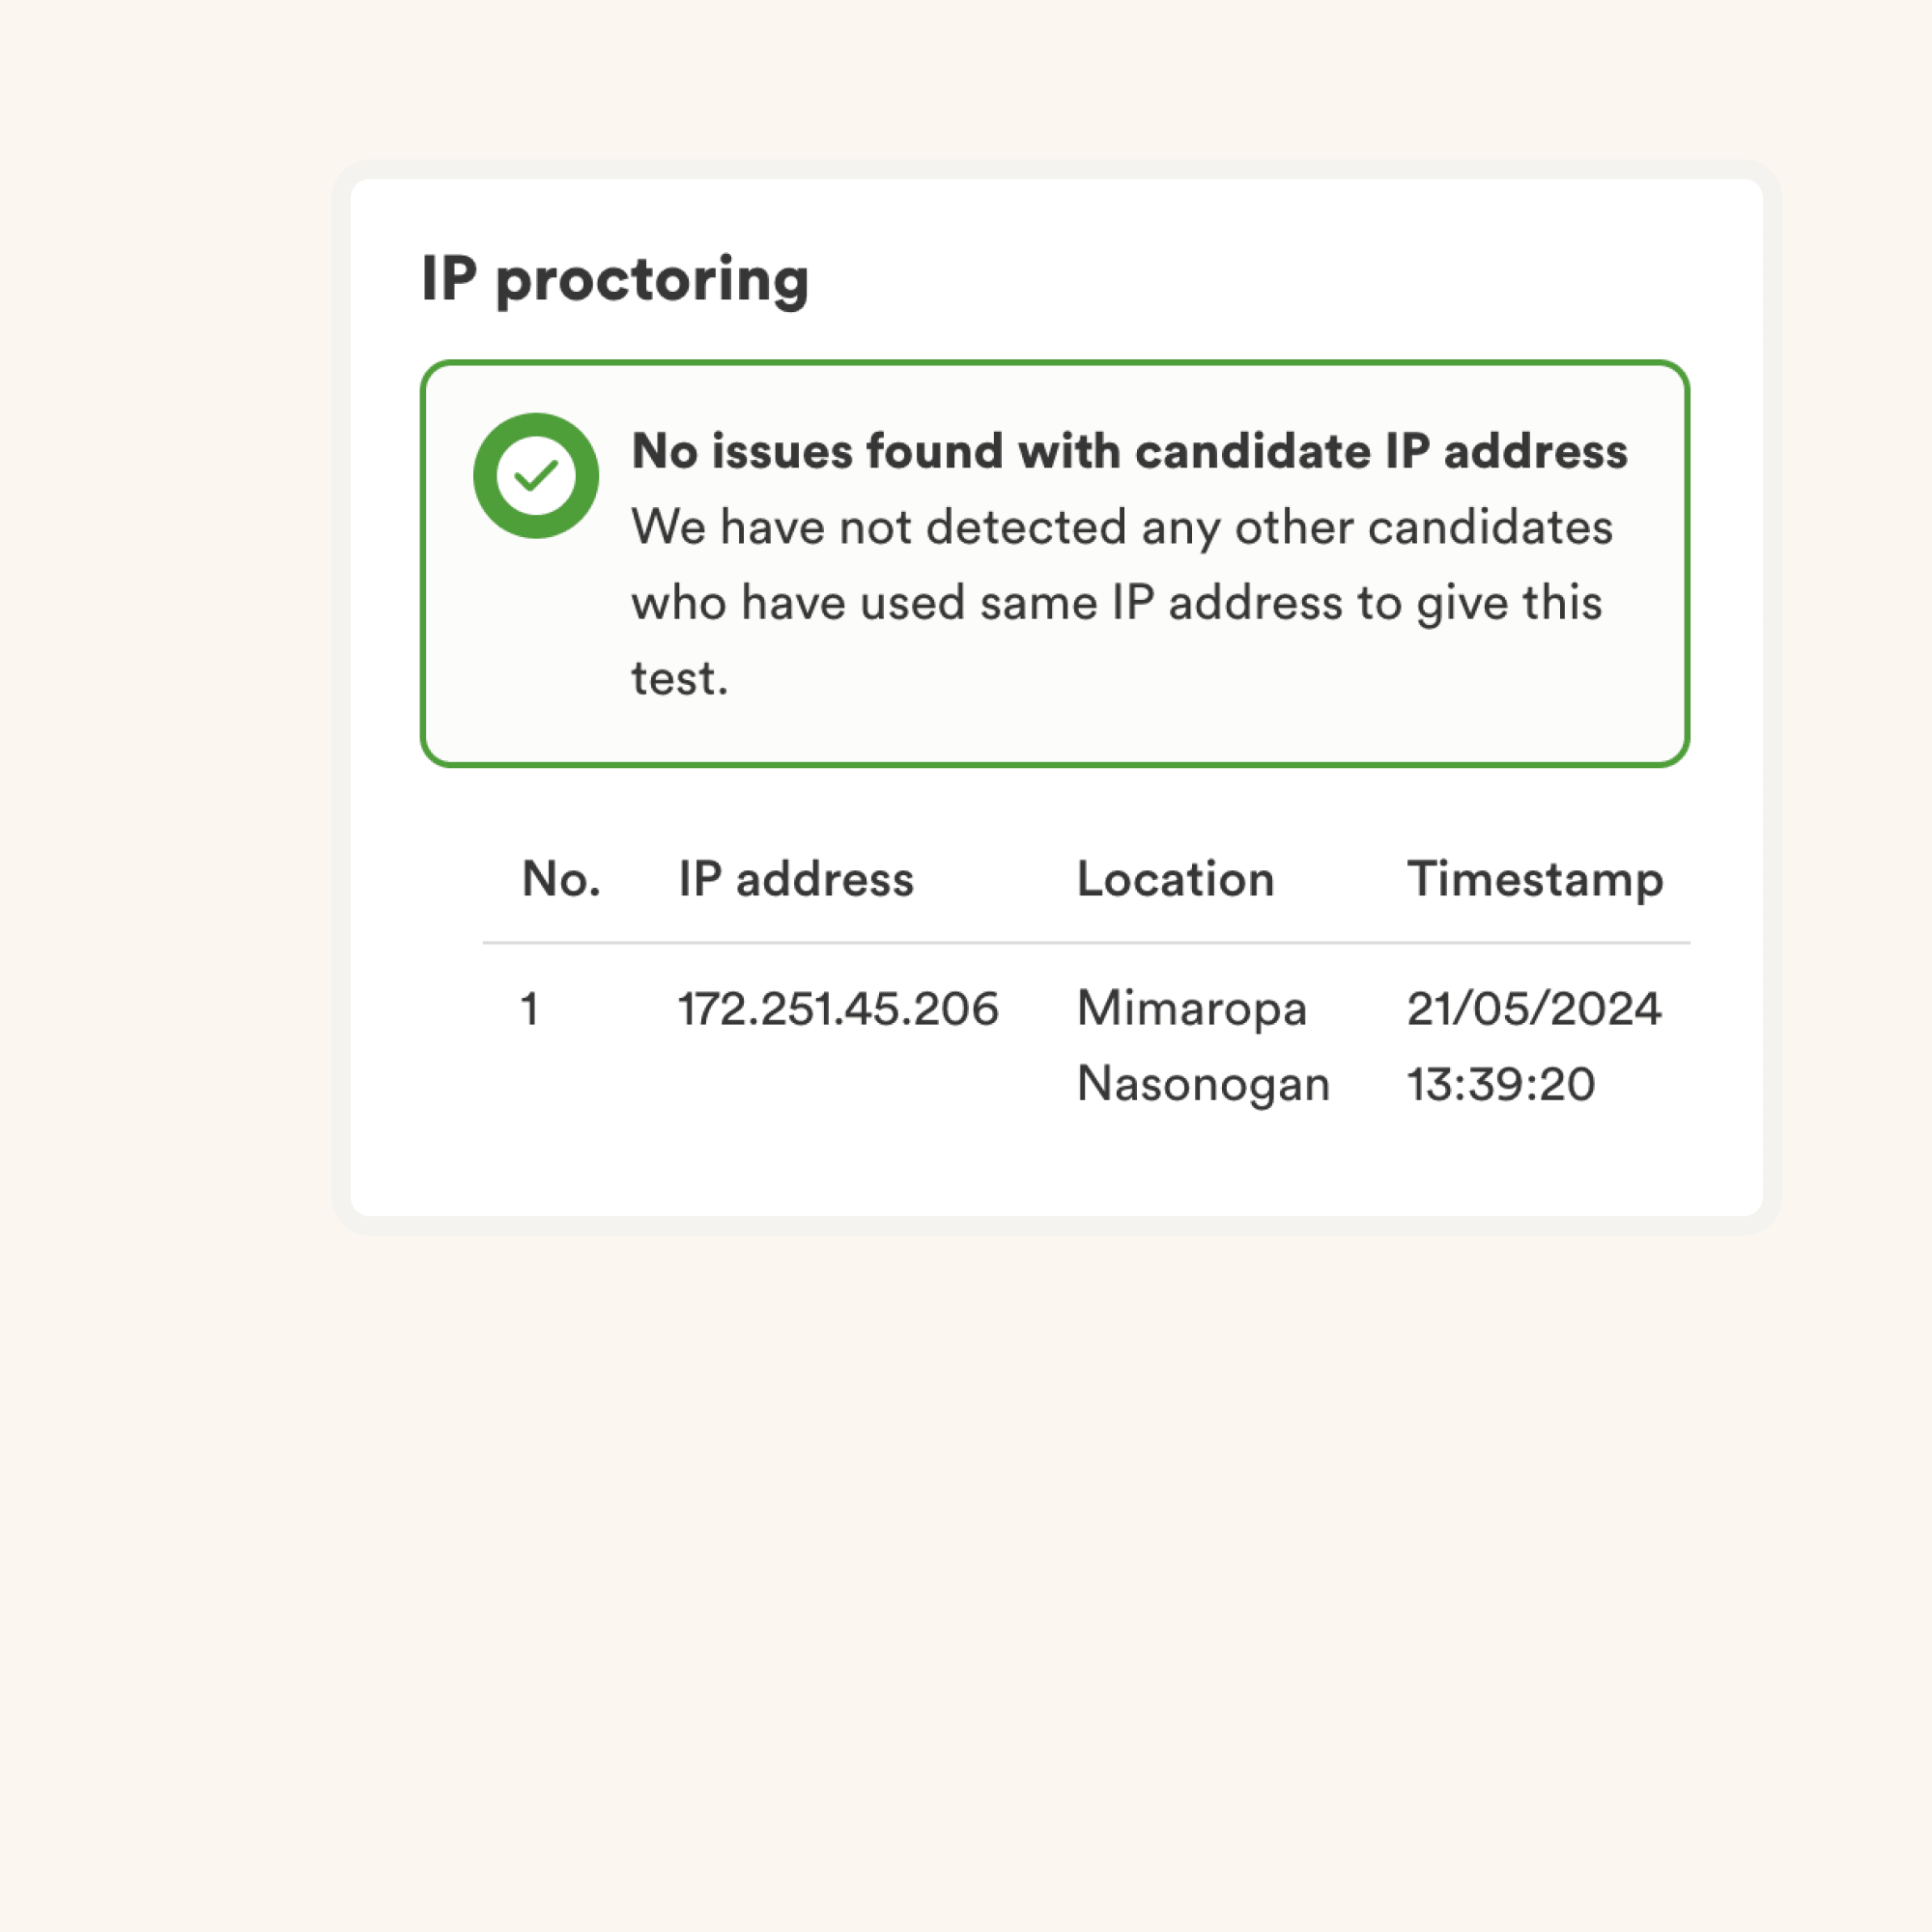
We have the following anti-cheating features in place:
Read more about the proctoring features.
The primary thing to keep in mind is that an assessment is an elimination tool, not a selection tool. A skills assessment is optimized to help you eliminate candidates who are not technically qualified for the role, it is not optimized to help you find the best candidate for the role. So the ideal way to use an assessment is to decide a threshold score (typically 55%, we help you benchmark) and invite all candidates who score above the threshold for the next rounds of interview.
Each Adaface assessment is customized to your job description/ ideal candidate persona (our subject matter experts will pick the right questions for your assessment from our library of 10000+ questions). This assessment can be customized for any experience level.
Yes, it makes it much easier for you to compare candidates. Options for MCQ questions and the order of questions are randomized. We have anti-cheating/ proctoring features in place. In our enterprise plan, we also have the option to create multiple versions of the same assessment with questions of similar difficulty levels.
No. Unfortunately, we do not support practice tests at the moment. However, you can use our sample questions for practice.
You can check out our pricing plans.
Yes, you can sign up for free and preview this test.
Here is a quick guide on how to request a custom assessment on Adaface.