Search test library by skills or roles
⌘ K

About the test:

The Business Intelligence Developer test uses scenario-based multiple-choice questions to evaluate a candidate's knowledge and skills related to data modeling and ETL processes, data warehousing and data mining, BI reporting and visualization, data analysis and predictive modeling, and BI project management. Candidates are also be evaluated on their ability to use BI tools and technologies such as SQL Server, Power BI, Tableau, and other related tools, and their proficiency in applying data analysis and business intelligence techniques to solve complex business problems.

Covered skills:

  • Power Pivot
  • Strømkart
  • Power Query
  • Datakilde -kontakter
See all covered skills

9 reasons why
9 reasons why

Adaface BI utviklertest is the most accurate way to shortlist candidates


Reason #1

Tests for on-the-job skills

The BI utviklertest helps recruiters and hiring managers identify qualified candidates from a pool of resumes, and helps in taking objective hiring decisions. It reduces the administrative overhead of interviewing too many candidates and saves time by filtering out unqualified candidates at the first step of the hiring process.

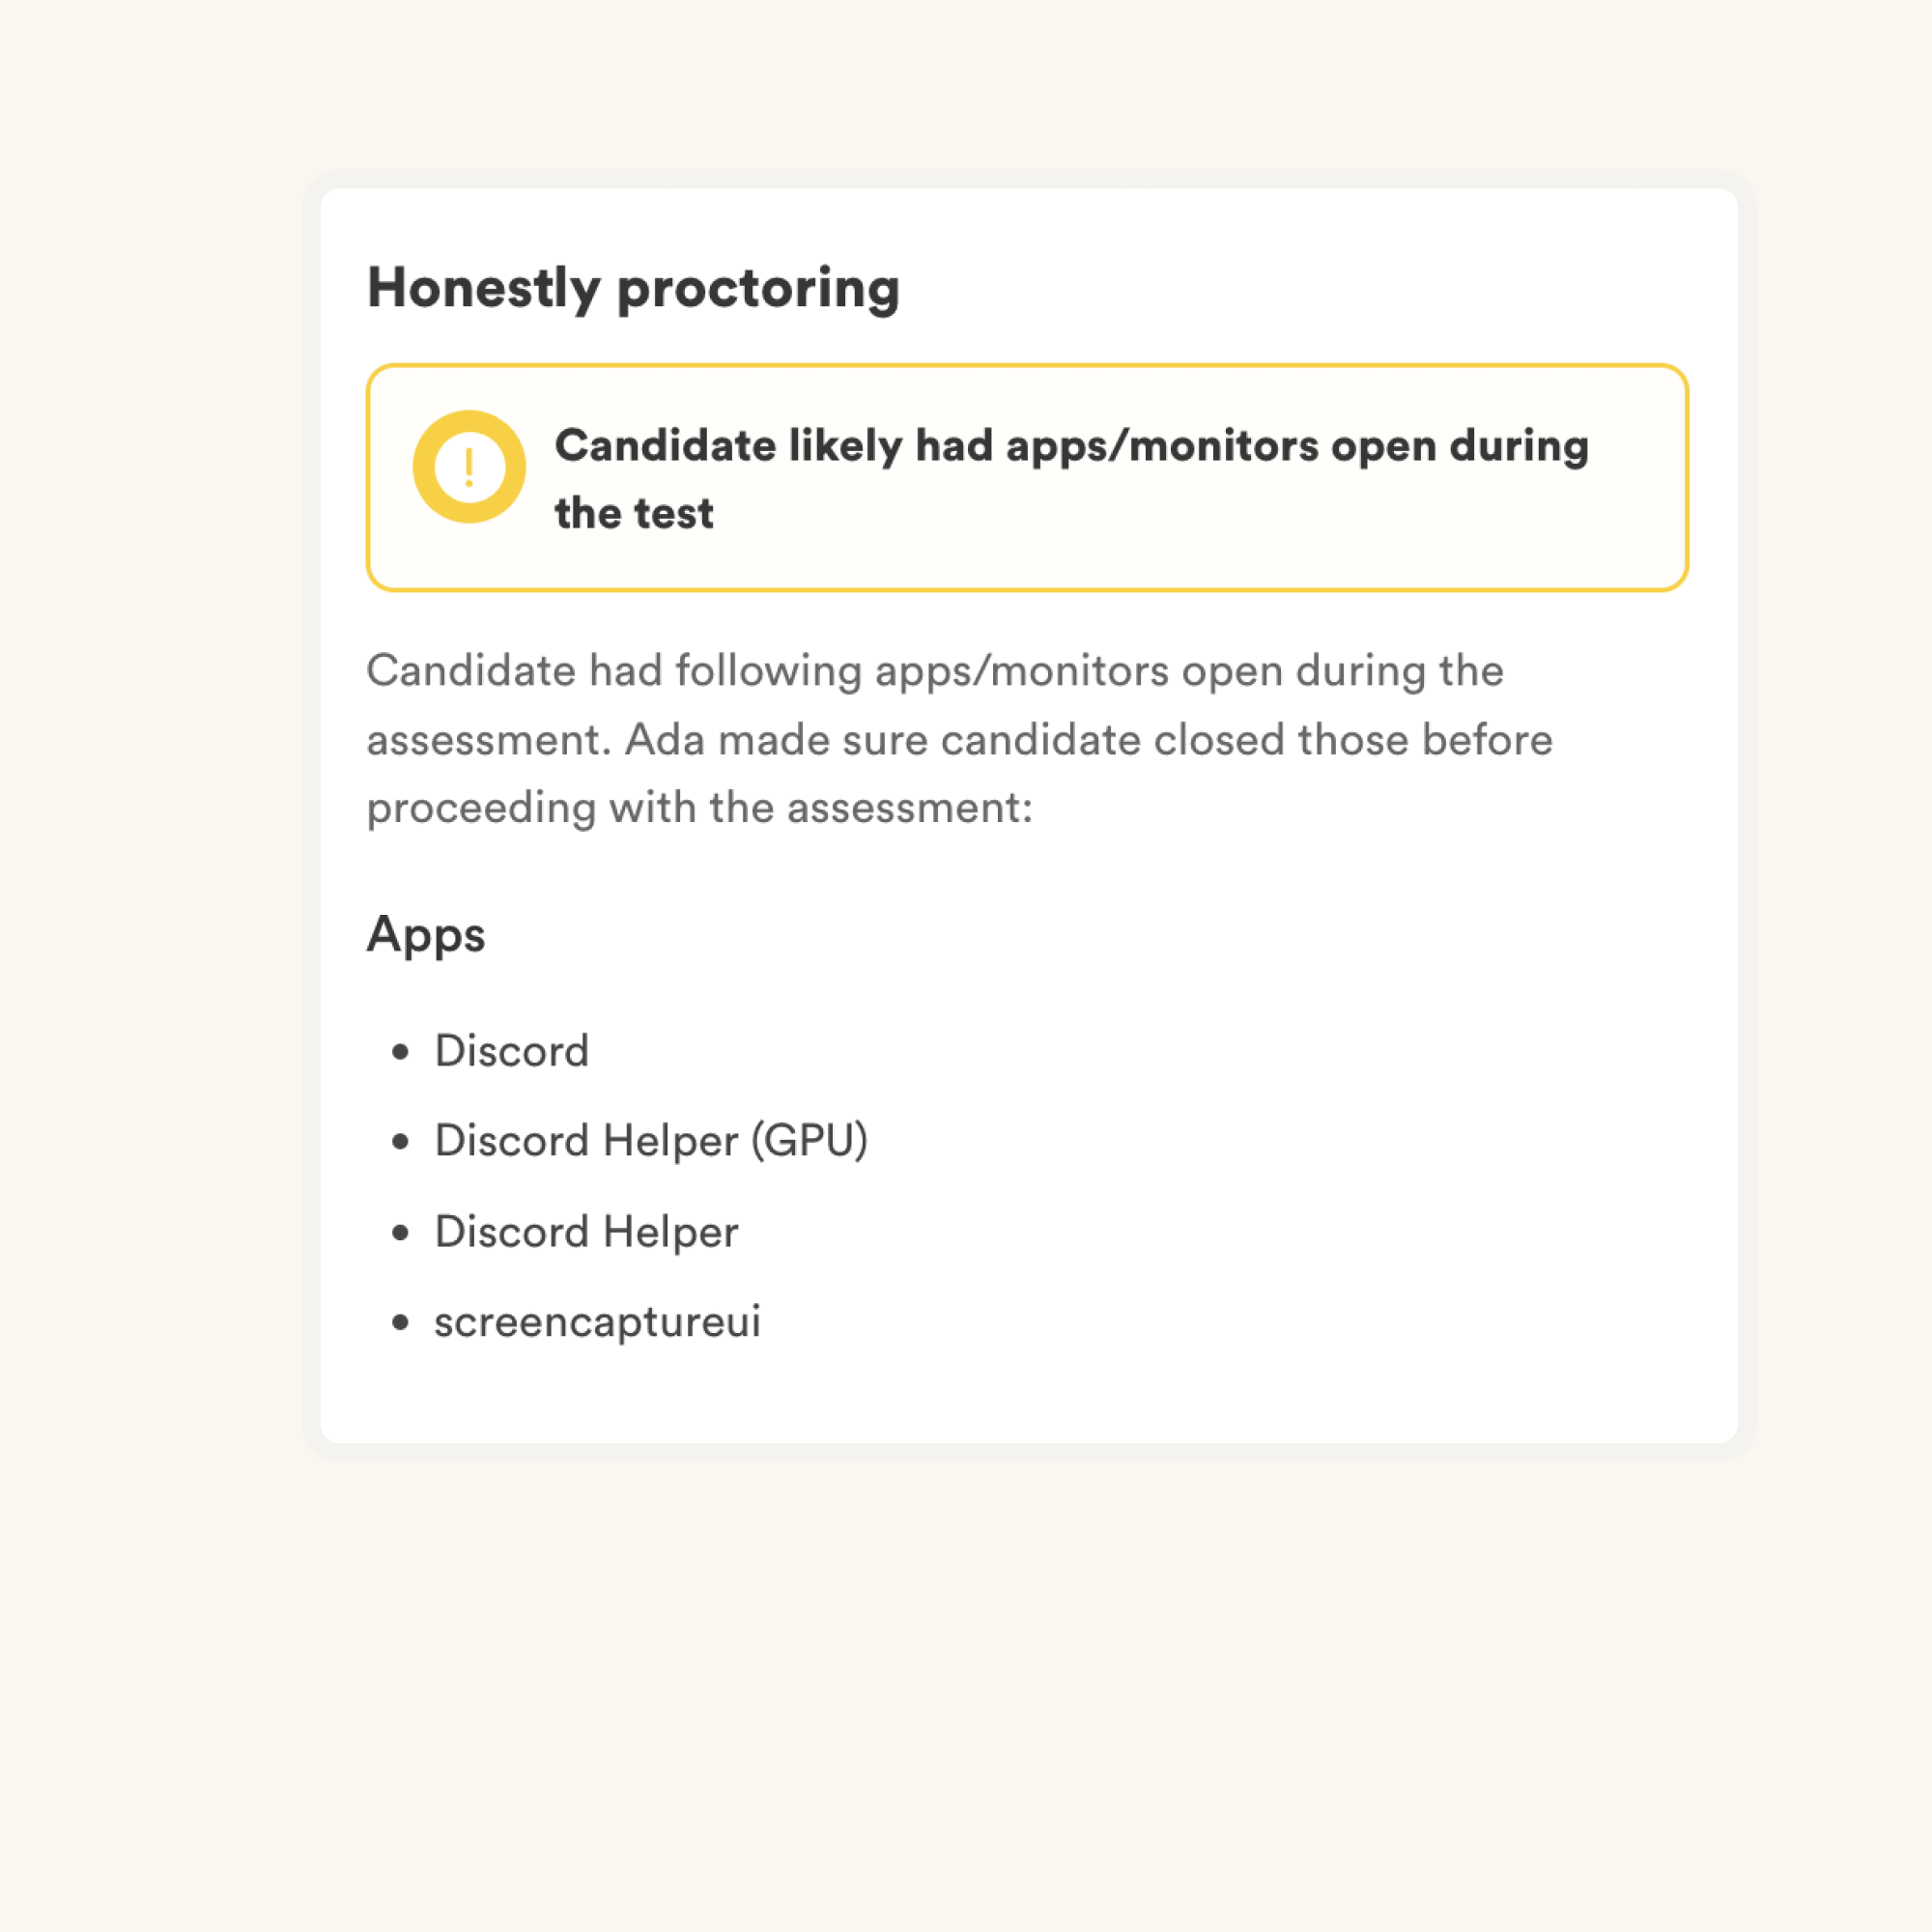
Non-googleable questions & proctoring features enable you to be comfortable with conducting assessments online. The BI utviklertest is ideal for helping recruiters identify which candidates have the skills to do well on the job.

Reason #2

No trick questions

no trick questions

Traditional assessment tools use trick questions and puzzles for the screening, which creates a lot of frustration among candidates about having to go through irrelevant screening assessments.

The main reason we started Adaface is that traditional pre-employment assessment platforms are not a fair way for companies to evaluate candidates. At Adaface, our mission is to help companies find great candidates by assessing on-the-job skills required for a role.

Why we started Adaface ->
Reason #3

Non-googleable questions

We have a very high focus on the quality of questions that test for on-the-job skills. Every question is non-googleable and we have a very high bar for the level of subject matter experts we onboard to create these questions. We have crawlers to check if any of the questions are leaked online. If/ when a question gets leaked, we get an alert. We change the question for you & let you know.

Dette er bare en liten prøve fra biblioteket vårt med 10.000+ spørsmål. De faktiske spørsmålene om dette BI Developer Test vil være ikke-googlable.

🧐 Question

Medium

Default summarization
Data Visualisation
Solve
Review the following table in Power BI:
 image
Here’s the visualisation generated when Book and ReadingChallenges columns are added to a table visualisation:
 image
Why do we see only 4 rows?

Medium

Many-to-one error
Data Modeling
Solve
Consider the following two tables in Power BI:
 image
We received the following error when we tried to set many-to-one cardinality between devices to users tables: “The cardinality you selected isn’t valid for this relationship”. What should we do before creating the many-to-one relationship?

Medium

Power Query Functions
Power Query
Solve
Review the following Microsoft SQL Server table:
 image
Complete the following Power Query formula used to create a custom column to replace the numbers present in last 11 characters of ISBN with 11 ‘*’. Example ‘978-0-365-51051-4’ is converted to ‘978-0-***-*****-*’
 image
A: Text.Insert
B: Text.Replace
C: Text.Start
D: Text.End

Easy

DAX
Solve
We want to create a DAX formula in Power BI that automatically calculates the previous month number. If month is May, the formula would return 4. We have already created the DAX formula: 
Today Month = MONTH (Sales[Todays Date])
Which of the DAX formulas below would be the right choice next?
A: Previous Month = Sales[Today Month]-1
B: Previous Month = PREVIOUSMONTH(Sales[Today Month])
C: Previous Month = STARTOFMONTH(Sales[Today Month])-1
D: Previous Month = IF (Sales[Today Month] =1, 12,Sales[Today Month]-1) (correct)

Medium

Sample data in Power BI
Power Query
Solve
Consider the following Microsoft SQL Server tables:
 image
Which of the following will enable us to import sample data from Sales table in Power BI Desktop?

A: Query Editor → Filter table by Sale Date
B: Power BI Model → Create a calculated table
C: Query Editor → Create a custom column using sample function
D: Query Editor → Add SELECT statement with WHERE clause on Date

Medium

Calculated Properties
Data Analysis
Solve
Here’s sample data imported into Tableau:
 image
Assume only three rows of data is present in the source. Once the data is imported, we added to new calculated fields:

Measure 1 with the formula: SUM([Profit])/SUM([Sales])
Measure 2 with the formula: SUM([Profit]/[Sales])

If we dragged Profit, Sales, Measure 1 and Measure 2 in the viewer as shown here:
 image
Pick the correct statements regarding columns Measure 1, Measure 2 and the row Grand total:
A: Values of Measure 1 would be 0.08, 0.075 and 0.1
B: Values of Measure 2 would be 0.08, 0.075 and 0.1
C: Values of Measure 1 would be 0.08, 0.769 and 0.08
D: Values of Measure 2 would be 0.08, 0.769 and 0.08
E: Values of Measure 1 would be 0.08, 0.155 and 0.255
F: Values of Measure 2 would be 0.08, 0.155 and 0.255
G: Grand total of Measure 1 would be 0.08
H: Grand total of Measure 2 would be 0.08
I: Grand total of Measure 1 would be 0.255
J: Grand total of Measure 2 would be 0.255

Easy

Change display icon
Solve
What steps would you take to change the following view so that Office Supplies is represented by a different symbol?
 image
A: Click on shapes in the marks area. Then select Office Supplies and the icon of choice and click okay.
B: Right-click on product category, select default properties, and select shape. Then select Office Supplies and the icon of choice and click okay.
C: Right click on the square and select "change shape" from the popup menu. Select the icon of choice and click okay.
D: A, B or C
E: None of these would work

Easy

Pie Chart
Data Analysis
Charts
Solve
We have the following dataset in Tableau:
 image
Which of the following Marks settings will result in following Pie chart?
 image
A: Drag Name to Color
B: Drag Share to Color
C: Drag Name to Label
D: Drag Share to Label
E: Drag Name to Angle
F: Drag Share to Angle
G: Drag Name to Detail

Easy

CSV load data
Solve
Consider the following file:
 image
The file might have incomplete data stored with ! or ?. Which of the following R snippets will load the file completely?
 image

Medium

Dataframe Transform
Solve
Review the following Dataframe 'bazinga':
 image
Which of the following commands would turn it into the Dataframe shown below:
 image
 image

Easy

ZeroDivisionError and IndexError
Exceptions
Solve
What will the following Python code output?
 image

Medium

Session
File Handling
Dictionary
Solve
 image
The function high_sess should compute the highest number of events per session of each user in the database by reading a comma-separated value input file of session data. The result should be returned from the function as a dictionary. The first column of each line in the input file is expected to contain the user’s name represented as a string. The second column is expected to contain an integer representing the events in a session. Here is an example input file:
Tony,10
Stark,12
Black,25
Your program should ignore a non-conforming line like this one.
Stark,3
Widow,6
Widow,14
The resulting return value for this file should be the following dictionary: { 'Stark':12, 'Black':25, 'Tony':10, 'Widow':14 }
What should replace the CODE TO FILL line to complete the function?
 image

Medium

Max Code
Arrays
Solve
Below are code lines to create a Python function. Ignoring indentation, what lines should be used and in what order for the following function to be complete:
 image

Medium

Multi Select
Solve
Consider the following SQL table:
 image
How many rows does the following SQL query return?
 image

Easy

Select & IN
Solve
Consider the following SQL table:
 image
Which of the following SQL queries would return the year when neither a football or cricket winner was chosen?
 image

Medium

With, AVG & SUM
Solve
Consider the following SQL table:
 image
How many tuples does the following query return?
 image

Easy

Registration Queue
Logic
Solve
We want to register students for the next semester. All students have a receipt which shows the amount pending for the previous semester. A positive amount (or zero) represents that the student has paid extra fees, and a negative amount represents that they have pending fees to be paid. The students are in a queue for the registration. We want to arrange the students in a way such that the students who have a positive amount on the receipt get registered first as compared to the students who have a negative amount. We are given a queue in the form of an array containing the pending amount.
For example, if the initial queue is [20, 70, -40, 30, -10], then the final queue will be [20, 70, 30, -40, -10]. Note that the sequence of students should not be changed while arranging them unless required to meet the condition.
⚠️⚠️⚠️ Note:
- The first line of the input is the length of the array. The second line contains all the elements of the array.
- The input is already parsed into an array of "strings" and passed to a function. You will need to convert string to integer/number type inside the function.
- You need to "print" the final result (not return it) to pass the test cases.

For the example discussed above, the input will be:
5
20 70 -40 30 -10

Your code needs to print the following to the standard output:
20 70 30 -40 -10

Medium

Longest Road
logic
hashmaps
Solve
A startup company E-Motors is building driverless automated cars. The car contains a sensor that checks the road quality for the next N meters to decide the optimal speed at which the cars should move. We are given recorded data by the sensor in the form of an array, where each element of the array is the rating given to 1 meter of the road in sequence. 

The rating given by the sensor is from 1 to 100, where 100 represents the road with the best condition, and any rating above 60 is optimal. Find the longest stretch of road in meters that is categorized as optimal by the sensor.

The input is an array of "strings" which needs to be converted from string to integer/number inside the function.

Medium

Visitors Count
Strings
Solve
A manager hires a staff member to keep a record of the number of men, women, and children visiting the museum daily. The staff will note W if any women visit, M for men, and C for children. You need to write code that takes the string that represents the visits and prints the count of men, woman and children. The sequencing should be in decreasing order. 
Example:

Input:
WWMMWWCCC

Expected Output: 
4W3C2M

Explanation: 
‘W’ has the highest count, then ‘C’, then ‘M’. 
⚠️⚠️⚠️ Note:
- The input is already parsed and passed to a function.
- You need to "print" the final result (not return it) to pass the test cases.
- If the input is- “MMW”, then the expected output is "2M1W" since there is no ‘C’.
- If any of them have the same count, the output should follow this order - M, W, C.
🧐 Question🔧 Skill

Medium

Default summarization
Data Visualisation
2 mins
Power BI
Solve

Medium

Many-to-one error
Data Modeling
2 mins
Power BI
Solve

Medium

Power Query Functions
Power Query
2 mins
Power BI
Solve

Easy

DAX
3 mins
Power BI
Solve

Medium

Sample data in Power BI
Power Query
2 mins
Power BI
Solve

Medium

Calculated Properties
Data Analysis
3 mins
Tableau
Solve

Easy

Change display icon
2 mins
Tableau
Solve

Easy

Pie Chart
Data Analysis
Charts
3 mins
Tableau
Solve

Easy

CSV load data
2 mins
R
Solve

Medium

Dataframe Transform
3 mins
R
Solve

Easy

ZeroDivisionError and IndexError
Exceptions
2 mins
Python
Solve

Medium

Session
File Handling
Dictionary
2 mins
Python
Solve

Medium

Max Code
Arrays
2 mins
Python
Solve

Medium

Multi Select
2 mins
SQL
Solve

Easy

Select & IN
3 mins
SQL
Solve

Medium

With, AVG & SUM
2 mins
SQL
Solve

Easy

Registration Queue
Logic
30 mins
Coding
Solve

Medium

Longest Road
logic
hashmaps
25 mins
Coding
Solve

Medium

Visitors Count
Strings
30 mins
Coding
Solve
🧐 Question🔧 Skill💪 Difficulty⌛ Time
Default summarization
Data Visualisation
Power BI
Medium2 mins
Solve
Many-to-one error
Data Modeling
Power BI
Medium2 mins
Solve
Power Query Functions
Power Query
Power BI
Medium2 mins
Solve
DAX
Power BI
Easy3 mins
Solve
Sample data in Power BI
Power Query
Power BI
Medium2 mins
Solve
Calculated Properties
Data Analysis
Tableau
Medium3 mins
Solve
Change display icon
Tableau
Easy2 mins
Solve
Pie Chart
Data Analysis
Charts
Tableau
Easy3 mins
Solve
CSV load data
R
Easy2 mins
Solve
Dataframe Transform
R
Medium3 mins
Solve
ZeroDivisionError and IndexError
Exceptions
Python
Easy2 mins
Solve
Session
File Handling
Dictionary
Python
Medium2 mins
Solve
Max Code
Arrays
Python
Medium2 mins
Solve
Multi Select
SQL
Medium2 mins
Solve
Select & IN
SQL
Easy3 mins
Solve
With, AVG & SUM
SQL
Medium2 mins
Solve
Registration Queue
Logic
Coding
Easy30 minsSolve
Longest Road
logic
hashmaps
Coding
Medium25 minsSolve
Visitors Count
Strings
Coding
Medium30 minsSolve
Reason #4

1200+ customers in 75 countries

customers in 75 countries
Brandon

Med Adaface klarte vi å optimalisere vår første screeningprosess med oppover 75%, og frigjøre dyrebare tid for både ansettelsesledere og vårt talentinnsamlingsteam!


Brandon Lee, Menneskers leder, Love, Bonito

Reason #5

Designed for elimination, not selection

The most important thing while implementing the pre-employment BI Developer Test in your hiring process is that it is an elimination tool, not a selection tool. In other words: you want to use the test to eliminate the candidates who do poorly on the test, not to select the candidates who come out at the top. While they are super valuable, pre-employment tests do not paint the entire picture of a candidate’s abilities, knowledge, and motivations. Multiple easy questions are more predictive of a candidate's ability than fewer hard questions. Harder questions are often "trick" based questions, which do not provide any meaningful signal about the candidate's skillset.

Reason #6

1 click candidate invites

Email invites: You can send candidates an email invite to the BI Developer Test from your dashboard by entering their email address.

Public link: You can create a public link for each test that you can share with candidates.

API or integrations: You can invite candidates directly from your ATS by using our pre-built integrations with popular ATS systems or building a custom integration with your in-house ATS.

invite candidates
Reason #7

Detailed scorecards & comparative results

Reason #8

High completion rate

Adaface tests are conversational, low-stress, and take just 25-40 mins to complete.

This is why Adaface has the highest test-completion rate (86%), which is more than 2x better than traditional assessments.

test completion rate
Reason #9

Advanced Proctoring


What topics are covered in the BI utviklertest?

Power Pivot lar deg importere millioner av rader fra heterogene datakilder til et enkelt Excel -ark.

Power Pivot

Power Query hjelper med å finne, redigere og laste inn eksterne data.

Power Query

Power Map er et Excel-tillegg som gir et kraftig sett med verktøy for å hjelpe oss med å visualisere og få innsikt i store sett med data som har en geokodet komponent.

Strømkart
Datakilde -kontakter
Importer til Power Bi
Laster inn data

For å gjøre grunnleggende beregning og dataanalyse om data i Power Pivot, bruker vi dataanalyseuttrykk (DAX).

Dax
Kraft bi betinget kolonne
Malfiler
Deling av dashbord
Direkte spørring
Visualisere data

Skiver i Power BI er de enkle formene for filtre som spiller en nøkkelrolle i utformingen av tilpassede diagrammer og rapporter om Power BI -skrivebordet.

Skiver
Bokmerker
Datoer

Innholdspakker for tjenester er forhåndsbygde løsninger for populære tjenester.

Innholdspakker
Datavisning
Dataintegrasjon
Filoptimalisering

Power Desktop er et aggregert verktøy for strømforespørsel, strømvisning og Power Pivot.

Power Bi Desktop
Datakilder
Datakontakter
Datatyper
Merker
Utdrag
Sorter og filtre
Handlinger
Bore
Aggregasjoner
Tableau Desktop
Oppsett
Formatering
Distribusjon og publisering
Diagrammer og grafer
Dashboards
Formatering
Tilpassede felt og beregninger
Tableau Server
Dimensjoner og tiltak
Beregninger og lod
Parametere og legender
Analyse med R & Tools
Introduksjon til statistikk
Datamanipulering ved bruk av r
Maskinlæringsteknikker ved bruk av r
Utforskende dataanalyse
Regresjonsanalyse
Grunnleggende om datavitenskap
Strengmanipulering
Vektor
Matrise
Dataramme
CSV
Rmarkdown
Lineær regresjon

En forvirringsmatrise kan brukes til å evaluere nøyaktigheten av modellen som er bygget.

Forvirringsmatrise
Tilfeldig skog
Analyse med R & Tools
pakke
R6 -klasse
Shinyr

Apply-funksjonen gjør at en kan gjøre endringer i inngangen til datarammer og matriser.

Bruk funksjon
Gruppering
Kmeans klynging
hierarkisk gruppering

Rattle er en populær GUI for data mining ved bruk av R.

skrangle
Hvit støymodell

Hovedkomponentanalyse er en metode for reduksjon av dimensjonalitet.

Hovedkomponentanalyse

Initialiser () -funksjonen brukes til å initialisere de private datamedlemmene mens du erklærer objektet.

initialiser ()
evaluate_model ()
Forutsigbar gjennomsnittlig samsvar
Forhåndsbelastede datasett
Neste
Tilpasset funksjon
av()
Faktorvariabel
Radix
R beslutnings tre
Dataimport
Strenger og tall
Strengformatering
Lister, ordbøker, tuples og sett
Samlinger
Funksjoner og lambdas
Dekoratører
omfang
Args/kwargs og standard parameterverdier
Begrepet mutabilitet
Innebygde funksjoner
Feilsøking og feilhåndtering
Type hinting
Moduler og installere biblioteker
Objektorientert programmering
Funksjonell programmering
Lambdas
Dekoratører
Generatorer
Sammensetning og arv
Fil I/O
Databaseinteraksjoner
Enhetstesting
Regex (vanlige uttrykk)
Nettskraping
Algoritmer og datastrukturer
Asynkron programmering
Stenginger
Den relasjonelle modellen
SQL Basics
SQL -funksjoner
Datamodifiseringsspråk
Data -spørringsspråk
Crud
SQL -filtrering / Hvor uttalelse
Underlag
Indekser
3 verdsatt logikk
SQL blir med
Vindusfunksjoner
Datofiltrering og tidsstempler
Samlede funksjoner
Operatørens forrang
REKKEFØLGE ETTER
GRUPPE AV
Top-down design
Bottom-up design
Enhetsforholdsdiagram
Normalisering
Databasetyper
Multi-table Select
Tillatelsesstyring
Sikkerhetskopieringsstrategier
Transaksjoner
Datatyper
Utsikt
Sharding
Replikasjon
Sikkerhetskopier
Vertikal + horisontal skalering
Distribuerte vs sentraliserte databaser
Databasesikkerhet
SQL -injeksjoner
Adgangskontroll
Computer Fundamentals
Brevkoding
Nummerkoding
Erstatning
Koding avkodende gåter
Ikke-verbal resonnement
SQL -konsepter
Forretningsanalyse
Koding avkoding
Programmerings språk
Datamaskinarkitektur
Grunnleggende DBMS -konsepter
Solide prinsipper
Automatiseringssystemer
Beslutningstaking
Ikke-verbal resonnement
Problemløsningstilnærming
Singapore government logo

Ansettelseslederne følte at de gjennom de tekniske spørsmålene de stilte under panelintervjuene, kunne fortelle hvilke kandidater som hadde bedre score, og differensierte med de som ikke scoret også. De er Svært fornøyd med kvaliteten på kandidatene på listen med adaface -screeningen.


85%
Reduksjon i screeningstid

Vanlige spørsmål

Kan jeg kombinere flere ferdigheter til en tilpasset vurdering?

Ja absolutt. Tilpassede vurderinger er satt opp basert på stillingsbeskrivelsen din, og vil inneholde spørsmål om alle må-ha ferdigheter du spesifiserer.

Har du noen anti-juksende eller proktoreringsfunksjoner på plass?

Vi har følgende anti-juksede funksjoner på plass:

  • Ikke-googlable spørsmål
  • IP Proctoring
  • Nettproctoring
  • Webcam Proctoring
  • Deteksjon av plagiering
  • Sikker nettleser

Les mer om Proctoring -funksjonene.

Hvordan tolker jeg testresultater?

Den viktigste tingen å huske på er at en vurdering er et eliminasjonsverktøy, ikke et seleksjonsverktøy. En ferdighetsvurdering er optimalisert for å hjelpe deg med å eliminere kandidater som ikke er teknisk kvalifisert for rollen, det er ikke optimalisert for å hjelpe deg med å finne den beste kandidaten for rollen. Så den ideelle måten å bruke en vurdering på er å bestemme en terskelpoeng (vanligvis 55%, vi hjelper deg med å benchmark) og invitere alle kandidater som scorer over terskelen for de neste rundene med intervjuet.

Hvilken opplevelsesnivå kan jeg bruke denne testen til?

Hver ADAFACE -vurdering er tilpasset din stillingsbeskrivelse/ ideell kandidatperson (våre fageksperter vil velge de riktige spørsmålene for din vurdering fra vårt bibliotek med 10000+ spørsmål). Denne vurderingen kan tilpasses for ethvert opplevelsesnivå.

Får hver kandidat de samme spørsmålene?

Ja, det gjør det mye lettere for deg å sammenligne kandidater. Alternativer for MCQ -spørsmål og rekkefølgen på spørsmål er randomisert. Vi har anti-juksing/proctoring funksjoner på plass. I vår bedriftsplan har vi også muligheten til å lage flere versjoner av den samme vurderingen med spørsmål med lignende vanskelighetsnivåer.

Jeg er en kandidat. Kan jeg prøve en praksisprøve?

Nei. Dessverre støtter vi ikke praksisprøver for øyeblikket. Du kan imidlertid bruke eksemplet spørsmål for praksis.

Hva koster ved å bruke denne testen?

Du kan sjekke ut prisplanene våre.

Kan jeg få en gratis prøveperiode?

Ja, du kan registrere deg gratis og forhåndsvise denne testen.

Jeg flyttet nettopp til en betalt plan. Hvordan kan jeg be om en tilpasset vurdering?

Her er en rask guide om Hvordan be om en tilpasset vurdering på adaface.

customers across world
Join 1200+ companies in 75+ countries.
Prøv det mest kandidatvennlige ferdighetsvurderingsverktøyet i dag.
g2 badges
Ready to use the Adaface BI Developer Test?
snakk med oss
logo
40 min tests.
No trick questions.
Accurate shortlisting.
Vilkår Personvern Trust Guide

🌎 Velg språket ditt

English Norsk Dansk Deutsche Nederlands Svenska Français Español Chinese (简体中文) Italiano Japanese (日本語) Polskie Português Russian (русский)
ada
Ada
● Online
Previous
Score: NA
Next
✖️