
Basic Financial Analyst interview questions
1. Can you describe the main financial statements and what they tell us about a company? Imagine I'm five.
2. Walk me through how you would value a company using different methods.
3. Explain what free cash flow is and why it matters. Keep it simple!
4. What are some common accounting principles and why are they important for consistency?
5. How do you calculate and interpret financial ratios like profitability, liquidity, and solvency?
6. Tell me about a time you used Excel to solve a financial problem. What did you do?
7. What are some key performance indicators (KPIs) you would track for a business and why?
8. Describe your understanding of the time value of money and how it affects investment decisions.
9. How would you explain the concept of depreciation to someone who doesn't know anything about finance?
10. What are the different types of financial risk and how can they be managed?
11. Explain the difference between gross profit and net profit, like I am five.
12. What does working capital mean, and why is it important for a company's daily operations?
13. How do you stay up-to-date with the latest financial news and trends?
14. Describe a time you had to analyze a large dataset and draw meaningful conclusions. What was your approach?
15. What are some limitations of financial statement analysis?
16. How would you handle a situation where you disagree with a senior colleague's financial analysis?
17. Explain the concept of budgeting and forecasting. Why are they important for businesses?
18. What are some common methods for capital budgeting, and how do they help companies make investment decisions?
19. How do you ensure accuracy and attention to detail in your financial analysis?
20. Tell me about a time you had to present financial information to a non-financial audience. How did you tailor your presentation?
21. Describe your experience with financial modeling. What are some best practices you follow?
22. What are some ethical considerations for a financial analyst?
23. How do you prioritize tasks and manage your time effectively when working on multiple projects?
24. Explain what a balance sheet is, like I'm five and never heard about it.
25. What is an income statement? Explain it simply!
26. What is a cash flow statement? Explain in simple terms.
27. Describe a situation where you had to make a quick financial decision under pressure. What factors did you consider?
28. How familiar are you with different accounting software and enterprise resource planning (ERP) systems?
29. What is sensitivity analysis, and when is it useful in financial modeling?
Financial Analyst interview questions for juniors
1. If you had to pick one financial metric to focus on for a struggling company, what would it be and why?
2. Describe a time you had to explain a complex financial concept to someone with no financial background. How did you do it?
3. Imagine our company's revenue suddenly doubles. What are the first three things you'd investigate to understand why?
4. Let's say you discover a significant error in a financial report. What steps would you take to correct it and who would you inform?
5. How do you stay up-to-date with the latest financial news and trends?
6. If you could only use one Excel function for the rest of your career, which one would you choose and why?
7. Our CEO doesn't believe in forecasting. Convince them in one minute why it's crucial for our company.
8. What's the difference between a strong balance sheet and a weak one, in simple terms?
9. Pretend you're explaining the concept of 'present value' to a child. How would you do it?
10. What makes a good financial model great?
11. How do you handle working with large datasets and ensuring accuracy?
12. Describe a time you had to make a financial recommendation based on incomplete information. What did you do?
13. If you were a detective investigating a company's declining profits, where would you start your investigation?
14. What are some red flags you'd look for when analyzing a company's financial statements?
15. Tell me about a time you had to work with a team to solve a financial problem. What was your role?
16. How do you prioritize tasks when you have multiple deadlines and projects?
17. What are some common mistakes people make when interpreting financial data?
18. Explain the concept of 'opportunity cost' in a business context.
19. How would you assess the financial health of a small business?
20. If you had to teach a beginner about the three main financial statements, how would you structure your lesson?
21. How do you ensure your financial analyses are unbiased and objective?
22. Walk me through your thought process when evaluating a potential investment.
23. How does understanding financial statements help in daily life, outside of work?
24. Imagine you have conflicting data from two different sources. How do you reconcile the differences?
25. If our company is considering a major expansion, what key financial factors should we consider?
26. What’s a recent financial news story that caught your attention, and why?
Financial Analyst intermediate interview questions
1. Walk me through a time you had to make a financial forecast with limited data. How did you approach it, and what assumptions did you make?
2. Describe your experience with financial modeling software. What are its strengths and weaknesses?
3. How do you stay up-to-date with current financial trends and regulations?
4. Explain how you would analyze a company's capital structure and its impact on financial risk.
5. Tell me about a time you identified a financial risk and how you mitigated it.
6. Describe a situation where you had to present financial data to a non-financial audience. How did you ensure they understood the information?
7. How do you approach variance analysis, and what are the key metrics you focus on?
8. Explain your understanding of different valuation methods, such as discounted cash flow, precedent transactions, and market multiples. When would you use each?
9. Describe your experience with budgeting and forecasting processes. What are some challenges you've faced, and how did you overcome them?
10. How do you ensure the accuracy and reliability of financial data?
11. Explain how you would perform a sensitivity analysis on a financial model.
12. Tell me about a time you had to work with a cross-functional team to achieve a financial goal. What were the challenges, and how did you collaborate effectively?
13. Describe your experience with financial reporting standards. What are some key differences between GAAP and IFRS?
14. How do you handle conflicting priorities when working on multiple financial projects?
15. Explain how you would analyze a company's working capital management and identify areas for improvement.
16. Tell me about a time you had to make a difficult decision based on financial analysis. What factors did you consider, and what was the outcome?
17. Describe your experience with data visualization tools. How do you use them to communicate financial insights?
18. How do you approach a new financial analysis project? What are the first steps you take?
19. Explain how you would evaluate the financial feasibility of a new investment project.
20. Tell me about a time you had to deal with a financial crisis or unexpected event. How did you respond, and what lessons did you learn?
21. Describe your understanding of key performance indicators (KPIs) and how you use them to track financial performance.
22. How would you advise a company struggling with cash flow problems?
23. Tell me about a time you found an error in financial reporting. What was your approach to solving it?
Financial Analyst interview questions for experienced
1. Describe a time you had to build a financial model from scratch. What were the biggest challenges you faced, and how did you overcome them?
2. How do you stay up-to-date with the latest accounting standards and financial regulations? Can you give a specific example of how this knowledge has benefited your previous employer?
3. Walk me through your experience with different valuation methods (DCF, precedent transactions, market multiples). When would you choose one method over another?
4. Explain a complex financial concept, like discounted cash flow analysis, in simple terms to someone with no financial background.
5. Tell me about a time you identified a significant financial risk for your company. What steps did you take to mitigate that risk?
6. Describe your experience with financial planning and analysis (FP&A) software. What are the pros and cons of different platforms you've used?
7. How do you approach a situation where you disagree with your manager's financial recommendations?
8. What is your experience with budgeting and forecasting? Describe a time you had to adjust a budget due to unforeseen circumstances.
9. Explain your process for analyzing variances between actual results and budgeted figures. What key performance indicators (KPIs) do you focus on?
10. Describe a situation where you used your analytical skills to improve a company's profitability or efficiency.
11. How do you prioritize multiple projects with conflicting deadlines? Give an example of a time you successfully managed a heavy workload.
12. What is your experience with mergers and acquisitions (M&A)? What role have you played in due diligence or post-merger integration?
13. Describe your experience with preparing presentations for senior management or board members. How do you tailor your communication to different audiences?
14. How do you ensure the accuracy and reliability of your financial analysis? What quality control measures do you implement?
15. Tell me about a time you had to work with a cross-functional team to solve a financial problem. How did you facilitate collaboration and communication?
16. What is your understanding of key financial ratios and how they are used to assess a company's financial health?
17. How do you approach analyzing large datasets? What tools and techniques do you use to identify trends and insights?
18. Describe a situation where you had to make a difficult ethical decision related to financial reporting or analysis. What factors did you consider?
19. What is your experience with investment analysis? What factors do you consider when evaluating investment opportunities?
20. How do you think the role of the financial analyst will evolve in the next five years?

Finding the right financial analyst is a challenge, but the interview process doesn't have to be. Understanding the nuances of the role and asking the right questions can significantly improve your hiring decisions. If you're curious about the skill set required, explore this blog post.
This post is your go-to resource, packed with a range of interview questions tailored for financial analyst positions. We cover questions for entry-level, intermediate, and experienced candidates, along with some handy multiple-choice questions.
By using this guide, you can confidently assess candidates, ensuring you find the perfect fit for your team and potentially use pre-employment tests such as those offered by Adaface, to further refine your selection process.
Table of contents
Basic Financial Analyst interview questions
Financial Analyst interview questions for juniors
Financial Analyst intermediate interview questions
Financial Analyst interview questions for experienced
Financial Analyst MCQ
Which Financial Analyst skills should you evaluate during the interview phase?
3 Tips for Using Financial Analyst Interview Questions
Hire the Right Financial Analyst: Skills Tests and Interviews
Download Financial Analyst interview questions template in multiple formats
Basic Financial Analyst interview questions
1. Can you describe the main financial statements and what they tell us about a company? Imagine I'm five.
Imagine a company is like a lemonade stand. The main financial statements are like reports that tell us how well the lemonade stand is doing.
- Income Statement: This is like a report card for the lemonade stand's sales and costs over a specific time (like a day or a month). It shows if the lemonade stand made a profit (more money came in than went out) or a loss.
- Balance Sheet: This is like a snapshot of what the lemonade stand owns (like lemonade, cups, money) and what it owes (like money borrowed from Mom or Dad). It shows the lemonade stand's financial health at a specific moment.
- Cash Flow Statement: This is like a record of all the money that came into and went out of the lemonade stand. It shows how the lemonade stand got its money (from selling lemonade or borrowing) and how it spent its money (on lemons, sugar, or paying back loans).
2. Walk me through how you would value a company using different methods.
To value a company, I'd use a combination of intrinsic and relative valuation methods. Discounted Cash Flow (DCF) is a primary intrinsic method, where I'd project future free cash flows, discount them back to present value using the Weighted Average Cost of Capital (WACC), and add the terminal value to arrive at an enterprise value. I would also use comparable company analysis and precedent transactions (both relative valuation methods). For comparable companies, I'd identify similar businesses and calculate relevant multiples like Price-to-Earnings (P/E), Enterprise Value-to-EBITDA (EV/EBITDA), and Price-to-Sales (P/S), then apply the median or average multiples to the target company's corresponding financial metrics. Precedent transactions involve analyzing past M&A deals in the same industry and applying similar multiples paid in those deals to the target company.
Different methods will result in different values, so triangulation helps. I would consider the strengths and weaknesses of each method, as well as the specific characteristics of the company being valued, to arrive at a reasonable range of values. For instance, DCF is highly sensitive to assumptions about growth rates and discount rates, while comps rely on the availability of truly comparable companies. If a company is pre-revenue, a revenue multiple might be more relevant than an earnings multiple. Ultimately, the best valuation will incorporate insights from all three approaches.
3. Explain what free cash flow is and why it matters. Keep it simple!
Free cash flow (FCF) is the cash a company generates after accounting for cash outflows to support operations and maintain its capital assets. Simply put, it's the cash a company has available to repay debt, pay dividends, buy back stock, or make acquisitions.
It matters because it indicates a company's financial health and its ability to create value for shareholders. A higher FCF generally means the company is more profitable and has more financial flexibility. Investors often look at FCF to assess a company's true earning power, as net income can be manipulated more easily than cash flow.
4. What are some common accounting principles and why are they important for consistency?
Some common accounting principles include the going concern principle (assuming the business will continue operating), the matching principle (matching expenses with revenues), the historical cost principle (recording assets at their original cost), and the revenue recognition principle (recognizing revenue when earned). Also, the accrual accounting principle recognizes revenue when it is earned and expenses when they are incurred, regardless of when cash changes hands.
These principles are important for consistency because they ensure that financial statements are prepared using the same rules and guidelines from period to period. This allows stakeholders to compare financial information over time and make informed decisions. Without consistency, financial data would be unreliable and difficult to interpret, making it harder to assess a company's performance and financial position.
5. How do you calculate and interpret financial ratios like profitability, liquidity, and solvency?
Financial ratios are calculated by dividing one financial statement item by another. Profitability ratios, like gross profit margin (Gross Profit / Revenue) and net profit margin (Net Income / Revenue), measure a company's ability to generate profits from its revenue. A higher margin generally indicates better performance. Liquidity ratios, such as the current ratio (Current Assets / Current Liabilities) and quick ratio ((Current Assets - Inventory) / Current Liabilities), assess a company's ability to meet its short-term obligations. Values above 1 usually suggest a company is liquid, but very high ratios might indicate inefficient use of assets. Solvency ratios, like the debt-to-equity ratio (Total Debt / Total Equity), evaluate a company's ability to meet its long-term obligations. A lower debt-to-equity ratio typically indicates less risk, but optimal levels vary by industry.
6. Tell me about a time you used Excel to solve a financial problem. What did you do?
In my previous role, I was tasked with analyzing rising operational costs. I used Excel to consolidate data from multiple departments' spending reports. I created pivot tables to summarize spending by category (e.g., supplies, travel, marketing) and by department, which quickly revealed that marketing expenses had increased significantly in the last quarter.
To investigate further, I created a scatter plot of marketing spend versus sales revenue over the past two years. This revealed a weak correlation, suggesting the increased spending wasn't directly translating into higher sales. Armed with this data-driven insight, I presented my findings to the finance team, who then worked with the marketing department to optimize their budget allocation and improve ROI.
7. What are some key performance indicators (KPIs) you would track for a business and why?
Some key performance indicators (KPIs) I would track for a business depend heavily on the specific business model, but generally include metrics related to revenue, customer acquisition, and operational efficiency. Examples include:
- Revenue Growth Rate: Measures the percentage increase in revenue over a specific period. It helps assess the overall health and growth trajectory of the business.
- Customer Acquisition Cost (CAC): Calculates the cost of acquiring a new customer. This is crucial for understanding the profitability of marketing and sales efforts.
- Customer Lifetime Value (CLTV): Predicts the total revenue a customer is expected to generate during their relationship with the company. Comparing CLTV to CAC helps determine the long-term profitability of customer relationships.
- Churn Rate: Measures the percentage of customers who stop using a company's product or service during a given period. Lower churn indicates better customer retention.
- Conversion Rate: Measures the percentage of users who complete a desired action, like a purchase. Tracking conversion rate can help optimize the sales process.
8. Describe your understanding of the time value of money and how it affects investment decisions.
The time value of money (TVM) is the concept that money available at the present time is worth more than the same amount in the future due to its potential earning capacity. This is because money can earn interest or appreciate over time, making it more valuable the sooner it is received. Inflation also erodes the purchasing power of money over time, further reinforcing the principle of TVM.
TVM significantly impacts investment decisions. Investors use TVM principles like present value and future value calculations to compare different investment opportunities. By discounting future cash flows back to their present value, investors can determine whether an investment's potential returns justify the initial investment cost. Higher discount rates (reflecting higher risk or opportunity cost) will lower the present value of future cash flows, making an investment less attractive. TVM helps in making rational decisions based on the equivalent value of money across different points in time.
9. How would you explain the concept of depreciation to someone who doesn't know anything about finance?
Imagine you buy a car. As you drive it, it gets older, and its value goes down. Depreciation is like that – it's the way we recognize that assets, like cars, computers, or machinery, lose value over time because they're getting used up, wearing out, or becoming obsolete.
Think of it as spreading the cost of an asset over its useful life. Instead of expensing the entire cost upfront, depreciation allows a business to deduct a portion of the asset's cost each year, reflecting its gradual decline in value and its contribution to generating revenue during that period. It's a non-cash expense, meaning no actual money is leaving the business when depreciation is recorded; it's simply an accounting adjustment.
10. What are the different types of financial risk and how can they be managed?
Financial risk encompasses various potential losses in investments or business ventures. Key types include: Market Risk (losses due to market factors like interest rate changes, recessions, or political instability), Credit Risk (the risk that a borrower will default on their debt obligations), Liquidity Risk (the risk of not being able to convert an asset into cash quickly enough without significant loss), and Operational Risk (losses resulting from inadequate or failed internal processes, people, and systems, or from external events). Each of these can be quantified to some degree using metrics like Value at Risk (VaR) and Expected Shortfall (ES). The risk management process often involves identifying, measuring, monitoring, and controlling these different types of risk.
Risk mitigation strategies vary by risk type. For example, market risk can be managed through diversification, hedging (using derivatives like options or futures), and asset allocation strategies. Credit risk is addressed through credit scoring, collateralization, and credit insurance. Liquidity risk is managed by maintaining sufficient cash reserves and diversifying funding sources. Operational risk requires robust internal controls, business continuity planning, and insurance coverage. Effective risk management is crucial for protecting assets and ensuring the long-term financial health of an organization.
11. Explain the difference between gross profit and net profit, like I am five.
Imagine you're selling lemonade. Gross profit is like how much money you have after you pay for the lemons and sugar. It's the money you have before you pay for other things. Net profit is how much money you really get to keep after you pay for everything, like the cups, the table you set up, and maybe even a little bit for your parents helping you!
So, gross profit is the big number before all the costs, and net profit is the smaller, real number after all the costs are taken away.
12. What does working capital mean, and why is it important for a company's daily operations?
Working capital is the difference between a company's current assets (like cash, accounts receivable, and inventory) and its current liabilities (like accounts payable, salaries payable, and short-term debt). It represents the liquid assets available to a company to fund its day-to-day operations.
It's important because it ensures a company has enough short-term assets to cover its immediate liabilities. Positive working capital indicates a company can pay its short-term obligations and invest in growth. Conversely, negative working capital can signal potential liquidity problems, making it difficult to meet obligations, pay employees or suppliers, and maintain smooth operations.
13. How do you stay up-to-date with the latest financial news and trends?
I stay updated with financial news and trends through a multi-faceted approach. I regularly read reputable financial news outlets like the Wall Street Journal, Financial Times, and Bloomberg. I also follow key economists, analysts, and financial institutions on social media platforms like X and LinkedIn to get diverse perspectives and real-time updates. Furthermore, I subscribe to industry-specific newsletters and reports relevant to my field of interest.
To deepen my understanding, I occasionally listen to financial podcasts and attend webinars. This helps me grasp complex topics and stay informed about emerging trends and technologies impacting the financial landscape. I also leverage tools like Google Alerts to monitor specific companies or keywords related to my industry, ensuring I don't miss crucial developments.
14. Describe a time you had to analyze a large dataset and draw meaningful conclusions. What was your approach?
In my previous role, I analyzed a large dataset of customer transactions to identify patterns of fraudulent activity. My approach began with data cleaning and preprocessing, handling missing values and outliers. I then used exploratory data analysis (EDA) techniques like histograms, scatter plots, and summary statistics to understand the data's distribution and identify potential features related to fraud.
Next, I employed machine learning algorithms, specifically logistic regression and random forests, to build predictive models. I split the data into training and testing sets, trained the models, and evaluated their performance using metrics like precision, recall, and F1-score. The insights from the models, combined with the EDA, helped identify key indicators of fraud, which were then used to improve fraud detection processes and reduce financial losses. For example, a high number of transactions from a single IP address in a short timeframe, combined with specific product purchases, turned out to be a strong indicator. These insights were then translated into alerts and rules within the existing fraud monitoring system.
15. What are some limitations of financial statement analysis?
Financial statement analysis, while powerful, has limitations. It relies on historical data, which may not be indicative of future performance. Accounting policies and estimates can be subjective, leading to potential manipulation or distortion of financial results. Furthermore, it often fails to capture qualitative factors like brand reputation, employee morale, or technological innovation that significantly impact a company's value.
Additionally, comparisons across different companies can be challenging due to variations in accounting standards and industry practices. Economic conditions and industry-specific factors also play a significant role, and analyzing financial statements in isolation without considering these external influences can lead to inaccurate conclusions. Inflation and changing price levels are generally ignored which can lead to misinterpretations.
16. How would you handle a situation where you disagree with a senior colleague's financial analysis?
First, I'd carefully review my colleague's analysis to ensure I fully understand their perspective and methodology. I'd also double-check my own assumptions and calculations to confirm the basis of my disagreement. Then, I would schedule a private conversation to discuss my concerns, focusing on specific data points or assumptions where we diverge. I would present my alternative analysis respectfully, backing up my points with evidence and explaining my reasoning clearly, demonstrating curiosity rather than confrontation.
17. Explain the concept of budgeting and forecasting. Why are they important for businesses?
Budgeting is the process of creating a financial plan for a future period, typically a year. It involves estimating revenues and expenses to determine expected profitability and cash flow. Forecasting, on the other hand, is predicting future financial outcomes based on historical data and market trends; it's more about projecting what will happen, while budgeting is about planning what should happen.
They are crucial for businesses because they provide a roadmap for financial performance, enabling informed decision-making. Budgets help control spending, allocate resources effectively, and measure performance against targets. Forecasts allow businesses to anticipate future challenges and opportunities, adapt strategies proactively, and manage risk. Both are vital for financial stability, growth, and overall business success by enabling effective resource management and strategic planning.
18. What are some common methods for capital budgeting, and how do they help companies make investment decisions?
Common methods for capital budgeting include Net Present Value (NPV), Internal Rate of Return (IRR), Payback Period, and Profitability Index (PI). NPV calculates the present value of expected cash flows minus the initial investment, helping determine if a project adds value. IRR determines the discount rate at which the NPV is zero, indicating the project's rate of return. The Payback Period calculates how long it takes to recover the initial investment. PI is the ratio of the present value of future cash flows to the initial investment.
These methods assist companies in evaluating the financial viability of potential investments. NPV and IRR consider the time value of money, providing a more accurate assessment of profitability. Payback period is a quick and simple method for assessing risk and liquidity. PI helps in ranking projects when capital is limited.
19. How do you ensure accuracy and attention to detail in your financial analysis?
I ensure accuracy and attention to detail in my financial analysis through a combination of rigorous processes and a meticulous approach. First, I double-check all data inputs for errors and inconsistencies, cross-referencing with original sources whenever possible. I utilize tools like spreadsheets and financial software to automate calculations, minimizing the risk of manual calculation errors. Furthermore, I build in checks and balances within my models to validate outputs against expected results and identify potential anomalies. Finally, I review my work multiple times, allowing for fresh perspectives and leveraging peer reviews when appropriate to catch any oversight.
I also maintain detailed documentation of my methodologies and assumptions, ensuring transparency and facilitating independent verification. Regularly updating my knowledge of accounting principles and financial regulations is also crucial to avoid errors due to obsolete or incorrect understanding of the frameworks.
20. Tell me about a time you had to present financial information to a non-financial audience. How did you tailor your presentation?
I once had to present the annual marketing budget and ROI projections to the sales team, most of whom had little financial background. To tailor the presentation, I avoided technical jargon and focused on the 'so what?' for them. Instead of talking about EBITDA or NPV, I translated the budget into specific marketing campaigns that would directly support their sales efforts. I used visuals like charts and graphs to illustrate the projected impact of each campaign on lead generation and sales conversion rates. For example, rather than showing a complex ROI calculation, I showed a graph projecting the increase in qualified leads as a direct result of a particular marketing initiative.
Furthermore, I made the presentation interactive by soliciting their input on which marketing initiatives they believed would be most effective in their territories. This helped them feel invested in the budget and understand how it would benefit them directly. I also provided a one-page handout with key metrics translated into easily digestible takeaways, avoiding any complicated financial formulas. The goal was to make the information accessible and relevant, so they could understand the value of the marketing investments and how it would translate to more sales.
21. Describe your experience with financial modeling. What are some best practices you follow?
I have experience building financial models for forecasting, valuation, and investment analysis. This includes creating models for discounted cash flow analysis (DCF), merger and acquisition (M&A) transactions, and sensitivity analysis. I am proficient in using spreadsheet software like Excel and have also utilized Python with libraries like NumPy, Pandas, and SciPy for more complex modeling tasks, specifically for statistical analysis and simulations. I also have experience with financial modeling software like Capital IQ.
Some best practices I follow include: clearly documenting all assumptions and formulas, separating inputs from calculations, building models that are easy to understand and audit, incorporating sensitivity analysis to assess the impact of key variables, and regularly validating model outputs against historical data. I make sure to stress test model assumptions and results with different scenarios. I also adhere to FAST modeling principles.
22. What are some ethical considerations for a financial analyst?
Ethical considerations for a financial analyst are paramount. Key areas include maintaining objectivity and independence, avoiding conflicts of interest (disclosing any personal investments or relationships that could bias analysis), and ensuring confidentiality of client information. Analysts must also strive for competence, diligently researching and accurately presenting information. Plagiarism and misrepresentation of data are strictly prohibited.
Further ethical issues involve insider trading (using non-public information for personal gain), fair dealing (treating all clients equitably), and responsible use of company resources. Upholding the integrity of the capital markets through transparent and honest practices is a core responsibility.
23. How do you prioritize tasks and manage your time effectively when working on multiple projects?
I prioritize tasks using a combination of urgency and importance, often leveraging frameworks like the Eisenhower Matrix (urgent/important). I maintain a centralized task list, typically in a digital tool like Jira, Trello, or a simple spreadsheet, to track all projects and their associated tasks. I estimate the time required for each task and schedule them into my day, allocating specific blocks of time for focused work, avoiding distractions. I re-evaluate my priorities and schedule regularly, especially when new tasks arise or deadlines shift.
To manage my time effectively, I use techniques such as time blocking, the Pomodoro Technique, and eliminating time-wasting activities. Regular breaks are essential to avoid burnout and maintain focus. Communication is key; I proactively communicate any potential delays or roadblocks to stakeholders and collaborate to find solutions. If a task is blocked by another team/resource then its important to escalate. Prioritizing communication with the stakeholders is extremely important.
24. Explain what a balance sheet is, like I'm five and never heard about it.
Imagine you have a piggy bank. A balance sheet is like a picture that shows everything inside your piggy bank right now. It shows two important things:
- What you own (like the money you saved and toys you can sell) which we call assets. It’s like saying 'I have this much'.
- Where the stuff in your piggy bank came from. Maybe your grandma gave you some money (that's like owing grandma - a liability) and maybe you earned some yourself doing chores (that's like what you own even if you didn't get it from someone). It’s like saying 'I got this from here and here'. So, what you own and how you got it should always be equal! That's why it's called a balance sheet!
25. What is an income statement? Explain it simply!
An income statement, also called a Profit and Loss (P&L) statement, summarizes a company's financial performance over a specific period, like a quarter or a year. Simply put, it shows whether a company made a profit or a loss during that time.
It does this by subtracting the total expenses (like the cost of goods sold, salaries, rent, and other operating costs) from the total revenues (the money earned from sales). The result is the company's net income, which is often referred to as the "bottom line."
26. What is a cash flow statement? Explain in simple terms.
A cash flow statement is like a bank statement for a company. It shows all the money that came in (cash inflows) and all the money that went out (cash outflows) during a specific period. It's split into three main sections:
- Operating Activities: Cash from the company's core business, like selling products or services.
- Investing Activities: Cash from buying or selling long-term assets, like property, plant, and equipment (PP&E).
- Financing Activities: Cash from borrowing money, repaying debt, issuing stock, or paying dividends. Essentially, it helps you understand where the company's cash is coming from and where it's going.
27. Describe a situation where you had to make a quick financial decision under pressure. What factors did you consider?
During a previous role, our department's budget was unexpectedly cut by 15% mid-year. I had to quickly identify areas to reduce spending without impacting critical projects. I considered several factors: 1) Project prioritization: Which projects were most vital to the company's strategic goals and had the highest ROI? 2) Expense analysis: I analyzed all departmental expenses, looking for redundancies, unnecessary subscriptions, and opportunities for negotiation with vendors. 3) Impact assessment: I evaluated the potential impact of each cost-cutting measure on team morale and project timelines.
Ultimately, I recommended postponing a non-critical software upgrade and consolidating several subscriptions. This allowed us to meet the budget reduction target while minimizing disruption to essential operations. Clear communication with the team was crucial to ensure everyone understood the rationale behind the decisions and felt supported.
28. How familiar are you with different accounting software and enterprise resource planning (ERP) systems?
I have experience with several accounting software and ERP systems. My familiarity ranges from basic data entry and report generation to more advanced configuration and customization, depending on the specific system. I've worked with systems such as:
- QuickBooks: Used extensively for general ledger, accounts payable/receivable, and financial reporting.
- SAP: Exposure to modules such as FI/CO (Finance and Controlling) for financial accounting and management reporting.
- NetSuite: Experience with its cloud-based ERP functionalities, including financials, CRM, and supply chain management.
- Xero: Familiar with its online accounting features for small businesses.
My approach is always to quickly learn the nuances of new systems, focusing on understanding the underlying accounting principles and how they are implemented within the software.
29. What is sensitivity analysis, and when is it useful in financial modeling?
Sensitivity analysis is a technique used in financial modeling to understand how changes in the input variables of a model affect the output. It helps determine which variables have the most significant impact on the results, allowing for a better understanding of the model's behavior and the potential risks and opportunities associated with it.
It's particularly useful when dealing with uncertainty in input assumptions. For instance, it can be used to assess the impact of changes in interest rates, sales growth, or discount rates on a project's net present value (NPV). By identifying the most sensitive variables, analysts can focus their efforts on refining those assumptions and developing contingency plans to mitigate potential adverse outcomes. Scenarios analysis is a related concept where several input variables are changed simultaneously to form a particular business environment.
Financial Analyst interview questions for juniors
1. If you had to pick one financial metric to focus on for a struggling company, what would it be and why?
If I had to pick one financial metric for a struggling company, I would focus on cash flow from operations (CFO). CFO directly reflects the company's ability to generate cash from its core business activities. A positive and growing CFO indicates that the business is fundamentally sound and can sustain itself, even if other areas like profitability are currently weak. It's a good indicator if the company can pay its short-term liabilities, debts and grow.
Focusing solely on revenue or net income can be misleading, as these metrics can be manipulated through accounting practices or may not accurately reflect the company's immediate financial health. A healthy CFO is crucial for survival and provides the resources needed to address other issues, such as improving profitability, reducing debt, or investing in growth initiatives.
2. Describe a time you had to explain a complex financial concept to someone with no financial background. How did you do it?
I once had to explain the concept of compound interest to a friend who was intimidated by finance. I avoided jargon like 'annual percentage yield' initially. Instead, I used a simple analogy: Imagine planting a tree. The initial seed is your principal. As the tree grows (interest earned), it produces fruit (more interest). If you replant those fruits (reinvest the interest), you'll have even more trees (more interest) in the future. This exponential growth is essentially compound interest.
To further illustrate, I used a hypothetical savings account example. I showed her how a small initial investment, coupled with consistent contributions and the power of compounding over time, could result in significant savings. I also focused on the why – highlighting how understanding this concept could help her make better financial decisions for her future, specifically in regards to retirement planning and investing. I broke it down step-by-step and patiently answered all her questions, ensuring she felt comfortable with the explanation before moving on.
3. Imagine our company's revenue suddenly doubles. What are the first three things you'd investigate to understand why?
If our company's revenue suddenly doubled, the first three things I'd investigate are:
- Identify the source of the revenue increase: I'd analyze sales data to pinpoint which product(s) or service(s) drove the growth. Was it a new product launch, a specific marketing campaign, or organic growth in existing products? Determining the source is crucial.
- Analyze customer acquisition and retention metrics: Did we acquire significantly more new customers, or did existing customers increase their spending? Understanding changes in customer behavior provides insights into the sustainability of the growth. Look at metrics like Customer Acquisition Cost (CAC) and Customer Lifetime Value (CLTV).
- Assess the impact on operational capacity and profitability: Can our existing infrastructure handle the increased demand? Are we maintaining profit margins, or are costs escalating disproportionately? A revenue increase is only beneficial if it translates to higher profits; assessing capacity is vital.
4. Let's say you discover a significant error in a financial report. What steps would you take to correct it and who would you inform?
If I discovered a significant error in a financial report, my immediate action would be to thoroughly document the error, including its nature, magnitude, and potential impact. I would then verify the error by cross-referencing with source data and relevant documentation. Next, I would correct the error in the appropriate systems and documents, ensuring the correction is accurate and complete.
Regarding communication, I would promptly inform my supervisor or manager, explaining the error and the steps taken to correct it. Depending on the nature and impact of the error, I would also inform relevant stakeholders such as the accounting team, internal audit, or potentially external auditors. Transparency and timely communication are crucial in such situations.
5. How do you stay up-to-date with the latest financial news and trends?
I stay informed about the latest financial news and trends through a combination of sources. These include reputable news outlets like The Wall Street Journal, Financial Times, and Bloomberg (both their website and television channel). I also follow financial analysts and economists on social media platforms like LinkedIn and Twitter for timely insights and commentary.
Furthermore, I subscribe to daily or weekly newsletters from financial institutions and investment firms to get curated information and analysis. I also make it a habit to regularly check reports released by regulatory bodies, such as the SEC or the Federal Reserve, to understand their perspective on the economy.
6. If you could only use one Excel function for the rest of your career, which one would you choose and why?
If I could only use one Excel function for the rest of my career, I would choose INDEX(array, row_num, [column_num]). It is incredibly versatile.
INDEX allows you to retrieve values from a specific location within a range or array. Combined with other functions like MATCH, it can perform lookups as effectively as VLOOKUP or HLOOKUP but with greater flexibility and less susceptibility to errors when columns are inserted or deleted. Its ability to work with both rows and columns makes it much more adaptable than functions tied to searching in one direction only.
7. Our CEO doesn't believe in forecasting. Convince them in one minute why it's crucial for our company.
Forecasting isn't about predicting the future perfectly; it's about reducing uncertainty to make better decisions today. It's like driving with headlights at night - you can't see everything, but you can see enough to avoid obstacles. Without forecasts, we're driving blind.
Specifically, consider these points:
- Resource Allocation: Knowing predicted demand helps optimize inventory, staffing, and capital expenditures, preventing costly shortages or surpluses.
- Financial Planning: Accurate revenue forecasts are essential for budgeting, securing funding, and managing cash flow.
- Strategic Planning: Understanding potential future market trends enables us to proactively adapt our strategies and gain a competitive advantage.
- Risk Management: Forecasting helps identify potential risks (e.g., decreased sales, supply chain disruptions) so we can develop mitigation plans.
8. What's the difference between a strong balance sheet and a weak one, in simple terms?
A strong balance sheet shows a company is financially healthy and stable. It has more assets (what it owns - cash, investments, property) than liabilities (what it owes - debt, accounts payable). It can easily meet its short-term and long-term obligations.
Conversely, a weak balance sheet indicates financial risk. It has more liabilities than assets, or assets that aren't easily converted to cash. This makes it difficult for the company to pay its debts and operate smoothly, potentially leading to financial distress.
9. Pretend you're explaining the concept of 'present value' to a child. How would you do it?
Imagine I promise to give you $10 in one year. Present value is like figuring out how much that promise is really worth to you today. It's not quite $10, because you have to wait a whole year! If you could put some money in a piggy bank and it grows over the year, how much would you need to put in today so that it turns into $10 next year? Maybe you only need to put in $9 today, and the piggy bank makes the other $1. That $9 is the present value – what that future $10 is worth right now.
Think of it like this: would you rather have $9 today, or $10 in one year? If you'd take the $9 now, it means the present value of that future $10 is less than or equal to $9 to you! The longer you have to wait for the money, and the better your piggy bank grows (higher interest rate), the lower the present value is.
10. What makes a good financial model great?
A good financial model becomes great through a combination of accuracy, clarity, and flexibility. It's not just about the formulas being correct; it's about how easily others can understand the model's logic and assumptions. Great models are transparent, with clearly labeled inputs and outputs and well-documented formulas. They also incorporate sensitivity analysis and scenario planning, allowing users to quickly assess the impact of changing assumptions.
Furthermore, a great model is adaptable and maintainable. It's designed in a way that allows for easy updates and modifications as new information becomes available. This means avoiding hardcoding values, using dynamic formulas, and implementing error checks to ensure the model remains reliable over time. The model should tell a clear and concise story that is easy to grasp by end users.
11. How do you handle working with large datasets and ensuring accuracy?
When working with large datasets, I focus on efficiency and accuracy. I leverage tools like Pandas, Dask, or Spark for data manipulation and analysis. I also ensure I'm using appropriate data types to minimize memory usage.
To ensure accuracy, I perform thorough data validation and cleaning. This includes checking for missing values, outliers, and inconsistencies. I use techniques like statistical summaries, data profiling, and cross-validation to identify and address potential issues. For example, I may write pandas code like df.isnull().sum() to find missing values or df.describe() to understand distributions and outliers. I also implement rigorous testing throughout the data pipeline.
12. Describe a time you had to make a financial recommendation based on incomplete information. What did you do?
In my previous role as a financial analyst, I was tasked with recommending an investment strategy for a new client with limited historical financial data. I only had access to their stated income, risk tolerance, and general investment goals. To overcome this, I leveraged industry benchmarks and comparable client profiles. I built several potential scenarios, each with varying levels of risk and return, outlining the potential impact of each on their long-term goals.
I clearly communicated to the client that the recommendations were based on assumptions and that a more tailored strategy could be developed as more information became available. I emphasized the importance of regular check-ins to monitor performance and adjust the strategy as needed. The client appreciated the transparency and felt comfortable proceeding with a moderately conservative approach, which was later refined as their financial picture became clearer.
13. If you were a detective investigating a company's declining profits, where would you start your investigation?
If I were investigating a company's declining profits, I'd start by analyzing the financial statements, particularly the income statement and balance sheet, to identify trends in revenue, expenses, and profitability. I would also examine key performance indicators (KPIs) and compare them to industry benchmarks and historical data.
Next, I'd delve into operational aspects, exploring potential causes such as increased competition, changes in market demand, inefficient processes, rising costs of goods sold, or issues with sales and marketing effectiveness. This might involve interviewing employees, reviewing sales data, and assessing customer feedback.
14. What are some red flags you'd look for when analyzing a company's financial statements?
When analyzing a company's financial statements, several red flags can indicate potential problems. Some key areas to scrutinize include: Unexplained Revenue Growth: Be wary of revenue increases that don't align with industry trends or lack clear justification. Declining Profit Margins: A consistent decrease in profit margins (gross, operating, or net) warrants investigation, possibly signaling pricing pressures, increased costs, or inefficient operations. Increasing Debt Levels: A significant rise in debt, especially if not accompanied by corresponding asset growth or improved profitability, can raise concerns about the company's financial stability.
Other red flags are Changes in Accounting Methods: Frequent or unusual changes in accounting practices may be used to manipulate financial results. High Accounts Receivable: A growing accounts receivable balance relative to sales may indicate difficulty collecting payments or aggressive revenue recognition. Unusual Inventory Buildup: A rapid increase in inventory could suggest obsolescence, reduced demand, or overproduction.
15. Tell me about a time you had to work with a team to solve a financial problem. What was your role?
During my internship at a non-profit, the finance team discovered a significant budget shortfall impacting program funding. My role was to assist in identifying the root cause and proposing solutions. I analyzed expense reports, reconciled bank statements, and created visualizations to highlight spending trends. I discovered a discrepancy in grant allocation and identified several areas where costs were exceeding projections.
I presented my findings to the team, suggesting reallocation of funds from less critical areas and negotiating better rates with vendors. We also implemented stricter budget tracking procedures and improved communication between departments. As a result, we were able to mitigate the shortfall and maintain essential program services without significant disruption.
16. How do you prioritize tasks when you have multiple deadlines and projects?
When faced with multiple deadlines and projects, I prioritize tasks based on a combination of urgency, importance, and impact. I typically start by listing all tasks and deadlines. Then, I evaluate each task based on its deadline, potential impact if delayed, and its overall importance to the project or company goals. I often use a simple prioritization matrix, categorizing tasks as urgent/important, important but not urgent, urgent but not important, and neither urgent nor important.
I focus on tackling urgent and important tasks first. For tasks with similar priorities, I consider factors like effort required (quick wins vs. long projects) and dependencies (tasks blocking others). I regularly re-evaluate my priorities as deadlines shift or new tasks arise, ensuring I'm always working on the most impactful activities. Clear communication with stakeholders about potential delays or reprioritization is also crucial.
17. What are some common mistakes people make when interpreting financial data?
People often make mistakes when interpreting financial data by:
- Ignoring context: Failing to consider the broader economic environment or company-specific events that could influence the numbers.
- Cherry-picking data: Focusing on specific metrics that support a desired conclusion while ignoring contradictory evidence.
- Assuming correlation implies causation: Mistaking a relationship between two variables as proof that one causes the other.
- Over-reliance on ratios: Using ratios in isolation without considering the absolute values or industry benchmarks. For example, a high debt-to-equity ratio might be alarming but normal for specific industries.
- Misunderstanding accounting principles: Not fully grasping how accounting rules can impact reported financial results. This includes understanding depreciation methods or inventory valuation.
- Not understanding limitations of financial statements: Financial statements are a snapshot in time and reliant on estimations. They do not represent future results with certainty.
18. Explain the concept of 'opportunity cost' in a business context.
Opportunity cost is the value of the next best alternative forgone when making a decision. In a business context, it represents the potential benefits a company misses out on when choosing one option over another. For example, if a company invests in Project A, the opportunity cost is the potential profit it could have earned by investing in Project B instead.
Considering opportunity cost is crucial for making informed business decisions. It helps businesses evaluate the true cost of a choice by factoring in what else could have been achieved with the same resources. By explicitly considering opportunity costs, businesses can allocate resources more effectively and maximize their returns.
19. How would you assess the financial health of a small business?
To assess the financial health of a small business, I would analyze key financial statements: the balance sheet, income statement, and cash flow statement. I'd focus on liquidity ratios (current ratio, quick ratio) to see if the business can meet short-term obligations. Profitability ratios (gross profit margin, net profit margin) reveal how efficiently the business generates profits. Debt-to-equity ratio shows leverage, and trends in cash flow indicate its ability to generate cash. Comparing these metrics over time and against industry benchmarks gives a good overall picture.
Specifically, I'd look for red flags like consistently declining revenues, increasing debt, negative cash flow from operations, and low profitability. I would also assess the business's working capital management and its ability to collect receivables and manage inventory efficiently.
20. If you had to teach a beginner about the three main financial statements, how would you structure your lesson?
I would start by explaining that the three main financial statements are like snapshots of a company's financial health. First, the Income Statement shows performance over a period, like a month or a year. Think of it as: Revenue - Expenses = Net Income (or Profit). Second, the Balance Sheet is a snapshot at a specific point in time, showing what the company owns (Assets) and owes (Liabilities), and the owner's stake (Equity). It always follows the equation: Assets = Liabilities + Equity. Finally, the Cash Flow Statement tracks the movement of cash both into and out of the company. It categorizes cash flows into three main activities: Operating, Investing, and Financing. Understanding these three statements provides a comprehensive view of a company's financial performance and position.
I'd emphasize that these statements are interconnected. For example, net income from the income statement flows into the retained earnings section of the balance sheet's equity. Similarly, changes in balance sheet accounts (like accounts receivable) affect the operating activities section of the cash flow statement. I'd then use simple examples to illustrate how transactions affect each statement, reinforcing the basic accounting equation and the flow of information between them.
21. How do you ensure your financial analyses are unbiased and objective?
To ensure unbiased and objective financial analyses, I focus on using verifiable data from reliable sources, clearly documenting all assumptions and methodologies, and applying consistent analytical techniques across different scenarios. I also regularly cross-validate my findings with other data points or third-party research to identify and mitigate any potential biases.
Furthermore, I strive to maintain transparency by explicitly stating any limitations or potential conflicts of interest that might influence the analysis. Objectivity is enhanced by using established frameworks and models, avoiding personal opinions or subjective interpretations, and focusing on the facts and data. Blind data analysis, where I analyze data without knowing the specific outcome, can also be helpful.
22. Walk me through your thought process when evaluating a potential investment.
When evaluating a potential investment, I start by understanding the business model, market opportunity, and competitive landscape. I look for companies with a clear value proposition, a large addressable market, and a sustainable competitive advantage (e.g., strong brand, proprietary technology, network effects). This involves researching the industry, the company's financial statements (revenue, profitability, cash flow), and the management team's experience and track record.
Next, I assess the financial metrics, including growth rates, margins, and return on invested capital. I try to determine a fair valuation using methods like discounted cash flow (DCF) analysis or relative valuation (comparing to peers). I also consider qualitative factors such as management quality, corporate governance, and potential risks (regulatory, technological, economic). Finally, I consider the investment's alignment with my overall portfolio strategy and risk tolerance before making a decision.
23. How does understanding financial statements help in daily life, outside of work?
Understanding financial statements, even at a basic level, can significantly improve daily life outside of work. It allows for better personal financial management by providing insights into where your money is going and how to make informed decisions about budgeting, saving, and investing. For example, knowing how to analyze a simple income statement helps you track your personal income and expenses, enabling you to identify areas where you can cut back on spending or increase savings. Balance sheets principles can guide you in managing your assets (like your home or car) and liabilities (like loans or credit card debt) to achieve a healthy financial position.
Furthermore, understanding financial statements can help you make more informed decisions regarding significant life events. Whether you're considering a mortgage, buying a car, or evaluating investment opportunities, having a foundational understanding of financial principles can empower you to assess risks, evaluate potential returns, and negotiate better terms. It can also protect you from financial scams and predatory lending practices by enabling you to critically analyze the financial implications of various offers and agreements.
24. Imagine you have conflicting data from two different sources. How do you reconcile the differences?
When faced with conflicting data from different sources, I prioritize understanding the origin and reliability of each source. I would first investigate the data collection methods, update frequencies, and potential biases associated with each source. If possible, I'd try to determine which source is considered the 'source of truth' or the more authoritative one for the specific data point in question.
Next, I'd analyze the nature of the discrepancy. Is it a simple difference in units, a timing issue, or a more fundamental disagreement? Depending on the discrepancy, I might apply data transformation or normalization techniques to align the data. If the conflict cannot be resolved programmatically, I would involve stakeholders familiar with both data sources to manually investigate and resolve the discrepancy, documenting the resolution process for future reference. The ultimate goal is to create a single, consistent, and reliable dataset, but it's important to understand the lineage of the data.
25. If our company is considering a major expansion, what key financial factors should we consider?
When considering a major expansion, several key financial factors must be carefully evaluated. These include: Projected Costs, encompassing all capital expenditures, operational expenses, and any unexpected contingencies. Revenue Projections, representing realistic forecasts of increased sales and market share based on thorough market research. Funding Sources, determining how the expansion will be financed, whether through debt, equity, or internal cash flow, and analyzing the associated costs and risks of each option. Return on Investment (ROI), assessing the expected profitability and payback period of the expansion to ensure it aligns with the company's financial goals. Cash Flow Analysis, projecting the impact of the expansion on the company's cash flow, ensuring sufficient liquidity to meet obligations. Risk Assessment, evaluating potential financial risks, such as changes in market conditions, increased competition, or delays in project implementation.
It's also crucial to conduct a sensitivity analysis to understand how changes in key assumptions, such as sales volume or cost of materials, could impact the expansion's financial viability. These factors will provide a holistic view of the financial implications and allow for a more informed decision-making process.
26. What’s a recent financial news story that caught your attention, and why?
A recent financial news story that caught my attention was the continued discussion around inflation and the Federal Reserve's interest rate decisions. It's significant because the Fed's actions directly impact borrowing costs for businesses and consumers, influencing economic growth and investment strategies. Furthermore, understanding the interplay between inflation data, Fed policy, and market reactions is crucial for making informed financial decisions, both personally and professionally.
I find the debate surrounding whether inflation is truly cooling down or if further rate hikes are necessary particularly interesting. The potential for a recession if the Fed overtightens, versus the risk of entrenched inflation if they ease up too soon, presents a challenging balancing act. Monitoring leading economic indicators and expert analysis on this topic provides valuable insights into the overall economic outlook.
Financial Analyst intermediate interview questions
1. Walk me through a time you had to make a financial forecast with limited data. How did you approach it, and what assumptions did you make?
In a previous role, I was tasked with forecasting revenue for a new product launch with very little historical sales data. My approach involved identifying key drivers that could influence sales, such as market size, competitor pricing, and anticipated marketing spend. I started by gathering the limited data available: market research reports providing estimates of overall market size, competitor pricing from publicly available sources, and internal marketing plans outlining projected spending.
Since hard numbers were scarce, I created a sensitivity analysis based on several assumptions. I modeled best-case, worst-case, and most-likely scenarios by varying key assumptions, such as market penetration rate. For instance, I assumed a range for conversion rates on marketing campaigns. This allowed me to present a range of possible outcomes, highlighting the potential upside and downside risks. This approach allowed the business to make a more informed decision with the limited data available, and prioritize where to invest in gathering more data to reduce uncertainty.
2. Describe your experience with financial modeling software. What are its strengths and weaknesses?
I have experience with financial modeling software like Microsoft Excel and specialized tools such as Bloomberg Terminal and FactSet. In Excel, I've built models for forecasting, valuation, and scenario analysis, leveraging its flexibility and wide range of built-in functions. Bloomberg and FactSet provide extensive data and analytics capabilities, which I've used for market research and investment analysis.
Excel's strength lies in its accessibility and customizability, but it can be prone to errors and challenging to audit in complex models. Bloomberg and FactSet offer superior data accuracy and real-time updates, but they can be expensive and have a steeper learning curve compared to Excel. Additionally, I am familiar with using Python with libraries like pandas and numpy for more complex modeling and data analysis tasks, offering a balance between Excel's flexibility and specialized tools' data capabilities.
3. How do you stay up-to-date with current financial trends and regulations?
I stay informed about financial trends and regulations through a combination of methods. I regularly read publications like The Wall Street Journal, Financial Times, and Bloomberg to understand market movements and emerging economic issues. I also follow industry-specific news from sources like Reuters and specialized financial blogs and newsletters. To stay current on regulations, I monitor updates from regulatory bodies such as the SEC, FINRA, and the Federal Reserve.
Furthermore, I actively participate in professional development through webinars, conferences, and online courses focused on finance and compliance. Subscribing to updates from legal firms specializing in financial regulations helps me understand the practical implications of new rules and changes.
4. Explain how you would analyze a company's capital structure and its impact on financial risk.
To analyze a company's capital structure and its impact on financial risk, I would first examine the mix of debt and equity financing. Key ratios include the debt-to-equity ratio, debt-to-asset ratio, and interest coverage ratio. A higher proportion of debt generally increases financial risk due to the fixed obligation of interest payments. The ability to meet these obligations, as reflected in the interest coverage ratio, is critical.
Next, I'd assess the nature of the debt itself, including interest rates (fixed vs. variable), maturity dates, and any restrictive covenants. Higher interest rates and shorter maturities can amplify risk. Variable rate debt exposes the company to interest rate fluctuations. Finally, understanding how the capital structure influences the company's cost of capital and overall profitability is crucial. An optimal capital structure balances the benefits of debt (tax shield) with the increased risk of financial distress.
5. Tell me about a time you identified a financial risk and how you mitigated it.
In my previous role as a project manager, I identified a significant financial risk related to potential cost overruns on a large infrastructure project. The initial budget was based on preliminary estimates, and market volatility in material prices posed a threat. To mitigate this, I implemented a revised procurement strategy focusing on securing long-term contracts with key suppliers, locking in prices for essential materials.
Additionally, I established a rigorous change management process with clearly defined approval workflows and contingency budget allocations for unforeseen expenses. We tracked expenses closely, and any deviations had to have an approval. I also had a backup supplier available as part of the overall plan.
6. Describe a situation where you had to present financial data to a non-financial audience. How did you ensure they understood the information?
I once had to present the quarterly sales performance to the marketing team. They primarily focused on campaign performance and weren't deeply familiar with financial reports. To ensure understanding, I avoided using financial jargon and instead translated the data into metrics they already understood, such as customer acquisition cost and return on ad spend. I used visuals like charts and graphs to illustrate trends, highlighting key takeaways rather than overwhelming them with raw numbers.
I also focused on the 'so what?' for the marketing team, explaining how the sales data impacted their campaigns. For example, if a particular campaign correlated with a spike in sales, I emphasized that connection and suggested potential optimizations. I also allowed time for Q&A to address specific questions and ensure everyone felt comfortable with the information.
7. How do you approach variance analysis, and what are the key metrics you focus on?
My approach to variance analysis involves a systematic comparison of planned (budgeted or standard) performance against actual results. I start by identifying the significant variances, typically those exceeding a pre-defined materiality threshold (e.g., 5% or a specific dollar amount). Then, I investigate the root causes of these variances by analyzing underlying data, interviewing relevant stakeholders, and examining operational processes.
The key metrics I focus on depend on the context but generally include:
- Material price variance: The difference between the actual and standard cost of materials used.
- Material quantity variance: The difference between the actual and standard quantity of materials used.
- Labor rate variance: The difference between the actual and standard labor rate.
- Labor efficiency variance: The difference between the actual and standard labor hours.
- Sales price variance: The difference between the actual and standard selling price.
- Sales volume variance: The difference between the actual and budgeted sales volume.
- Overhead spending variance: The difference between actual and budgeted overhead costs.
- Overhead efficiency variance: The difference between the actual and standard hours used for overhead application.
8. Explain your understanding of different valuation methods, such as discounted cash flow, precedent transactions, and market multiples. When would you use each?
Discounted Cash Flow (DCF) valuation estimates a company's intrinsic value by projecting its future free cash flows and discounting them back to present value using a discount rate (WACC). DCF is most appropriate when a company has predictable cash flows and a stable growth rate. Precedent Transactions analysis involves looking at past transactions of similar companies to determine a valuation multiple (e.g., EV/EBITDA). This method is useful when there are sufficient comparable transactions available. Market Multiples (also known as comparable company analysis or comps) values a company based on the multiples of publicly traded companies that are similar in terms of industry, size, and financial metrics. Common multiples include P/E, EV/EBITDA, and P/Sales. Use market multiples when there are a good number of similar, publicly traded companies.
In short, DCF focuses on intrinsic value, precedent transactions on what buyers have previously paid, and market multiples on relative value compared to peers. Each method has its own strengths and weaknesses, and a comprehensive valuation typically involves using all three approaches to arrive at a range of possible values.
9. Describe your experience with budgeting and forecasting processes. What are some challenges you've faced, and how did you overcome them?
In my previous role, I was heavily involved in the annual budgeting and forecasting processes. This included working with department heads to gather their financial needs, analyzing historical data to identify trends, and developing realistic revenue and expense projections. I used tools like Excel and financial planning software to build and maintain budget models, track performance against targets, and generate reports for management review.
One challenge I faced was dealing with inaccurate or incomplete data from various sources. To overcome this, I implemented a standardized data collection template and established regular communication channels with data providers to clarify any discrepancies. Another challenge was adapting to unexpected market changes that impacted revenue forecasts. I addressed this by developing scenario planning models that allowed us to quickly adjust our budget based on different potential outcomes. We monitored key performance indicators (KPIs) closely and made adjustments as needed, which helped us stay on track despite the uncertainty.
10. How do you ensure the accuracy and reliability of financial data?
Ensuring accuracy and reliability of financial data involves a multi-faceted approach. Data validation checks are crucial, including range checks, data type validation, and consistency checks across different data sources. Regular audits, both automated and manual, help identify discrepancies and errors.
Strong internal controls are essential, encompassing segregation of duties, authorization protocols, and documented processes. Reconciliation of data between systems and with external sources (e.g., bank statements) is vital. Data lineage tracking ensures the origin and transformations of data are known, facilitating traceability and error detection. Additionally, employing robust security measures to protect data from unauthorized access or modification is paramount.
11. Explain how you would perform a sensitivity analysis on a financial model.
Sensitivity analysis on a financial model involves systematically changing input variables to observe the impact on output variables. This helps understand which inputs have the most significant effect on the model's results. A common approach is to select key input variables (e.g., sales growth rate, discount rate) and define a range of plausible values (e.g., +/- 10%). Then, run the model multiple times, each time using a different value within the defined range for each input, recording the resulting changes in key output metrics (e.g., net present value, internal rate of return).
Finally, analyze the results. This could involve creating tornado diagrams to visually represent the sensitivity of the output to each input, or calculating the percentage change in the output for a given percentage change in the input. The goal is to identify the critical assumptions driving the model and to assess the model's robustness under different scenarios. This allows decision makers to better understand the risks and uncertainties associated with the financial model.
12. Tell me about a time you had to work with a cross-functional team to achieve a financial goal. What were the challenges, and how did you collaborate effectively?
In my previous role, we aimed to reduce operational costs by 15% within a quarter. This required collaboration between the Operations, Finance, and Engineering teams. A key challenge was the varying priorities; Operations focused on maintaining service levels, Engineering on long-term infrastructure improvements, and Finance on immediate cost reduction. We addressed this by establishing a shared understanding of the overarching goal and its benefits for each team, and weekly cross-functional meetings.
Specifically, I facilitated discussions to identify areas where Engineering could optimize infrastructure for cost savings without impacting Operations' service level agreements. For example, by implementing automated resource scaling (a coding solution), we reduced cloud computing expenses, tracked diligently by Finance to ensure we were on target. Open communication and a focus on mutual benefit enabled us to exceed our initial target.
13. Describe your experience with financial reporting standards. What are some key differences between GAAP and IFRS?
I have experience applying financial reporting standards, including both GAAP (Generally Accepted Accounting Principles) and IFRS (International Financial Reporting Standards). My experience involves preparing and analyzing financial statements, ensuring compliance with relevant standards, and assisting with audits. This includes understanding revenue recognition, lease accounting, and impairment of assets under both frameworks.
Key differences between GAAP and IFRS include: 1) GAAP is rules-based, providing detailed guidance, whereas IFRS is principles-based, offering broader guidelines and requiring more judgment. 2) Inventory valuation: GAAP allows LIFO (Last-In, First-Out), while IFRS prohibits it. 3) Development costs: IFRS allows capitalization of development costs meeting certain criteria, while GAAP has stricter rules for expensing them. 4) Impairment: IFRS allows for reversal of impairment losses, whereas GAAP generally does not. These are a few of the significant variances.
14. How do you handle conflicting priorities when working on multiple financial projects?
When faced with conflicting priorities in financial projects, I first thoroughly assess the impact of each project's delay. This involves understanding the financial consequences, regulatory deadlines, and stakeholder expectations for each. I then discuss the conflicting priorities with my manager and the relevant project stakeholders to collaboratively determine the most critical tasks based on a clear understanding of business needs.
Next, I aim to find solutions to mitigate the conflicts. This might involve reallocating resources, negotiating adjusted deadlines, or breaking down larger tasks into smaller, more manageable steps. Regular communication and transparency with all parties are essential to ensure everyone is aligned and informed of any changes to the project timelines and deliverables.
15. Explain how you would analyze a company's working capital management and identify areas for improvement.
To analyze a company's working capital management, I'd start by calculating key ratios such as the current ratio, quick ratio, accounts receivable turnover, inventory turnover, and accounts payable turnover. Comparing these ratios to industry benchmarks and the company's historical performance helps identify potential issues. For instance, a declining current ratio might indicate liquidity problems, while a low inventory turnover could suggest excess or obsolete inventory.
Areas for improvement often include optimizing inventory levels through better forecasting and supply chain management, improving collections processes to reduce days sales outstanding (DSO), and negotiating better payment terms with suppliers to extend days payable outstanding (DPO). A thorough review of these areas and the related financial metrics helps to identify specific, actionable recommendations to improve working capital efficiency.
16. Tell me about a time you had to make a difficult decision based on financial analysis. What factors did you consider, and what was the outcome?
In my previous role as a project manager, we faced a situation where a key project was significantly over budget. The financial analysis indicated that continuing the project as planned would result in a substantial loss for the company. We had to decide whether to continue with the project, scale it back significantly, or abandon it altogether.
Factors I considered included: the sunk costs, the potential revenue from the project's completion (even if reduced), the impact on our reputation with the client, and the opportunity cost of allocating resources to this project versus other potential investments. After carefully weighing these factors and presenting a revised plan with reduced scope and costs, we decided to scale back the project. This allowed us to deliver a core set of features, minimize our losses, and maintain a positive relationship with the client, albeit with a slightly delayed timeline.
17. Describe your experience with data visualization tools. How do you use them to communicate financial insights?
I have experience using data visualization tools like Tableau, Power BI, and Google Data Studio to communicate financial insights. I use these tools to create charts, graphs, and dashboards that highlight key trends, variances, and performance indicators in financial data. For example, I might use a line chart to show revenue growth over time, a bar chart to compare expenses across different departments, or a scatter plot to identify correlations between financial metrics.
Specifically, I focus on tailoring the visuals to the audience, using clear and concise labels, and choosing appropriate chart types to effectively convey the financial story. I ensure visualizations are interactive, allowing users to drill down into the data for more detail. I often use calculated fields and custom measures to transform raw data into meaningful insights and include annotations to call out significant events or observations. I'm also familiar with using color palettes effectively to enhance readability and avoid misinterpretations.
18. How do you approach a new financial analysis project? What are the first steps you take?
When starting a new financial analysis project, my first step is to thoroughly understand the project's objectives and the specific questions it aims to answer. This involves meeting with stakeholders to clarify their needs and expectations, defining the scope of the analysis, and identifying the key performance indicators (KPIs) that will be used to measure success. Next, I focus on data collection and validation. This includes identifying the necessary data sources (e.g., financial statements, market data, internal databases), assessing data quality, and implementing data cleaning and preprocessing steps to ensure accuracy and consistency. Only after having a clear understanding of the goals and reliable data can I start performing any calculations and draw any conclusions.
19. Explain how you would evaluate the financial feasibility of a new investment project.
To evaluate the financial feasibility of a new investment project, I'd primarily use several key metrics. First, I would calculate the Net Present Value (NPV), which involves discounting future cash flows back to their present value using a determined discount rate (often the Weighted Average Cost of Capital, WACC). A positive NPV generally indicates a feasible project, as it suggests the project's returns exceed the cost of capital.
Second, I'd assess the Internal Rate of Return (IRR), which is the discount rate that makes the NPV equal to zero. I would compare the IRR to my required rate of return (hurdle rate). If the IRR is higher than the hurdle rate, the project is considered financially viable. Other important considerations are the payback period (how long until the initial investment is recovered) and sensitivity analysis to understand how changes in key assumptions (like sales volume or costs) impact the financial outcome. Finally, a thorough risk assessment, including scenario planning, is crucial to understand potential downsides and mitigate risks.
20. Tell me about a time you had to deal with a financial crisis or unexpected event. How did you respond, and what lessons did you learn?
During my time as treasurer for a student organization, we faced an unexpected budget shortfall due to a miscalculation in projected fundraising revenue. I immediately reviewed our financial records to confirm the discrepancy and identify areas where we could reduce spending. I then organized a meeting with the other officers to transparently communicate the situation and brainstorm solutions. We collectively decided to postpone a less critical event, renegotiate contracts with vendors, and launch a targeted fundraising campaign.
The experience taught me the importance of meticulous financial planning, proactive communication, and collaborative problem-solving. I learned the value of having contingency plans and the necessity of clear and honest communication with stakeholders during times of financial stress. It also reinforced the importance of being adaptable and resourceful when facing unexpected challenges, something I carry with me in my professional life.
21. Describe your understanding of key performance indicators (KPIs) and how you use them to track financial performance.
Key Performance Indicators (KPIs) are measurable values that demonstrate how effectively a company is achieving key business objectives. In a financial context, KPIs help track the financial health and performance of an organization. They are used to monitor progress, identify areas for improvement, and make data-driven decisions.
I use financial KPIs like revenue growth, profit margin, return on investment (ROI), cash flow, and debt-to-equity ratio to track financial performance. I analyze these KPIs to understand trends, identify potential problems, and assess the effectiveness of financial strategies. For example, a declining profit margin might indicate rising costs or pricing issues that need to be addressed. By regularly monitoring and analyzing these KPIs, I can provide insights that help improve financial performance and achieve business goals.
22. How would you advise a company struggling with cash flow problems?
First, immediately focus on increasing cash inflows and decreasing cash outflows. To boost inflows, aggressively pursue outstanding receivables, offer early payment discounts, and explore new revenue streams or untapped markets. Simultaneously, cut outflows by negotiating with suppliers for extended payment terms, reducing discretionary spending (travel, marketing), and postponing non-essential capital expenditures. Selling off underutilized assets can provide a quick cash injection as well.
Second, analyze the root cause of the cash flow problem. Is it a temporary dip in sales, poor inventory management, excessive debt, or inefficient operations? Addressing the underlying issue is crucial for a long-term solution. Consider creating a detailed cash flow forecast to identify future shortfalls and proactively manage resources. If debt is a major contributor, explore options like refinancing or debt consolidation. If operational inefficiencies are present, implement process improvements to reduce costs and improve profitability.
23. Tell me about a time you found an error in financial reporting. What was your approach to solving it?
In a previous role, I discovered a discrepancy in our monthly revenue report. The reported figure was significantly higher than expected based on historical trends and preliminary sales data. My approach was to first verify the data sources used to generate the report. I traced the revenue back to the individual sales transactions in our CRM and compared it against the data in our accounting system.
I quickly identified that a large batch of invoices had been incorrectly categorized, leading to an overstatement of revenue for the month. I promptly notified the relevant team members including the accounting manager and the sales operations lead. We worked together to correct the categorization issue, and I updated the report with the accurate figures. Additionally, we implemented a new validation check within the data pipeline to prevent similar errors from occurring in the future.
Financial Analyst interview questions for experienced
1. Describe a time you had to build a financial model from scratch. What were the biggest challenges you faced, and how did you overcome them?
In a previous role, I was tasked with building a financial model to evaluate the viability of launching a new product line. The biggest challenge was the lack of historical data. Since it was a novel product, I had to rely heavily on market research, competitor analysis, and assumptions about customer adoption rates. To overcome this, I created a sensitivity analysis, running multiple scenarios with varying levels of optimism and pessimism around key assumptions such as market size and market share. This helped me understand the range of potential outcomes and identify the key drivers of profitability.
Another challenge was integrating data from disparate sources, including sales forecasts, cost estimates, and market trends. I addressed this by creating a standardized data input template and using Excel formulas (VLOOKUP, INDEX/MATCH) to pull the relevant information into the model dynamically. I also incorporated data validation to ensure data integrity. Regularly testing and refining the model with feedback from stakeholders also helped ensure accuracy and relevance.
2. How do you stay up-to-date with the latest accounting standards and financial regulations? Can you give a specific example of how this knowledge has benefited your previous employer?
I stay up-to-date with the latest accounting standards and financial regulations through several avenues. I regularly read publications from standard-setting bodies like the FASB and IASB, subscribe to industry newsletters (e.g., Journal of Accountancy, CFO.com), and attend webinars and conferences offered by professional organizations such as the AICPA and IMA. Furthermore, I actively participate in online forums and discussions with other accounting professionals to share knowledge and insights.
For example, in my previous role, I learned about the upcoming changes in lease accounting under ASC 842 well in advance. This allowed me to proactively work with the IT department to implement a new lease accounting software, ensuring a smooth transition and compliance before the effective date. This early adoption minimized disruption to financial reporting and avoided potential penalties for non-compliance, saving the company time and resources.
3. Walk me through your experience with different valuation methods (DCF, precedent transactions, market multiples). When would you choose one method over another?
I have experience with Discounted Cash Flow (DCF), precedent transactions, and market multiples for valuation. DCF involves projecting future free cash flows and discounting them back to their present value using a weighted average cost of capital (WACC). Precedent transactions analysis looks at what similar companies have been acquired for in the past, using transaction multiples like EV/EBITDA or EV/Revenue to value the target company. Market multiples, also known as comparable company analysis (comps), uses trading multiples of similar publicly traded companies to derive a valuation.
The choice of method depends on the situation. DCF is useful when a company has predictable cash flows and a clear business plan, but it can be sensitive to assumptions. Precedent transactions are relevant when there are comparable deals, reflecting what buyers are actually willing to pay, but data may be limited or skewed by deal-specific circumstances. Market multiples are helpful for benchmarking against peers, but they rely on finding truly comparable companies and may reflect market sentiment rather than intrinsic value. Often, a combination of methods provides the most robust valuation.
4. Explain a complex financial concept, like discounted cash flow analysis, in simple terms to someone with no financial background.
Imagine you're deciding whether to buy a lemonade stand. Discounted Cash Flow (DCF) analysis is like figuring out what that lemonade stand is really worth today, based on how much money you think it will make in the future. Since money today is worth more than money tomorrow (because you could invest it and earn interest), we 'discount' those future earnings to their present-day value.
Basically, you estimate how much profit (cash flow) the lemonade stand will generate each year, and then reduce each year's profit by a certain percentage (the discount rate) to reflect that future money is less valuable now. Add up all those discounted cash flows, and that's the estimated present value or worth of the lemonade stand. A higher discount rate means the future cash flows are discounted more heavily, resulting in a lower present value. This helps you decide if the asking price for the lemonade stand is a good deal!
5. Tell me about a time you identified a significant financial risk for your company. What steps did you take to mitigate that risk?
In my previous role at a SaaS company, I noticed a significant increase in customer churn during the first quarter. Analyzing the data, I identified that a large portion of churn was concentrated amongst customers who had signed up for our premium plan but weren't actively using key features. This represented a financial risk due to lost revenue and potential negative impact on future sales.
To mitigate this risk, I collaborated with the customer success and product teams. We implemented a proactive outreach program to engage these at-risk customers, offering personalized onboarding and training sessions focused on the underutilized features. We also provided product feedback to the development team to improve the user experience for those specific features. This resulted in a significant decrease in churn within that customer segment during the subsequent quarter and improved overall customer retention.
6. Describe your experience with financial planning and analysis (FP&A) software. What are the pros and cons of different platforms you've used?
I have experience using several FP&A software platforms, including Adaptive Insights (now Workday Adaptive Planning), Anaplan, and Vena Solutions. Adaptive Insights is user-friendly and excels in cloud-based collaborative planning and reporting, but can be comparatively expensive for smaller organizations. Anaplan is a powerful, highly customizable platform suitable for complex modeling and large enterprises. However, its complexity can lead to a steeper learning curve and require dedicated administrative resources. Vena Solutions leverages Excel's familiar interface, offering a relatively easy transition for finance teams comfortable with spreadsheets, but its reliance on Excel can sometimes lead to version control issues and limitations in handling very large datasets compared to purpose-built FP&A software.
The pros and cons generally boil down to ease of use, scalability, and cost. More user-friendly platforms might lack advanced features, while powerful platforms often come with higher implementation costs and greater complexity. Scalability is crucial, so matching the platform's capabilities to the organization's size and future growth is important. Ultimately, the best platform depends on the specific needs and resources of the company.
7. How do you approach a situation where you disagree with your manager's financial recommendations?
If I disagree with my manager's financial recommendations, my first step is to ensure I fully understand their reasoning and the data supporting their decision. I would then gather my own supporting data and prepare a well-reasoned alternative, highlighting the potential risks and benefits of both approaches.
Next, I would schedule a private meeting to discuss my concerns respectfully and professionally. During the conversation, I'd focus on presenting my alternative with clear, concise explanations and data, while actively listening to their perspective. The goal is to find common ground and collaborate on a solution that is in the best interest of the company, even if it means ultimately supporting my manager's decision after fully understanding the rationale. If the decision goes against my recommendation, I will fully support it while also documenting my concerns appropriately.
8. What is your experience with budgeting and forecasting? Describe a time you had to adjust a budget due to unforeseen circumstances.
I have experience in creating and managing budgets, as well as developing forecasts based on historical data and market trends. My experience includes working with both top-down and bottom-up budgeting approaches. I'm proficient in using spreadsheet software like Excel to build financial models and analyze variances between actual and budgeted figures.
In a previous role, we had to adjust our marketing budget significantly due to an unexpected economic downturn. Initially, we planned a large-scale campaign. However, when sales projections dropped, we had to quickly re-evaluate. I worked with the marketing team to identify areas where we could reduce spending without impacting key initiatives. We prioritized digital marketing channels with higher ROI and negotiated better rates with vendors, successfully reducing the marketing budget by 15% while still achieving revised sales goals. This experience taught me the importance of adaptability and proactive communication during times of uncertainty.
9. Explain your process for analyzing variances between actual results and budgeted figures. What key performance indicators (KPIs) do you focus on?
My process for analyzing variances involves several steps. First, I identify the significant variances, typically those exceeding a predetermined threshold (e.g., 10% or $10,000). Then, I investigate the root causes by collaborating with relevant department managers, reviewing underlying data, and examining any changes in operational processes or market conditions. Finally, I document my findings and recommend corrective actions to improve future performance.
Key performance indicators (KPIs) I focus on depend on the context but generally include: Revenue Variance (actual vs. budgeted sales), Cost of Goods Sold (COGS) Variance (actual vs. budgeted production costs), Gross Profit Margin Variance, Operating Expense Variance (actual vs. budgeted administrative and selling expenses), and specific departmental KPIs like sales conversion rates or manufacturing efficiency metrics.
10. Describe a situation where you used your analytical skills to improve a company's profitability or efficiency.
In my previous role at a marketing agency, we were struggling to meet client ROI targets on a large paid social media campaign. I analyzed the campaign data, looking at ad performance across different demographics, placements, and creative executions. I discovered that a significant portion of the budget was being spent on demographics with low conversion rates and placements that weren't performing well.
Based on this analysis, I recommended reallocating the budget to focus on the higher-performing demographics and placements. I also suggested A/B testing new ad creative to improve engagement. As a result, we saw a 30% increase in conversion rates and a 20% improvement in overall ROI for the campaign, exceeding the client's initial expectations and improving the agency's profitability.
11. How do you prioritize multiple projects with conflicting deadlines? Give an example of a time you successfully managed a heavy workload.
When faced with multiple projects and conflicting deadlines, I prioritize based on a combination of factors: impact/value, urgency, dependencies, and available resources. I first assess the impact each project has on overall business goals. Then, I look at the deadlines and determine which are most urgent. I identify any dependencies between projects, meaning one needs to be completed before another can begin. I also consider resource availability, including my own time and the availability of other team members. If needed, I communicate with stakeholders to negotiate deadlines or re-allocate resources. I make use of tools like task management software and Gantt charts to visualize timelines and dependencies.
In a previous role, I was simultaneously leading the development of a new feature for our main product and responsible for migrating our database to a new server. Both had approaching deadlines. I determined the database migration was more urgent as it impacted all other development. I communicated with the product owner for the new feature, explaining the situation, and we agreed to adjust the feature's release date by one week. I then focused on the database migration, working closely with the infrastructure team. Once the migration was complete, I was able to refocus on the feature development and successfully delivered it within the revised timeline. Regular communication and a clear understanding of priorities were key to my success.
12. What is your experience with mergers and acquisitions (M&A)? What role have you played in due diligence or post-merger integration?
I have experience with mergers and acquisitions (M&A) from both a strategic and operational perspective. I've been involved in due diligence processes, primarily focusing on [mention specific area, e.g., technology infrastructure, data security, customer relationship management systems]. My role has included assessing the target company's [mention specific aspects, e.g., IT systems, data governance policies, customer data quality], identifying potential risks and synergies, and contributing to the overall valuation assessment.
In post-merger integration, I've participated in [mention specific activities, e.g., system integration projects, data migration efforts, process standardization initiatives]. My contributions have included [mention specific tasks, e.g., developing integration plans, executing data cleansing and migration tasks, implementing new workflows]. I understand the importance of aligning technology and processes to achieve the desired business outcomes and have actively contributed to successful integration efforts.
13. Describe your experience with preparing presentations for senior management or board members. How do you tailor your communication to different audiences?
I have experience preparing presentations for senior management and board members, focusing on concise and data-driven communication. I tailor my approach based on the audience's familiarity with the subject matter. For senior management, I emphasize strategic implications, key performance indicators (KPIs), and actionable recommendations. For board members, I provide a higher-level overview, focusing on risk assessment, financial performance, and alignment with the overall company strategy. I use visuals (charts, graphs) extensively to convey complex information quickly.
To tailor my communication, I first research the audience's background and interests. I then structure the presentation to address their specific concerns and decision-making needs. I avoid technical jargon unless necessary and always provide context for any acronyms or industry-specific terms. I anticipate questions and prepare answers in advance. Finally, I practice my delivery to ensure a confident and professional presentation.
14. How do you ensure the accuracy and reliability of your financial analysis? What quality control measures do you implement?
To ensure accuracy and reliability in my financial analysis, I implement several quality control measures. I meticulously verify data inputs from reputable sources, cross-referencing data points where possible to identify and correct discrepancies. I also use automated tools and formulas within spreadsheets judiciously, regularly auditing them to confirm they are functioning as intended and producing correct results. Finally, I document all assumptions clearly and review my analysis with peers or supervisors to gain a fresh perspective and identify potential errors or biases.
Specific measures include:
- Data Validation: Ensuring data integrity through verification against source documents.
- Formula Audits: Regularly checking spreadsheet formulas for accuracy and consistency.
- Peer Review: Seeking feedback from colleagues to identify potential errors or alternative interpretations.
- Sensitivity Analysis: Testing the impact of changing key assumptions on the results.
15. Tell me about a time you had to work with a cross-functional team to solve a financial problem. How did you facilitate collaboration and communication?
In my previous role, we faced a declining revenue trend in a specific product line. This required collaboration between the sales, marketing, product development, and finance teams. My role was to facilitate this collaboration and analyze the financial impact of potential solutions.
I facilitated collaboration by scheduling regular cross-functional meetings with clear agendas, ensuring all teams were represented. We used a shared document to track ideas, action items, and decisions. To facilitate communication, I made sure meeting minutes were distributed promptly and encouraged open dialogue. We also implemented a financial model to project the impact of different solutions, allowing us to objectively evaluate each option and decide on the best course of action, which ultimately involved a combined marketing and product refresh strategy that reversed the declining revenue.
16. What is your understanding of key financial ratios and how they are used to assess a company's financial health?
Key financial ratios are calculations using data from a company's financial statements (balance sheet, income statement, cash flow statement) that provide insights into its performance and financial health. They are used to assess various aspects like profitability, liquidity, solvency, and efficiency.
Some common categories include:
- Liquidity Ratios: (e.g., Current Ratio, Quick Ratio) - Measure a company's ability to meet short-term obligations.
- Profitability Ratios: (e.g., Gross Profit Margin, Net Profit Margin, Return on Equity) - Indicate how well a company generates profits from its revenues and investments.
- Solvency Ratios: (e.g., Debt-to-Equity Ratio, Times Interest Earned) - Evaluate a company's ability to meet its long-term obligations and its level of financial leverage.
- Efficiency Ratios: (e.g., Inventory Turnover, Accounts Receivable Turnover) - Measure how efficiently a company utilizes its assets to generate revenue.
By analyzing these ratios and comparing them to industry benchmarks or historical trends, stakeholders can gain a better understanding of a company's financial strengths and weaknesses, and make informed decisions.
17. How do you approach analyzing large datasets? What tools and techniques do you use to identify trends and insights?
When analyzing large datasets, my approach involves several stages. First, I focus on data cleaning and preprocessing, handling missing values and outliers. Then, I use exploratory data analysis (EDA) techniques to understand the data's distribution and relationships between variables. Tools like Python with libraries such as Pandas, NumPy, and Matplotlib are crucial for this stage.
To identify trends and insights, I leverage statistical methods like regression analysis, time series analysis, and clustering. Visualization tools, including Seaborn and Tableau, help in presenting the findings effectively. Feature engineering and dimensionality reduction techniques such as PCA can be employed to simplify the data and highlight key patterns. For very large datasets, distributed computing frameworks like Spark can be used to scale the analysis. I also consider hypothesis testing and A/B testing where applicable to validate observed trends.
18. Describe a situation where you had to make a difficult ethical decision related to financial reporting or analysis. What factors did you consider?
In a previous role, I was asked by a senior manager to adjust some revenue recognition criteria to accelerate the booking of certain contracts, which would positively impact the quarter's financial results. I believed this adjustment was not in accordance with GAAP and would misrepresent the company's financial performance.
I considered several factors: the potential impact on investors and stakeholders if the financials were misleading, my professional responsibility to maintain ethical standards, and the potential repercussions for me personally if I refused. Ultimately, I discussed my concerns with the manager, explaining my understanding of GAAP and the potential risks of the proposed adjustment. When the manager insisted, I escalated the issue to the CFO and the audit committee, who investigated and ultimately agreed with my assessment. The revenue recognition criteria were not adjusted, and the financials accurately reflected the company's performance. While it was an uncomfortable situation, upholding ethical standards and accurate financial reporting was paramount.
19. What is your experience with investment analysis? What factors do you consider when evaluating investment opportunities?
My experience with investment analysis includes conducting due diligence on potential investments, building financial models to project future performance, and analyzing market trends to identify opportunities. I've used various valuation techniques such as discounted cash flow analysis, comparable company analysis, and precedent transaction analysis.
When evaluating investment opportunities, I consider factors such as: the company's management team and track record, the industry's growth prospects and competitive landscape, the company's financial health (revenue growth, profitability, debt levels), regulatory environment, and overall macroeconomic conditions. Risk assessment is also crucial, which involves understanding potential downside scenarios and assessing the likelihood of success.
20. How do you think the role of the financial analyst will evolve in the next five years?
The role of the financial analyst is poised to evolve significantly in the next five years, driven by technological advancements and increased data availability. We'll likely see greater emphasis on data analysis skills, including proficiency in programming languages like Python or R, and the ability to utilize machine learning techniques for forecasting and risk management. Financial analysts will spend less time on manual data gathering and more time on interpreting insights, building predictive models, and communicating complex financial information to stakeholders.
Furthermore, there will be an increased focus on ESG (Environmental, Social, and Governance) factors in investment decisions. Analysts will need to develop expertise in assessing and integrating ESG risks and opportunities into financial models. Strong communication and presentation skills will remain crucial, as analysts need to effectively convey their findings and recommendations to both technical and non-technical audiences. Overall, the future financial analyst will be a data-driven, tech-savvy professional capable of providing strategic insights and navigating an increasingly complex financial landscape.
Financial Analyst MCQ
Question 1.
A company has a market value of equity of $40 million and a market value of debt of $20 million. The cost of equity is 12% and the cost of debt is 7%. The company's tax rate is 30%. What is the company's Weighted Average Cost of Capital (WACC)?
Options:
Options:
Question 2.
A project requires an initial investment of $500,000 and is expected to generate the following cash flows: Year 1: $150,000, Year 2: $200,000, Year 3: $250,000, and Year 4: $175,000. Assuming a discount rate of 10%, what is the project's Net Present Value (NPV)?
Options:
Options:
Question 3.
A project requires an initial investment of $500,000. It is expected to generate annual cash inflows of $150,000 for the first two years, $200,000 for the next two years, and $100,000 for the final year. What is the payback period for this project?
Options:
Options:
Question 4.
A company is considering a project with the following cash flows:
- Initial Investment: $500,000
- Year 1: $150,000
- Year 2: $200,000
- Year 3: $250,000
- Year 4: $150,000
What is the project's Internal Rate of Return (IRR)?
Options:
Options:
Question 5.
A project requires an initial investment of $500,000 and is expected to generate the following cash flows over the next four years: Year 1: $150,000 Year 2: $200,000 Year 3: $200,000 Year 4: $150,000 Assuming a discount rate of 10%, what is the profitability index (PI) of the project? options:
Options:
Question 6.
A company has fixed costs of $500,000, a selling price of $50 per unit, and variable costs of $30 per unit. If the company sells 40,000 units, what is the Degree of Operating Leverage (DOL)?
Options:
Options:
Question 7.
ABC Corporation has a net profit margin of 8%, a dividend payout ratio of 30%, and a total asset turnover of 1.2. If the company's equity multiplier is 1.5, what is the sustainable growth rate?
Options:
Question 8.
A company sells its product for $50 per unit. The variable cost per unit is $30, and the fixed costs are $100,000. What is the breakeven point in units?
Options:
Options:
Question 9.
A company has total debt of $5,000,000 and total equity of $10,000,000. What is the company's debt-to-equity ratio? options:
Options:
Question 10.
Which of the following formulas accurately calculates Free Cash Flow to Firm (FCFF)? Assume Net Income is available.
Options:
Options:
Question 11.
A company has a market value of equity of $40 million, a market value of debt of $20 million, and a market value of preferred stock of $10 million. The cost of equity is 12%, the cost of debt is 7% (before tax), and the cost of preferred stock is 9%. The company's tax rate is 30%. What is the company's Weighted Average Cost of Capital (WACC)?
Options:
Options:
Question 12.
A company sells 10,000 units of a product annually. The ordering cost is $25 per order, and the carrying cost is $5 per unit per year. What is the Economic Order Quantity (EOQ)?
Options:
Options:
Question 13.
A company has current assets of $2,000,000, current liabilities of $1,000,000, inventory of $500,000, and accounts receivable of $750,000. What is the company's current ratio?
Options:
Question 14.
Using the DuPont analysis, Return on Equity (ROE) can be decomposed into three parts. If a company has a Net Profit Margin of 5%, Total Asset Turnover of 1.5, and an Equity Multiplier of 2, what is the company's ROE?
Options:
Question 15.
A company has earnings per share (EPS) of $5 and its stock is currently trading at $60. What is the company's Price-Earnings (P/E) ratio?
Options:
Options:
Question 16.
A company has a cost of goods sold (COGS) of $5,000,000 and average inventory of $1,000,000. What is the inventory turnover ratio?
Options:
Options:
Question 17.
A company has earnings before interest and taxes (EBIT) of $500,000 and interest expense of $100,000. What is the company's Degree of Financial Leverage (DFL)?
Options:
Question 18.
A company has a Degree of Operating Leverage (DOL) of 2.5 and a Degree of Financial Leverage (DFL) of 1.8. What is the company's Degree of Total Leverage (DTL)?
Options:
Options:
Question 19.
A company has net income of $5 million, depreciation expense of $1 million, capital expenditures of $2 million, an increase in net working capital of $500,000, and debt repayment of $750,000 and new debt issues of $250,000. What is the company's Free Cash Flow to Equity (FCFE)?
Options:
Question 20.
A company has sales of $1,000,000, cost of goods sold of $600,000, operating expenses of $200,000, interest expense of $50,000, and taxes of $30,000. What is the company's net profit margin?
Options:
Question 21.
A company has an average days of inventory of 60 days, average collection period of 30 days, and average payables period of 20 days. What is the company's Cash Conversion Cycle (CCC)?
options:
Options:
Question 22.
A company has 10 million outstanding shares, and the current market price per share is $25. What is the company's market capitalization?
Options:
Question 23.
A company has earnings before interest and taxes (EBIT) of $500,000 and interest expense of $100,000. What is the times interest earned ratio?
Options:
Question 24.
A company reported net income of $5 million and paid $1 million in dividends. What is the dividend payout ratio?
Options:
Question 25.
What is the quick ratio, given current assets of $100,000, inventory of $30,000, and current liabilities of $50,000?
Options:
Which Financial Analyst skills should you evaluate during the interview phase?
While you can't assess everything about a candidate in one interview, focusing on key skills is essential. For Financial Analysts, certain abilities are more important than others. Let's explore these core skills to effectively evaluate candidates.
Financial Modeling
To quickly gauge a candidate's financial modeling skills, consider using an assessment with relevant multiple-choice questions. This helps to filter out candidates who may not have a strong grasp of the basics. If you are looking for one, consider using a test, for example, financial-modeling-test.
You can also evaluate their financial modeling abilities through targeted interview questions. Here's a sample question to assess their understanding:
Describe the key components of a discounted cash flow (DCF) model and how you would use it to value a company.
Look for candidates who can clearly explain the purpose of a DCF model, including the inputs (like cash flow projections and discount rates) and how they impact the final valuation.
Excel Proficiency
A great way to quickly test the excel skills is with a pre-employment assessment. It helps to filter candidates based on their existing Excel knowledge and also determine if they have the necessary skills for the role, you could consider the excel-test.
You can delve deeper into their proficiency with targeted questions.
How would you use Excel to analyze a large dataset and identify trends?
Good candidates will demonstrate the ability to use Excel's tools like pivot tables, charts, and functions to extract meaningful insights from data.
Communication Skills
Assessing communication skills can be done with this interview question.
Explain a complex financial concept (e.g., the impact of interest rates on bond prices) to someone with no finance background.
Assess if they can explain the topic simply and concisely, avoiding jargon and focusing on the key takeaways.
3 Tips for Using Financial Analyst Interview Questions
Before you start putting your interview questions to use, here are some helpful tips to improve your hiring process. These pointers will help you get the most out of your interviews and identify the best candidates for the job.
1. Use Skills Tests Before Interviews
One of the best ways to find top talent is to use skills tests before you even start interviewing. Skills tests help you assess a candidate's abilities and reduce the time spent on candidates who may not have the required skills. This ensures you focus on candidates who truly meet the job requirements.
For Financial Analyst roles, consider tests like our Financial Analyst Test, Financial Modeling Test, and Excel Test. You can also consider using our Accounting Test and Finance Test.
The process is easy. You send the tests to candidates after sourcing and before the interview. Then, you review the results to quickly identify those who have the necessary skills. This process saves time and ensures you’re interviewing the best candidates.
2. Compile and Outline Interview Questions
With limited interview time, selecting the right questions is essential. It's critical to focus on questions that assess the most important skills and knowledge for the role. This approach helps you make the most of your interview time and get the insights you need.
You can also consider questions that assess communication, problem-solving, and analytical skills. You can also include case studies and scenario-based questions to assess their practical application of financial knowledge. For example, questions related to data analysis (from our Data Analysis guide) or questions related to financial accounting (from our Financial Accounting guide) would be useful.
Compile your questions in advance and create a structured interview guide. This ensures consistency across all candidates and helps you stay on track during the interview.
3. Ask Effective Follow-Up Questions
Simply asking prepared questions is not enough to assess a candidate fully. To understand their knowledge and abilities, you must probe deeper with follow-up questions. This will uncover the candidate's actual depth and capabilities.
For example, after asking, "Describe your experience with financial modeling," you might ask, "Can you walk me through a specific modeling scenario you've handled, detailing the assumptions you made and the results you achieved?" This helps you understand their depth of understanding, and how they have applied these skills. You get a better idea of how they approach, analyze and solve problems.
Hire the Right Financial Analyst: Skills Tests and Interviews
Hiring a Financial Analyst? It's important to confirm their skills accurately. The most effective way is by using skill tests. Consider using our specialized tests like the Financial Analyst Test, Financial Modeling Test, and Excel Test to gauge their abilities.
Once you've assessed candidates, use the results to shortlist top applicants for interviews. For more details on how our platform can help, visit our online assessment platform to get started and sign up or explore our test library.
Financial Analyst Test
35 mins | 20 MCQs
The financial analyst test evaluates a candidate’s ability to understand financial statements, calculate and interpret financial indicator ratios and predict future results. This pre-employment test helps recruiters identify candidates with strong accounting and compliance backgrounds.
Try Financial Analyst Test
Download Financial Analyst interview questions template in multiple formats
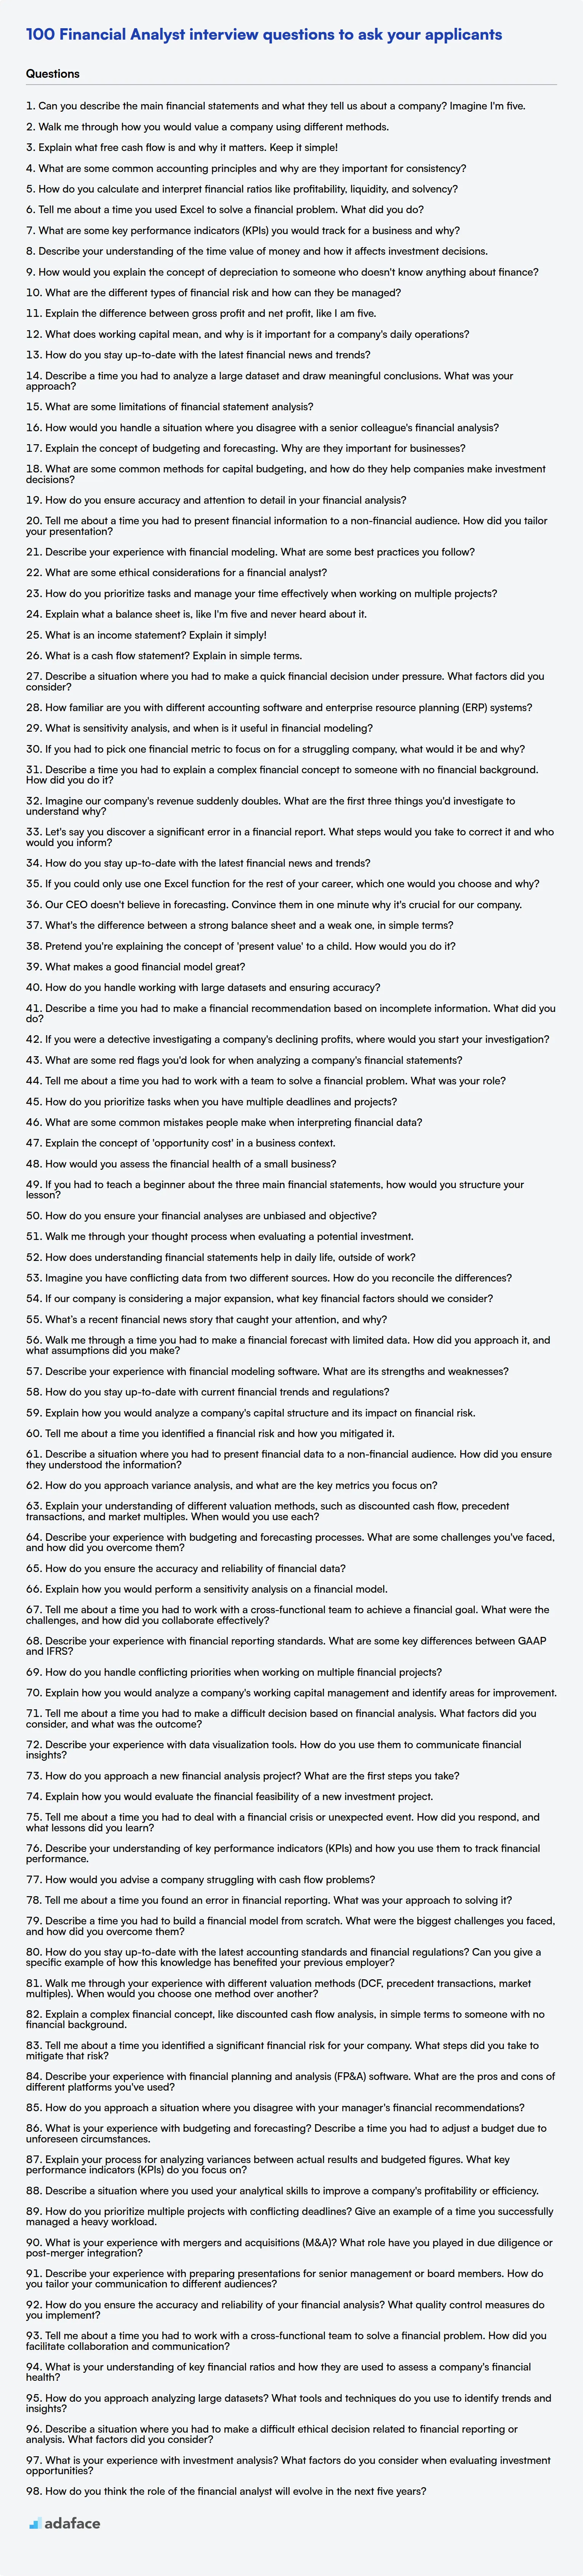
Financial Analyst Interview Questions FAQs
What are the key skills to look for in a Financial Analyst?
Look for strong analytical, communication, and problem-solving skills, along with proficiency in financial modeling and data analysis.
How do I assess a candidate's financial modeling skills?
Ask questions about their experience with financial modeling, and consider a practical exercise to assess their skills.
What types of questions should I ask about experience?
Ask about their experience with budgeting, forecasting, variance analysis, and financial reporting. Also, ask about specific projects.
How can I evaluate a candidate's understanding of financial statements?
Ask questions about the relationship between the income statement, balance sheet, and cash flow statement. Test their ability to analyze and interpret financial data.
What are some common mistakes that candidates make in Financial Analyst interviews?
Candidates may struggle with technical questions, lack of clear communication and not showcasing their analytical skills.
How important is industry knowledge in the hiring process?
Industry knowledge is important, but a candidate's ability to learn and adapt is also key. Tailor questions to the specific role.
40 min skill tests.
No trick questions.
Accurate shortlisting.
We make it easy for you to find the best candidates in your pipeline with a 40 min skills test.
Try for freeRelated posts
Free resources

Join 1200+ companies in 80+ countries.
Try the most candidate friendly skills assessment tool today.

40 min tests.
No trick questions.
Accurate shortlisting.
No trick questions.
Accurate shortlisting.