
D3.js interview questions for freshers
1. Can you explain what D3.js is in simple terms, like you're explaining it to a five-year-old?
2. What are the three core things D3 helps you do with data in the browser?
3. If you have some data and want to show it as a bar chart, what's the first D3 function you might use?
4. Imagine you have a bunch of circles on a screen. How would you use D3 to change their colors all at once?
5. What is a 'selection' in D3, and why is it important?
6. How do you tell D3 to read data from a CSV file?
7. What's the difference between `append()` and `select()` in D3?
8. Explain what a D3 scale is and give an example of when you might use one.
9. How do you make a simple transition using D3 to smoothly change the size of a circle?
10. What does the `.data()` function do in D3?
11. Can you describe a situation where you would use D3's `enter()`, `update()`, and `exit()` selections?
12. How do you add a simple click event to a D3 element?
13. What is the purpose of an axis in D3, and how do you create one?
14. If you wanted to load a JSON file and display the information, how would you do that using D3?
15. Explain how to dynamically update a chart in D3 when the underlying data changes.
16. What are some common chart types you can create with D3.js?
17. How do you chain methods in D3, and why is it useful?
18. What is the difference between `selectAll()` and `select()` when working with D3 elements?
19. Explain how to use D3 to create a simple scatter plot with circles representing data points.
20. How would you handle errors that might occur when loading data in D3?
21. Can you describe how D3 uses the concept of 'data binding' to manipulate DOM elements?
22. What is the role of SVG in D3, and why is it important?
23. How can you create a legend for a D3 chart?
24. Explain how to create a tooltip that appears when you hover over a D3 element.
25. What are some advantages of using D3.js over other charting libraries?
26. How do you add labels to the axes of a D3 chart?
27. How can you use D3 to create an interactive map?
28. Describe how to implement zoom and pan functionality in a D3 chart.
29. What are some ways to optimize the performance of a D3 chart, especially when dealing with large datasets?
30. How do you handle different screen sizes and ensure your D3 visualization is responsive?
D3.js interview questions for juniors
1. Can you describe what D3.js is in simple terms, like you're explaining it to a friend who's never heard of it?
2. What are the basic building blocks of a D3.js visualization?
3. What does SVG stand for, and why is it important in D3.js?
4. How would you create a simple bar chart using D3.js? What are the steps?
5. What is a D3.js selection, and how do you use it to manipulate elements on a webpage?
6. Explain the difference between `append()` and `select()` in D3.js.
7. What are data joins in D3.js, and why are they useful?
8. How do you bind data to elements using D3.js?
9. Can you explain what a scale is in D3.js and why we use it?
10. How would you add axes to a D3.js chart?
11. What is the purpose of using transitions in D3.js?
12. How can you handle user interactions, like clicks or mouseovers, in D3.js?
13. What are some common chart types you can create with D3.js?
14. How do you load data from an external file (like a CSV or JSON file) into D3.js?
15. What is the difference between `enter()`, `update()`, and `exit()` selections in D3.js?
16. How can you update a D3.js visualization with new data?
17. Describe how you might create a scatter plot using D3.js.
18. What are some advantages of using D3.js over other charting libraries?
19. What are some potential challenges you might face when working with D3.js?
20. How do you add labels to your D3.js chart?
21. What is the use of interpolation in D3.js?
D3.js intermediate interview questions
1. How do you implement zooming and panning in a D3.js visualization, and what are some performance considerations when dealing with large datasets?
2. Explain how to create interactive tooltips that display dynamic information when hovering over data points in a D3.js chart.
3. Describe the process of creating reusable components in D3.js and why this is beneficial for large projects.
4. How can you efficiently update a D3.js chart with streaming data or real-time updates?
5. What are some techniques for optimizing D3.js visualizations for mobile devices and touch interactions?
6. Explain how to implement transitions and animations in D3.js to create smooth and engaging data visualizations.
7. How do you handle different data formats (e.g., JSON, CSV, TSV) when loading data into a D3.js visualization?
8. Describe how to create a choropleth map using D3.js and GeoJSON data, including handling map projections.
9. How can you use D3.js to create a force-directed graph visualization, and what are some common customizations?
10. Explain the concept of scales in D3.js and how they are used to map data values to visual properties.
11. Describe how to implement data binding in D3.js using the `data()` and `enter()`, `update()`, `exit()` selections.
12. How do you handle user interactions, such as clicking or dragging, to modify or filter data in a D3.js visualization?
13. What are some common D3.js layout algorithms (e.g., pie, bar, stack) and how do you customize them?
14. Explain how to integrate D3.js with other JavaScript libraries or frameworks (e.g., React, Angular, Vue.js).
15. How do you create and customize axes in D3.js, including handling tick formatting and labels?
16. Describe how to implement data-driven styling in D3.js using CSS and JavaScript to dynamically change visual properties.
17. How can you use D3.js to create a treemap visualization, and what are some best practices for displaying hierarchical data?
18. Explain how to handle missing or invalid data when creating D3.js visualizations, ensuring robustness and clarity.
19. Describe how to create a scatter plot matrix using D3.js to visualize relationships between multiple variables.
20. How do you implement cross-filtering in D3.js, allowing users to interactively explore data across multiple charts?
21. What are some techniques for improving the accessibility of D3.js visualizations for users with disabilities?
22. Explain how to use D3.js to create a calendar view visualization, showing data over time periods.
23. How do you handle large datasets efficiently in D3.js, including techniques like data aggregation and sampling?
24. Describe how to implement brush and zoom interactions in D3.js to allow users to focus on specific regions of a chart.
25. How can you use D3.js to create a network graph visualization, and what are some common layouts for displaying relationships?
26. Explain how to create a parallel coordinates plot using D3.js to visualize high-dimensional data.
27. Describe how to implement custom color scales in D3.js to effectively communicate data insights.
28. How do you use d3-geo for map projections and geographical calculations?
D3.js interview questions for experienced
1. How would you optimize a D3.js visualization for performance when dealing with a very large dataset (e.g., millions of data points)?
2. Describe a scenario where you would choose to use D3.js over other charting libraries like Chart.js or Highcharts.
3. Explain how you would implement interactive features such as tooltips, zooming, and panning in a D3.js visualization.
4. How do you handle transitions and animations in D3.js to create smooth and engaging user experiences?
5. Discuss your approach to testing D3.js visualizations, including unit tests and integration tests.
6. How would you integrate D3.js visualizations into a modern web application framework like React, Angular, or Vue.js?
7. Describe your experience with creating custom D3.js components or reusable charts.
8. Explain how you would use D3.js to create a map-based visualization (e.g., a choropleth map) and handle geographic data.
9. How would you approach debugging performance issues in a complex D3.js visualization?
10. Describe how you have used D3.js to solve a specific data visualization problem in a past project.
11. How do you manage the trade-offs between performance, maintainability, and code complexity when developing D3.js visualizations?
12. Explain the concept of 'enter', 'update', and 'exit' selections in D3.js and how they are used to manage data updates.
13. How would you implement a brush and zoom interaction in D3.js, allowing users to select a region of a chart to zoom in on?
14. Describe your experience with creating accessible D3.js visualizations that meet accessibility standards (e.g., WCAG).
15. How would you handle different data formats (e.g., CSV, JSON, GeoJSON) when loading data into D3.js?
16. Explain how you would use D3.js to create a network graph or force-directed graph visualization.
17. How would you approach styling D3.js visualizations using CSS and avoid conflicts with other styles on the page?
18. Describe your experience with using D3.js modules and plugins to extend the functionality of the library.
19. How would you implement a dashboard using D3.js, including multiple charts and interactive elements?
20. Explain how you would use D3.js to create a treemap visualization and handle hierarchical data.
21. How do you ensure cross-browser compatibility when developing D3.js visualizations?
22. Describe your experience with using D3.js to create visualizations for mobile devices or responsive layouts.
23. How would you handle errors and exceptions in a D3.js visualization and provide informative feedback to the user?
24. Explain how you would use D3.js to create a Sankey diagram visualization and represent flow data.
25. How do you keep up-to-date with the latest developments and best practices in D3.js and data visualization?

In the realm of data visualization, D3.js stands out as a powerful JavaScript library for creating dynamic and interactive graphics. Therefore, identifying candidates with the right D3.js skills is vital for teams aiming to build engaging and data-driven web applications.
This blog post provides a curated list of D3.js interview questions, spanning from fresher to experienced levels, including multiple-choice questions to assist you in evaluating potential candidates. We cover questions for freshers, juniors, intermediate and experienced developers.
By using these questions, you can gauge a candidate's proficiency with D3.js and ensure they possess the skills necessary to excel in your organization; you can also test their D3.js skills before interviews with our D3.js online test.
Table of contents
D3.js interview questions for freshers
D3.js interview questions for juniors
D3.js intermediate interview questions
D3.js interview questions for experienced
D3.js MCQ
Which D3.js skills should you evaluate during the interview phase?
3 Tips for Using D3.js Interview Questions
Hire D3.js Developers with Confidence: Skills Tests and Interview Questions
Download D3.js interview questions template in multiple formats
D3.js interview questions for freshers
1. Can you explain what D3.js is in simple terms, like you're explaining it to a five-year-old?
Imagine you have some LEGO bricks (that's your data!). D3.js is like a special instruction book that helps you build amazing things with those LEGOs on your computer screen. These things could be charts, maps, or even cool interactive drawings.
So, D3.js helps you take boring data and turn it into fun pictures and things you can play with on the web. It uses things like lines, circles and colors to represent the data.
2. What are the three core things D3 helps you do with data in the browser?
D3.js primarily helps you do three core things with data in the browser:
- Bind data to the DOM: D3 allows you to take arbitrary data and associate it with Document Object Model (DOM) elements. This binding forms the foundation for visualizing data.
- Transform the DOM based on data: Once data is bound, D3 provides powerful methods for modifying the DOM based on that data. You can dynamically create, update, or remove elements, change their attributes (e.g., position, size, color), and set their styles. This allows you to create interactive and data-driven visualizations.
- Create transitions and animations: D3 makes it easy to smoothly transition between different states of your visualization. This involves animating changes to attributes and styles, creating a more engaging and informative user experience.
3. If you have some data and want to show it as a bar chart, what's the first D3 function you might use?
The very first D3 function I'd likely use when creating a bar chart is d3.scaleLinear() (or d3.scaleBand() if dealing with ordinal data on the x-axis). A scale is essential for mapping the data values to pixel values within the SVG or other container. Specifically, it helps to define the domain (the range of your data) and the range (the corresponding pixel values on the screen where the bar should be rendered). Without a scale, the bars might be too big, too small, or not properly positioned.
4. Imagine you have a bunch of circles on a screen. How would you use D3 to change their colors all at once?
To change the color of all circles on the screen using D3.js, you would first select all the circle elements. Then you'd use the .style() method to update their fill attribute to the desired color. Here's the code:
d3.selectAll("circle").style("fill", "your_new_color");
Replace your_new_color with the actual color you want, like "red", "#FF0000", or "rgb(255, 0, 0)". The d3.selectAll("circle") selects all elements with the tag name "circle", and .style("fill", ...) applies the new fill color to all selected elements.
5. What is a 'selection' in D3, and why is it important?
In D3.js, a 'selection' is a fundamental concept. It represents a set of Document Object Model (DOM) elements that you want to manipulate. These elements can be of any type (e.g., div, p, svg, circle). Think of a D3 selection as D3's way of providing pointers or references to the DOM elements you intend to work with.
Selections are important because they are the starting point for most D3 operations. You use selections to:
- Select elements: Targeting specific DOM nodes using CSS-style selectors (e.g.,
.myClass,#myId,div). - Manipulate attributes and styles: Modifying the visual appearance of elements. For example, setting the
fillattribute of a circle element toredusing.attr("fill", "red"). - Bind data: Associating data with selected elements. This is crucial for data-driven visualizations, where the data determines the properties and number of visual elements.
- Add or remove elements: Dynamically creating and deleting DOM nodes based on data. For example, creating a
divfor each element in a dataset using.enter().append("div").
6. How do you tell D3 to read data from a CSV file?
D3.js provides the d3.csv() function to read data from a CSV file. This function asynchronously fetches the CSV file and parses its contents. You then use a callback function to access and process the parsed data. The callback function receives the parsed data as an array of objects, where each object represents a row in the CSV file and its properties are based on the column headers.
Here's a simple example:
d3.csv("data.csv").then(function(data) {
  // 'data' is an array of objects
  console.log(data[0]); // Logs the first row of data as an object
}).catch(function(error){
 console.log(error) // catch if there is an error
});
7. What's the difference between `append()` and `select()` in D3?
select() and append() are both fundamental D3.js methods used for manipulating the DOM, but they serve distinct purposes.
select() is used to choose an existing HTML element from the document. You provide a CSS selector, and D3 returns the first element that matches. If no element matches the selector, it returns an empty selection. In contrast, append() adds a new HTML element to the DOM as a child of the selected element. It creates a new node of the specified type (e.g., 'div', 'svg', 'circle') and appends it to the selected element. For example:
d3.select("body").append("div");
This code selects the <body> element and then adds a <div> element to it.
8. Explain what a D3 scale is and give an example of when you might use one.
A D3 scale is a function that transforms values from an input domain to an output range. Essentially, it maps data values to visual representations, such as pixel positions or color intensities. Scales handle the conversion between data units and visual units.
For instance, imagine you want to create a bar chart representing sales figures ranging from 100 to 1000. The chart's width is 500 pixels. You could use a linear scale to map the sales figures (the domain, [100, 1000]) to pixel positions (the range, [0, 500]). This ensures that a sales figure of 100 maps to pixel 0, and a figure of 1000 maps to pixel 500. A figure like 550 would be proportionally mapped to a pixel position somewhere in between. The basic code might look something like:
const xScale = d3.scaleLinear()
  .domain([100, 1000])
  .range([0, 500]);

console.log(xScale(550)); // Output will be around 250
9. How do you make a simple transition using D3 to smoothly change the size of a circle?
To smoothly transition the size of a circle in D3, you can use the .transition() and .attr() methods. First, select the circle element. Then, chain .transition() to initiate a transition. Finally, use .attr("r", newRadius) to define the new radius and animate the change. The duration and easing can be customized using .duration() and .ease() methods, respectively, after the .transition() method.
// Example:
d3.select("circle")
  .transition()
  .duration(500) // milliseconds
  .ease(d3.easeLinear)
  .attr("r", 50); // new radius
10. What does the `.data()` function do in D3?
The .data() function in D3 is used to bind data to selected elements in the DOM. It takes an array of data as input and establishes a relationship between each element in the selection and a corresponding element in the data array. The main purpose is to synchronize visual elements with underlying data.
Specifically, .data() doesn't directly create or modify DOM elements. It just establishes the data binding. You then use .enter(), .exit(), and .update() selections (often chained after .data()) to manipulate the DOM based on the differences between the number of selected elements and the length of the data array. This enables adding new elements for new data points, removing elements for removed data points, and updating existing elements for changed data points.
11. Can you describe a situation where you would use D3's `enter()`, `update()`, and `exit()` selections?
I'd use enter(), update(), and exit() when visualizing data that changes over time, like a dynamically updating bar chart. Imagine new data points are added, existing ones are modified, and old ones are removed.
enter()handles the new data points. It creates new DOM elements for them (e.g., newrectelements for bars), usually with initial attributes.update()handles the data points that already have corresponding DOM elements. It updates the attributes of those existing elements to reflect the new data values (e.g., changing the height and position of the bars).exit()handles the data points that are no longer present in the updated data. It removes the corresponding DOM elements, often with a transition for a smooth visual effect.
12. How do you add a simple click event to a D3 element?
To add a click event to a D3 element, you can use the .on() method. This method allows you to attach event listeners to selected elements.
Here's how you would typically do it:
d3.select("#myElement")
  .on("click", function() {
    // Code to execute when the element is clicked
    console.log("Element clicked!");
  });
In this example, #myElement is the selector for the element you want to attach the click event to. The "click" argument specifies the event type (in this case, a click event). The second argument is a function that will be executed when the element is clicked. Inside this function, you can access the clicked element using this and perform any desired actions.
13. What is the purpose of an axis in D3, and how do you create one?
In D3.js, an axis is a visual representation of a scale, typically used to display data values along a line. Its purpose is to provide context and allow users to easily interpret the data being visualized. An axis usually includes a line, ticks (small lines marking values), and labels (text descriptions of the values).
To create an axis in D3, you first define a scale (e.g., a linear or time scale) that maps data values to pixel positions. Then, you create an axis generator using d3.axisTop(), d3.axisRight(), d3.axisBottom(), or d3.axisLeft(), passing in the scale. Finally, you append a g element to your SVG and call the axis generator on it:
const xScale = d3.scaleLinear().domain([0, 100]).range([0, 500]);
const xAxis = d3.axisBottom(xScale);

svg.append('g')
   .attr('transform', 'translate(0, 300)') // Position the axis
   .call(xAxis);
14. If you wanted to load a JSON file and display the information, how would you do that using D3?
To load and display a JSON file using D3, you'd typically use d3.json() to fetch the data. This function asynchronously loads the JSON data and then executes a callback function that you provide. Inside the callback, you'd manipulate the DOM using D3's selection and data binding capabilities to display the information.
For example, if the JSON data is an array of objects, you might use d3.select('body').selectAll('div').data(data).enter().append('div').text(d => d.propertyName) to create a div for each object in the array and set its text content to a specific property of the object. The specific implementation depends on the structure of your JSON data and how you want to visualize it.
15. Explain how to dynamically update a chart in D3 when the underlying data changes.
To dynamically update a D3 chart when the underlying data changes, you typically re-bind the data to the chart elements and then transition the visual attributes to reflect the new data. First, you need to have a selection of the elements you want to update (e.g., circles, bars). Use .data(newData) to bind the new data. Then, use .join() (or .enter(), .update(), and .exit() if you need more control) to handle entering, updating, and exiting elements based on the data. Finally, use .transition() to smoothly animate the changes to the visual attributes (e.g., position, size, color) of the elements, reflecting the updated data. An important consideration is to use keys in .data(newData, keyFunction) to maintain element identity across data updates, preventing unnecessary element recreation.
For example, consider updating the radius of circles in a scatter plot. After updating the data you can use:
svg.selectAll("circle")
   .data(newData, d => d.id)
   .join(
    enter => enter.append("circle")
      .attr("cx", d => xScale(d.x))
      .attr("cy", d => yScale(d.y))
      .attr("r", 0)
      .transition().duration(500).attr("r", d => radiusScale(d.value)),
    update => update.transition().duration(500).attr("r", d => radiusScale(d.value)),
    exit => exit.transition().duration(500).attr("r", 0).remove()
   );
16. What are some common chart types you can create with D3.js?
D3.js is a powerful library for creating various chart types. Some common ones include:
- Bar charts: Used for comparing categorical data. These can be simple vertical bars, horizontal bars, or grouped/stacked bar charts.
- Line charts: Ideal for visualizing trends over time or continuous data.
- Scatter plots: Display the relationship between two numerical variables. Useful for identifying correlations and clusters.
- Pie charts and Donut charts: Show proportions of a whole.
- Histograms: Display the distribution of numerical data.
- Area charts: Similar to line charts, but the area below the line is filled, emphasizing magnitude. Stacked area charts can show how different groups contribute to the whole.
- Maps: D3 is often used for creating interactive maps, leveraging GeoJSON data.
- Tree diagrams: Visualize hierarchical data structures.
- Force-directed graphs: Show relationships between nodes in a network.
17. How do you chain methods in D3, and why is it useful?
Method chaining in D3 allows you to call multiple methods on the same D3 selection in a concise and readable way. This is achieved because most D3 methods return the selection itself after they've been executed. For example:
d3.select("body").append("p").text("Hello, world!").style("color", "blue");
The usefulness of method chaining lies in its ability to create complex visualizations or manipulations in a single, fluent statement. It enhances code readability and reduces verbosity by avoiding the need to repeatedly select the same element. It makes code cleaner and easier to follow, especially when dealing with multiple attributes and styling operations.
18. What is the difference between `selectAll()` and `select()` when working with D3 elements?
select() and selectAll() are D3 selection methods. select() returns the first element within the selected elements that matches a specified selector. If no element matches, it returns an empty selection. In contrast, selectAll() returns all elements within the selected elements that match the specified selector. If no elements match, it returns an empty selection.
For example, if you have multiple <p> elements in a div, d3.select('div').select('p') would only select the first <p> element inside the div, while d3.select('div').selectAll('p') would select all <p> elements within the div, returning a selection containing all matching elements. select() returns a single selection; selectAll() returns an array-like selection.
19. Explain how to use D3 to create a simple scatter plot with circles representing data points.
To create a scatter plot with D3, first, you need to select an SVG element where the plot will be rendered. Then, load your data (typically an array of objects, each with x and y values). Use D3's data binding to associate the data with circle elements. For each data point, create a circle (.enter().append('circle')) and set its attributes. The key attributes are cx (center x-coordinate), cy (center y-coordinate), and r (radius). Use D3 scales (e.g., d3.scaleLinear()) to map your data values to pixel values within the SVG. For example:
const svg = d3.select('svg');
const data = [{x: 10, y: 20}, {x: 40, y: 60}, {x: 80, y: 90}];

const xScale = d3.scaleLinear().domain([0, 100]).range([0, 300]);
const yScale = d3.scaleLinear().domain([0, 100]).range([300, 0]);

svg.selectAll('circle')
  .data(data)
  .enter().append('circle')
  .attr('cx', d => xScale(d.x))
  .attr('cy', d => yScale(d.y))
  .attr('r', 5);
This code snippet selects the 'svg' element in the DOM, loads sample data, defines linear scales for x and y, and finally, creates and positions the circles based on the scaled x and y coordinates from the data. Don't forget to adjust the domain and range of your scales to match your data and the size of your SVG.
20. How would you handle errors that might occur when loading data in D3?
When loading data in D3, I would implement error handling to gracefully manage potential issues. This involves using the .catch() method after the data loading promise (e.g., d3.csv, d3.json). Inside the .catch() block, I would log the error to the console for debugging and display a user-friendly message on the webpage to inform the user that data loading failed. This prevents the application from crashing and provides informative feedback.
For example:
d3.csv("data.csv")
  .then(function(data) { ... })
  .catch(function(error) {
    console.error("Error loading data:", error);
    // Display an error message on the webpage, e.g., using d3 to select an element and update its text.
    d3.select("#error-message").text("Failed to load data. Please check the data source or try again later.");
  });
I might also implement retry logic or provide an option for the user to manually reload the data, depending on the application's requirements.
21. Can you describe how D3 uses the concept of 'data binding' to manipulate DOM elements?
D3.js uses data binding to connect data to Document Object Model (DOM) elements. This is achieved via the .data() function, which takes an array of data as input. D3 then iterates over this data and attempts to match each data point to existing DOM elements based on a key function (if provided; otherwise, by index).
Based on this matching process, D3 creates three virtual selections: 'enter', 'update', and 'exit'. 'Enter' represents data points that don't have corresponding DOM elements, and D3 allows you to create new DOM elements for them using .enter().append(). 'Update' represents data points that do have corresponding DOM elements, allowing you to modify existing attributes or styles via .attr() or .style(). 'Exit' represents DOM elements that don't have corresponding data points, enabling you to remove them from the DOM using .exit().remove().
22. What is the role of SVG in D3, and why is it important?
SVG (Scalable Vector Graphics) is crucial in D3.js because D3 manipulates the DOM to create visualizations, and SVG elements are the primary building blocks for these visualizations. D3 uses SVG to draw shapes like circles, rectangles, lines, and paths, allowing developers to create complex and interactive graphics in the browser.
SVG's importance stems from its vector-based nature, meaning graphics scale without losing quality. Furthermore, SVG elements are part of the DOM, enabling D3 to bind data to these elements and dynamically update their attributes (e.g., position, size, color) based on the data. This data-driven approach is what makes D3 so powerful for creating dynamic and interactive data visualizations.
23. How can you create a legend for a D3 chart?
Creating a legend in D3 typically involves creating a separate SVG element or a group of elements that visually represents the mapping between colors/symbols and the data categories they represent. This usually requires binding data to the legend elements (e.g., circles or rectangles for color, text for labels) and positioning them appropriately.
Here's a common approach:
- Prepare data: Create an array of objects, each containing the category name and its corresponding color.
- Create SVG elements: Append
svgorgelements to your existing chart SVG to act as the legend container. - Bind data: Use
data()to bind the legend data to elements (e.g.,rectfor colored boxes,textfor labels). - Style and position: Use attributes like
fill,x,y, anddxto style the legend markers and position them usingtransformandtranslateappropriately, for example:legend.append("rect") .attr("x", 0) .attr("y", function(d,i){ return i * 25;}) .attr("width", 20) .attr("height", 20) .style("fill", d => d.color); legend.append("text") .attr("x", 25) .attr("y", function(d,i){ return i * 25 + 14;}) .text(d => d.label);
24. Explain how to create a tooltip that appears when you hover over a D3 element.
To create a tooltip in D3.js, you generally follow these steps:
- Create a tooltip div: Append a
divelement to the body (or another suitable container) with styling to make it look like a tooltip. Initially, hide it using CSS (opacity: 0; pointer-events: none;). This div will hold the tooltip content. - Bind mouseover, mousemove, and mouseout events: Use
.on('mouseover', ...)to show the tooltip (change opacity to 1),.on('mousemove', ...)to update its position based on the mouse coordinates, and.on('mouseout', ...)to hide the tooltip (change opacity back to 0). - Update tooltip content: Within the
mouseoverandmousemoveevent handlers, access the data associated with the hovered element and use it to dynamically update the tooltip's content (e.g., using.html(...)).
For example:
// Create the tooltip div
const tooltip = d3.select("body").append("div")
    .attr("class", "tooltip")
    .style("opacity", 0);

// Bind events to a circle
circle.on("mouseover", function(event, d) {
    tooltip.transition()
        .duration(200)
        .style("opacity", .9);
    tooltip.html("Value: " + d.value) // Replace with your data
        .style("left", (event.pageX) + "px")
        .style("top", (event.pageY - 28) + "px");
})
.on("mousemove", function(event) {
    tooltip.style("left", (event.pageX) + "px")
           .style("top", (event.pageY - 28) + "px");
})
.on("mouseout", function(event, d) {
    tooltip.transition()
        .duration(500)
        .style("opacity", 0);
});
25. What are some advantages of using D3.js over other charting libraries?
D3.js offers several advantages over other charting libraries, primarily its flexibility and control. Unlike many libraries that provide pre-built chart types, D3.js operates at a lower level, allowing you to manipulate the DOM directly and create highly customized visualizations. You're not limited to specific chart types; you can craft exactly what you need. This is achieved through its powerful data binding capabilities, where data is linked directly to DOM elements, enabling dynamic updates and interactions.
Furthermore, D3.js is not solely a charting library; it's a general-purpose tool for manipulating the DOM based on data. This means you can create not just charts, but also interactive maps, network graphs, and other complex visualizations. Other libraries might be easier to get started with for simple charts, but D3.js gives you unparalleled control and customization options when you need them.
26. How do you add labels to the axes of a D3 chart?
To add labels to the axes of a D3 chart, you typically use SVG text elements and position them appropriately relative to the axes. First, create a selection for the labels and append text elements to it.
Then, set the x and y attributes of each text element to position the label, taking into account the axis's position and orientation. You can also use the transform attribute to rotate the label, especially for the y-axis. Finally, set the text content of each label using the .text() method with the desired label text. Remember to adjust the positioning and rotation based on your specific chart's layout.
27. How can you use D3 to create an interactive map?
To create an interactive map with D3.js, you'll typically start with GeoJSON data representing the map's features (countries, states, etc.). D3's d3.geoPath() is then used to convert the GeoJSON geometries into SVG path elements that can be displayed on the page. Projections, like d3.geoMercator() or d3.geoAlbersUsa(), transform the spherical coordinates of the GeoJSON data to a flat 2D plane suitable for rendering.
Interactivity can be added using D3's event handling. For example, you can use d3.select() to select the map elements (paths) and then attach event listeners such as .on('mouseover', function(){...}) to highlight features on hover, display tooltips with information, or trigger other actions. Zoom and pan can be implemented with D3's zoom behavior d3.zoom(), which can be applied to the SVG element containing the map. This behavior allows users to zoom in and out and pan around the map, updating the projection as needed to maintain detail.
28. Describe how to implement zoom and pan functionality in a D3 chart.
To implement zoom and pan in a D3 chart, you can use D3's d3.zoom behavior. First, create a zoom behavior using d3.zoom() and configure it (e.g., setting scale extent). Then, attach this zoom behavior to the chart's SVG element using .call(zoom). Within the zoom behavior, define a zoom function that updates the chart's transform attribute based on the zoom event's transform property. This transform can be applied to the chart's elements or to a group element containing the chart's content.
For panning, the d3.zoom behavior automatically handles panning as a part of its zooming and transformation capabilities. By dragging on the chart, the transform is updated to translate the chart. You can configure the zoom behavior with .translateExtent() to constrain panning within certain bounds, if required.
29. What are some ways to optimize the performance of a D3 chart, especially when dealing with large datasets?
When working with large datasets in D3.js, performance optimization is crucial. Several strategies can significantly improve rendering speed. First, data reduction techniques such as aggregation (grouping data points), filtering (removing irrelevant data), and sampling (using a representative subset) can reduce the volume of data that D3 needs to process. Next, virtualization techniques like only rendering the data currently visible in the viewport can prevent rendering of large datasets. Also, use appropriate scales. For very large numerical datasets, consider logarithmic or other non-linear scales to improve visual representation and rendering performance.
Furthermore, optimize D3 code by avoiding unnecessary DOM manipulations. Cache selections where possible, and use data joins efficiently to minimize the number of elements added or removed. Consider using Canvas instead of SVG if interactivity is less important since Canvas generally performs better with a high number of visual elements. Use d3.merge rather than concat as it is more efficient for array manipulation. Finally, using tools like console.time() and console.timeEnd() helps to identify performance bottlenecks in your code.
30. How do you handle different screen sizes and ensure your D3 visualization is responsive?
To handle different screen sizes and ensure a D3 visualization is responsive, I primarily use a combination of techniques. First, I avoid fixed pixel values for width and height and instead use percentages or viewport units (vw, vh) to define the SVG container's size. This allows the visualization to scale proportionally with the screen. I then use d3.select(window).on('resize', ...) to listen for window resize events and redraw or rescale the visualization accordingly.
Additionally, I might use techniques like adjusting font sizes or the number of elements displayed based on the screen size. For example, using media queries in CSS alongside D3, or recalculating axis tick values and label placements. A simplified example could look like this:
function updateVisualization() {
  const width = window.innerWidth;
  // Recalculate scales and redraw the visualization based on the new width
  xScale.range([0, width]);
  svg.select('.x-axis').call(xAxis);
  // ... redraw elements using the updated scale
}

d3.select(window).on('resize', updateVisualization);
D3.js interview questions for juniors
1. Can you describe what D3.js is in simple terms, like you're explaining it to a friend who's never heard of it?
Imagine you have data – numbers, lists, anything. D3.js is like a super-flexible tool that helps you turn that data into interactive and beautiful visuals on a webpage. Think charts, graphs, maps, or even custom data displays.
Essentially, it lets you take regular webpage elements like <div> or <svg> and dynamically change their properties (size, color, position, etc.) based on your data. It's not just about drawing; it's about creating dynamic relationships between your data and how it's visually represented, making it easy for users to explore and understand information.
2. What are the basic building blocks of a D3.js visualization?
The basic building blocks of a D3.js visualization revolve around manipulating the DOM based on data.
Key components include:
- Data: The information you want to visualize. D3 excels at binding data to DOM elements.
- Scales: Functions that map data values from your dataset (domain) to visual values (range), like pixel positions or colors. Examples:
d3.scaleLinear(),d3.scaleOrdinal(). - Axes: Visual representations of scales, typically lines with ticks and labels, created using
d3.axis*(). - Selections: D3's way of selecting DOM elements, similar to CSS selectors. Methods like
d3.select()andd3.selectAll()are used. - Transitions: Smooth animations for changes in your visualization, created with
selection.transition(). - Shapes: D3 provides generators for common shapes like lines, areas, and pies. Examples:
d3.line(),d3.area(),d3.pie(). - DOM Elements: SVG or HTML elements where the visualization is rendered. D3 allows you to create, modify, and remove these elements dynamically.
- Event Handling: D3 allows attaching event listeners (e.g., click, mouseover) to DOM elements for interactivity.
selection.on()is used for this.
3. What does SVG stand for, and why is it important in D3.js?
SVG stands for Scalable Vector Graphics. It is an XML-based vector image format for defining two-dimensional graphics, meaning images are defined using mathematical equations rather than pixels. This allows SVG images to be scaled up or down without losing quality.
In D3.js, SVG is crucial because D3 primarily manipulates the DOM (Document Object Model) to create visualizations. D3 uses SVG elements (like circle, rect, line, path, etc.) to draw shapes and construct graphical representations of data. D3's data binding and manipulation capabilities combined with SVG's rendering power make it a powerful tool for creating dynamic and interactive data visualizations on the web. D3 essentially becomes a tool to intelligently generate and modify SVG code based on the data being represented. d3.select('svg').append('circle').attr('r', 10) is an example of how D3 generates and modifies SVG.
4. How would you create a simple bar chart using D3.js? What are the steps?
To create a simple bar chart in D3.js, you typically follow these steps:
- Set up the SVG container: Create an SVG element in your HTML to hold the chart and define its width and height.
- Prepare the data: Have your data ready in a suitable format (e.g., an array of objects with labels and values).
- Create scales: Define scales to map your data values to pixel positions on the SVG. Use
d3.scaleLinear()for numerical values andd3.scaleBand()for categorical values (bar positions). - Create axes: Generate the x and y axes using
d3.axisBottom()andd3.axisLeft()based on your scales and append them to the SVG. - Create bars: Use
d3.select().selectAll().data().enter()to bind the data to the bar elements (usuallyrectelements). Set the x, y, width, and height attributes of the bars based on your scales and data values.
Example code snippet:
const svg = d3.select("#chart").append("svg").attr("width", width).attr("height", height);

svg.selectAll("rect")
   .data(data)
   .enter().append("rect")
   .attr("x", (d, i) => xScale(i))
   .attr("y", d => yScale(d.value))
   .attr("width", xScale.bandwidth())
   .attr("height", d => height - yScale(d.value));
5. What is a D3.js selection, and how do you use it to manipulate elements on a webpage?
In D3.js, a selection is a core concept that represents a set of Document Object Model (DOM) elements. It's your primary way to interact with and manipulate elements on a webpage using D3. You can select elements based on their tag name, class, ID, or other attributes, similar to CSS selectors.
To manipulate elements with a selection, you chain methods to it. Common methods include:
select(selector): Selects the first element that matches the specified selector.selectAll(selector): Selects all elements that match the specified selector.attr(name, value): Sets or gets the value of an attribute.style(name, value): Sets or gets the value of a style property.text(value): Sets or gets the text content of an element.html(value): Sets or gets the HTML content of an element.append(tag): Appends a new element with the specified tag as the last child of each element in the selection.remove(): Removes the selected elements from the DOM.
For example:
d3.select("body").append("p").text("Hello, D3!");
This code selects the body element, appends a new paragraph (p) element to it, and sets the text content of the paragraph to "Hello, D3!". This is a typical example of how selections are used to dynamically modify the webpage content.
6. Explain the difference between `append()` and `select()` in D3.js.
append() and select() are fundamental methods in D3.js for manipulating the DOM.
select(): This method selects the first element that matches a specified CSS selector within the current selection. If no element matches, it returns an empty selection. It's used to grab existing elements. Example:d3.select('body').select('div')would select the firstdivwithin thebody.append(): This method appends a new element as the last child of each element in the current selection. It creates a new DOM element of the specified type. Example:d3.select('body').append('div')would add a newdivelement to the end of thebody.
7. What are data joins in D3.js, and why are they useful?
Data joins in D3.js are a powerful mechanism for updating the DOM based on data. They involve three key selections:
- Enter: Elements that need to be created because there are more data points than existing DOM elements.
- Update: Existing DOM elements that need to be updated to reflect the current data.
- Exit: DOM elements that need to be removed because there are fewer data points than existing DOM elements.
Data joins are useful because they streamline the process of dynamically updating visualizations. Instead of manually adding, modifying, and removing elements, D3 handles these operations efficiently based on the data, significantly reducing code complexity and improving performance. They promote declarative programming; you specify what you want to display based on the data, and D3 handles how to update the DOM.
8. How do you bind data to elements using D3.js?
In D3.js, data binding is achieved using the selection.data() method. This method takes an array of data as input and associates each element in the selected DOM elements with a corresponding data point from the array. If there are more data points than elements, D3 creates placeholder elements for the extra data. Conversely, if there are more elements than data points, D3 keeps track of the 'orphaned' elements.
Subsequently, you use .enter(), .update(), and .exit() selections to handle the different scenarios:
.enter(): Creates new DOM elements for data points that don't have corresponding elements. Usually,append()is chained to add the new elements to the DOM..update(): Applies changes to the existing DOM elements that have corresponding data points..exit(): Removes DOM elements that don't have corresponding data points. Usually,remove()is chained to remove the elements from the DOM.
Example:
const data = [10, 20, 30];

const circles = d3.select("svg")
  .selectAll("circle")
  .data(data);

// Enter selection
circles.enter()
  .append("circle")
  .attr("r", d => d);

// Update selection
circles.attr("fill", "steelblue");

//Exit selection
circles.exit().remove();
9. Can you explain what a scale is in D3.js and why we use it?
In D3.js, a scale is a function that transforms values from an input domain to an output range. We use scales because the raw data values we work with often don't directly correspond to pixel values on the screen. For example, if our data ranges from 10 to 100, we need a way to map these values to a suitable range of pixel values, say 0 to 500, for visualization.
Scales are crucial for:
Mapping data to visual properties: Ensuring that data is represented proportionally and accurately in a visualization. This might be pixel position, color, radius, etc.
Normalization: Standardizing data values to fit within a specific visual space.
Handling different data types: D3 offers various scale types to handle different data types effectively such as linear, logarithmic, ordinal, time and so on. For example:
const linearScale = d3.scaleLinear()
  .domain([0, 100]) // input domain
  .range([0, 500]); // output range

console.log(linearScale(50)); // Output: 250
10. How would you add axes to a D3.js chart?
To add axes to a D3.js chart, you typically use d3.axisBottom(), d3.axisLeft(), d3.axisTop(), or d3.axisRight() to create an axis generator. Then, you create a selection (usually a g element) in your SVG and call the axis generator on that selection. You'll also need to define scales (linear, time, etc.) and associate them with the axis generator so the axis knows how to map data values to pixel positions. For example:
const xScale = d3.scaleLinear().domain([0, 100]).range([0, width]);
const xAxis = d3.axisBottom(xScale);

svg.append('g').attr('transform', `translate(0, ${height})`).call(xAxis);
This code creates a bottom axis, positions it at the bottom of the SVG, and then renders the axis using the scale to compute tick positions and labels. Similarly, axisLeft is used for the y-axis. You can customize the number of ticks, tick format, and other axis properties using methods like .ticks() and .tickFormat() on the axis generator.
11. What is the purpose of using transitions in D3.js?
Transitions in D3.js are used to smoothly animate changes in data visualizations over time. Instead of instantly snapping to a new state, transitions allow properties like position, color, size, and other visual attributes to change gradually, making the visualization more engaging and easier to understand.
Transitions enhance user experience by providing visual cues that help viewers track data transformations. They make the visualization more dynamic and intuitive. For example, instead of the element jumping from one place to another, it moves to the new location.
12. How can you handle user interactions, like clicks or mouseovers, in D3.js?
D3.js provides event listeners to handle user interactions. You can use .on() to bind event listeners to selected elements. The first argument is the event type (e.g., "click", "mouseover"), and the second is a callback function to execute when the event occurs. Inside the callback, this refers to the DOM element that triggered the event, and d3.event provides access to the event object.
For example, to handle a click event:
d3.select("circle")
  .on("click", function(d) {
    console.log("Circle clicked!");
    console.log("Data associated with the circle:", d);
    console.log("The HTML element", this);
  });
13. What are some common chart types you can create with D3.js?
D3.js is extremely versatile and can be used to create a wide range of chart types. Some common examples include:
- Bar charts: Displaying categorical data with rectangular bars.
- Line charts: Showing trends over time or continuous data.
- Scatter plots: Visualizing the relationship between two variables.
- Pie charts: Representing proportions of a whole.
- Histograms: Displaying the distribution of numerical data.
- Area charts: Similar to line charts but with the area below the line filled.
- Geographic maps: Displaying data on geographical regions. D3.js offers great geo features like
d3.geoPath()to convert GeoJSON to SVG path data. - Tree diagrams: Visualizing hierarchical data.
- Force-directed graphs: Representing networks of nodes and links. They are particularly useful for showcasing relationships between data points.
- Box plots: Summarizing the distribution of data through quartiles.
These are just a few examples, and D3.js's flexibility allows for the creation of many more custom and complex visualizations, going beyond standard chart types by using its manipulation and data binding capabilities with SVG, Canvas, and HTML.
14. How do you load data from an external file (like a CSV or JSON file) into D3.js?
D3.js provides several helper functions for loading data from external files. The most common methods are d3.csv(), d3.json(), and d3.tsv(). These functions asynchronously fetch the data and parse it into a JavaScript array of objects, suitable for use with D3's data binding capabilities.
For example, to load data from a CSV file named data.csv, you would use:
d3.csv("data.csv").then(function(data) {
  // 'data' is now an array of objects, where each object
  // represents a row from the CSV file.
  console.log(data);
  // Use the data to create visualizations with D3
});
Similarly, d3.json("data.json") loads data from a JSON file. After loading, you would then typically use this data array along with D3's selections and data binding methods to dynamically create and update SVG elements, thus visualizing the data.
15. What is the difference between `enter()`, `update()`, and `exit()` selections in D3.js?
In D3.js, enter(), update(), and exit() represent different phases in managing data-driven DOM elements. The update selection contains elements that already exist in the DOM and have corresponding data. This is where you modify existing elements to reflect the new data.
The enter selection contains placeholder elements for data that does not yet have corresponding DOM elements. You typically append new DOM elements to the document using this selection. The exit selection contains DOM elements that no longer have corresponding data. You typically remove these elements from the DOM.
16. How can you update a D3.js visualization with new data?
To update a D3.js visualization with new data, you typically use the data() and join() methods (or older enter(), update(), exit() pattern for more control). First, bind the new data to your selected elements using selection.data(newData). Then, use .join() to handle entering, updating, and exiting elements based on the data:
svg.selectAll("circle")
   .data(newData)
   .join(
     enter => enter.append("circle").attr("cx", d => x(d.x)).attr("cy", d => y(d.y)).attr("r", 5),
     update => update.attr("cx", d => x(d.x)).attr("cy", d => y(d.y)),
     exit => exit.remove()
   );
Where enter creates new elements for data that doesn't have a corresponding element, update modifies existing elements to reflect changes in the data, and exit removes elements for data that no longer exists. Transitions can be added to the enter, update, and exit selections for smooth animations.
17. Describe how you might create a scatter plot using D3.js.
To create a scatter plot with D3.js, you typically start by selecting an SVG element where you'll draw the plot. Then, you define scales for the x and y axes based on your data. These scales map data values to pixel positions. Next, you bind your data to circle elements (representing the points in the scatter plot). For each data point, you set the cx and cy attributes of the corresponding circle using the scales you defined earlier. Finally, you add axes to the plot using d3.axisBottom() and d3.axisLeft(), positioning them appropriately.
For example:
// Assuming 'data' is an array of {x: ..., y: ...} objects
const xScale = d3.scaleLinear().domain([0, 100]).range([0, width]);
const yScale = d3.scaleLinear().domain([0, 100]).range([height, 0]);

svg.selectAll("circle")
  .data(data)
  .enter().append("circle")
  .attr("cx", d => xScale(d.x))
  .attr("cy", d => yScale(d.y))
  .attr("r", 5);

svg.append("g")
  .attr("transform", `translate(0,${height})`)
  .call(d3.axisBottom(xScale));

svg.append("g")
  .call(d3.axisLeft(yScale));
18. What are some advantages of using D3.js over other charting libraries?
D3.js offers a lower-level approach, granting fine-grained control over every aspect of your visualization. This allows for highly customized and unique charts that are difficult to achieve with higher-level libraries. It's excellent for creating visualizations beyond standard chart types. D3 leverages web standards like HTML, CSS, and SVG, providing compatibility and flexibility within web environments.
Compared to other libraries that focus on pre-built chart components, D3.js is more of a toolkit. Some advantages include:
- Flexibility: Unmatched customization options.
- Performance: Optimized for manipulating the DOM efficiently.
- Scalability: Handles large datasets well.
- Community: Extensive documentation and a vibrant community.
19. What are some potential challenges you might face when working with D3.js?
Working with D3.js can present several challenges. One common hurdle is the steep learning curve, particularly for individuals unfamiliar with web standards like SVG, HTML, and CSS. D3's API, while powerful, is extensive and requires time to master. Data binding and manipulation, core to D3, can also be complex, requiring careful attention to ensure data integrity and efficient updates.
Performance optimization can also be a challenge, especially when dealing with large datasets or complex visualizations. Managing transitions and animations effectively is crucial to provide a smooth user experience. Browser compatibility issues may arise requiring testing and adjustments for different browsers. Finally, integrating D3 with other frameworks or libraries can sometimes lead to conflicts or require careful coordination.
20. How do you add labels to your D3.js chart?
To add labels to a D3.js chart, you generally use D3's data binding capabilities to create and position text elements within your SVG. You select the SVG element, bind your data to it, and then enter() to create new text elements for each data point that needs a label. Then you set the x and y attributes to position the labels, and use .text() to set the actual text of the label.
For example:
svg.selectAll(".label")
  .data(data)
  .enter().append("text")
  .attr("class", "label")
  .attr("x", function(d) { return xScale(d.x); }) // Position based on data
  .attr("y", function(d) { return yScale(d.y); }) // Position based on data
  .attr("dy", ".35em") // Fine-tune vertical positioning
  .text(function(d) { return d.label; }); // Set the label text
21. What is the use of interpolation in D3.js?
In D3.js, interpolation is used to smoothly transition values between two data points. It helps create animated transitions in visualizations, making changes appear gradual and visually appealing rather than abrupt. Instead of instantly jumping from one value to another, interpolation calculates intermediate values, creating a smooth animation.
Specifically, D3 provides various interpolation functions (e.g., d3.interpolate, d3.interpolateNumber, d3.interpolateString, d3.interpolateArray, d3.interpolateObject) tailored for different data types. For example, d3.interpolateNumber(0, 100)(0.5) would return 50. This is incredibly useful for animating changes in positions, sizes, colors, and other visual attributes of elements in a D3.js visualization.
D3.js intermediate interview questions
1. How do you implement zooming and panning in a D3.js visualization, and what are some performance considerations when dealing with large datasets?
To implement zooming and panning in D3.js, you typically use the d3.zoom() behavior. You create a zoom behavior and then apply it to a selection, usually the SVG element containing your visualization. The zoom behavior modifies the SVG's transform attribute using translate and scale based on user interactions like mouse wheel or dragging. You'll generally update the attributes of the visual elements based on the current transform obtained from the zoom event.
For large datasets, performance can become an issue. Consider these optimizations: 1. Debouncing or throttling zoom events to reduce the frequency of updates. 2. Implementing level-of-detail (LOD), where you simplify the visualization or render fewer elements at lower zoom levels. 3. Using techniques like viewport culling to only render elements that are currently visible within the viewport. 4. Optimizing data structures to speed up data lookups and transformations. For example:
svg.call(d3.zoom()
    .scaleExtent([0.5, 10]) // Optional: limit zoom level
    .on("zoom", zoomed));

function zoomed({transform}) {
  g.attr("transform", transform);
  // g is a group element containing all the visual elements
}
2. Explain how to create interactive tooltips that display dynamic information when hovering over data points in a D3.js chart.
To create interactive tooltips in D3.js, you typically use the mouseover, mousemove, and mouseout events. First, create a div element (usually absolutely positioned) to act as the tooltip container, initially hidden with opacity: 0. Then, attach event listeners to your data points (e.g., circles in a scatterplot). On mouseover, update the tooltip's content with the dynamic information related to the hovered data point (e.g., data values), and smoothly fade in the tooltip by changing its opacity to 1 and positioning it near the mouse cursor. On mousemove, continuously update the tooltip's position to follow the cursor. Finally, on mouseout, fade out the tooltip by setting opacity back to 0, hiding it when the mouse moves away from the data point.
Here is an example:
.on('mouseover', function(event, d) {
  tooltip.transition().duration(200).style('opacity', .9);
  tooltip.html('Value: ' + d.value)
         .style('left', (event.pageX) + 'px')
         .style('top', (event.pageY - 28) + 'px');
})
.on('mouseout', function(event, d) {
 tooltip.transition().duration(500).style('opacity', 0);
});
3. Describe the process of creating reusable components in D3.js and why this is beneficial for large projects.
In D3.js, reusable components are typically created by defining a function that encapsulates the D3 code for a specific visual element or feature. This function accepts a selection as input and applies D3 operations to it, configuring the element's appearance and behavior. You can also pass configuration options to this function, allowing users to customize the component's properties without modifying its internal code. These options are often handled via chaining with .attr, .style, and other D3 selection methods.
Reusing components significantly benefits large projects by:
- Reducing code duplication: Write once, use many times.
- Improving maintainability: Changes to the component only need to be made in one place.
- Enhancing readability: Code becomes more modular and easier to understand.
- Facilitating collaboration: Different developers can work on different components independently.
- Promoting consistency: Ensures a uniform look and feel across the entire application.
4. How can you efficiently update a D3.js chart with streaming data or real-time updates?
To efficiently update a D3.js chart with streaming data, leverage D3's data binding and transition capabilities. Instead of redrawing the entire chart on every update, focus on updating only the elements that have changed. Use selection.data() to bind the new data to existing elements. Then, use selection.enter(), selection.update(), and selection.exit() to handle new, updated, and removed data points, respectively.
Use D3's transitions (selection.transition()) to smoothly animate changes in the chart, providing a better user experience. To prevent performance bottlenecks, limit DOM manipulations and data processing to what's strictly necessary for each update. Consider using techniques like data sampling or aggregation to reduce the volume of data being processed and displayed, especially when dealing with very high-frequency updates. Also, you might consider using requestAnimationFrame to throttle rendering.
5. What are some techniques for optimizing D3.js visualizations for mobile devices and touch interactions?
Optimizing D3.js visualizations for mobile and touch involves several techniques. Firstly, simplify your visualizations by reducing the number of elements and calculations. Use responsive design principles by setting the visualization's width and height as percentages, and using d3.scale for dynamic scaling. Optimize touch interactions by implementing touch event listeners (touchstart, touchmove, touchend) using d3.event to handle touch gestures. Disable default browser behaviors like zoom and pan with event.preventDefault() when needed. Use larger, more accessible touch targets. Consider using libraries like Hammer.js for advanced gesture recognition.
Secondly, improve performance by using techniques like data aggregation to reduce the number of data points rendered, and using canvas rendering instead of SVG for large datasets. Consider using d3.throttle or requestAnimationFrame to limit the frequency of updates during dragging or zooming. Avoid complex transitions or animations that can be resource-intensive on mobile devices. Load data efficiently, potentially using techniques like lazy loading or data chunking.
6. Explain how to implement transitions and animations in D3.js to create smooth and engaging data visualizations.
D3.js uses transitions to smoothly animate changes to selections over time. To implement a transition, you first select the elements you want to animate, then call the .transition() method. You can then chain methods like .duration() to specify the transition duration (in milliseconds), .ease() for easing functions (e.g., 'easeLinear', 'easeCubic'), and .attr() or .style() to define the final attributes or styles. For example: d3.select('circle').transition().duration(500).attr('cx', 100). This code snippet will smoothly transition the 'cx' attribute of a circle to 100 over 500 milliseconds.
Animations can be triggered by user interactions or data updates. You can update data and re-run the D3 update pattern within a transition block. For instance, if your data changes, you can rebind the data to your elements, and then initiate a transition on those elements to reflect the new data values visually. Use .delay() to stagger the start of transitions for different elements, creating more visually appealing effects. Also consider using D3's built-in interpolators for custom animations.
7. How do you handle different data formats (e.g., JSON, CSV, TSV) when loading data into a D3.js visualization?
D3.js provides convenient methods for parsing common data formats directly. For JSON, d3.json() is used to fetch and parse the data. For CSV and TSV files, d3.csv() and d3.tsv() respectively are the primary methods. These methods automatically parse the file and provide the data as an array of JavaScript objects, where each object represents a row and the keys are the column headers.
If you encounter a less common format or require more control over the parsing process, you can use JavaScript's built-in fetch API to retrieve the data as a string and then employ a custom parsing function or library. For example, you might use a dedicated XML parsing library if you were dealing with XML data. After parsing you can feed data into D3 for visualizations.
8. Describe how to create a choropleth map using D3.js and GeoJSON data, including handling map projections.
Creating a choropleth map with D3.js involves several steps. First, load your GeoJSON data using d3.json(). Then, define a map projection (e.g., d3.geoMercator(), d3.geoAlbersUsa()) and configure its scale and translation to fit your desired map dimensions. A path generator is created using d3.geoPath().projection(yourProjection). You then bind the GeoJSON features to SVG path elements. The fill color of each path element is determined by a data property within your GeoJSON, typically linked to a color scale created with D3 (e.g., d3.scaleLinear(), d3.scaleQuantize()).
To handle map projections, experiment with different projections to find one that best suits your data and visualization goals. Adjust the projection's scale and translate properties to center the map correctly within your SVG. You can also implement zooming and panning by modifying the projection dynamically based on user interactions. Here's some example of d3 projection:
const projection = d3.geoAlbersUsa()
    .scale(800)
    .translate([width / 2, height / 2]);
const path = d3.geoPath().projection(projection);
9. How can you use D3.js to create a force-directed graph visualization, and what are some common customizations?
To create a force-directed graph with D3.js, you typically start by loading your data (nodes and links) into JavaScript objects. Then, you initialize a D3 force simulation using d3.forceSimulation(). You add forces like d3.forceManyBody() (attraction/repulsion), d3.forceLink() (maintaining link distances), d3.forceCenter() (centering the graph), and d3.forceCollide() (preventing node overlap). For each node and link in your data, you create SVG elements (circles for nodes, lines for links) and bind the data to these elements. Finally, within the simulation's tick function, you update the positions of the nodes and links based on the force calculations.
Common customizations include: Node Styling: Changing the size, color, and shape of nodes based on node properties. Link Styling: Adjusting link thickness, color, and adding arrowheads. Labels: Adding text labels to nodes or links. Interactive Elements: Implementing zoom, pan, drag, and tooltips using D3's event handling capabilities. Data-Driven Styling: Mapping data values to visual properties like node size or link color. For example, the following code snippet shows a very basic setup of forces:
const simulation = d3.forceSimulation(nodes)
    .force("link", d3.forceLink(links).id(d => d.id))
    .force("charge", d3.forceManyBody())
    .force("center", d3.forceCenter(width / 2, height / 2));
10. Explain the concept of scales in D3.js and how they are used to map data values to visual properties.
Scales in D3.js are functions that transform data values from an input domain to an output range. They are essential for mapping data to visual properties like position, color, or size, making it possible to represent data graphically. Essentially, scales bridge the gap between raw data and visual representation.
For example, a linear scale could map a dataset of temperature values (e.g., 0-100 degrees Celsius) to pixel positions on a screen (e.g., 0-500 pixels). D3 provides various scale types like d3.scaleLinear(), d3.scaleBand(), d3.scaleOrdinal(), etc., each suited for different data types and visual encodings. You typically configure scales by setting their domain (input data range) and range (output visual range) using .domain() and .range() methods, respectively. Once configured, you can pass a data value to the scale function to get the corresponding visual value. Using scales simplifies the process of creating accurate and visually appealing data visualizations.
11. Describe how to implement data binding in D3.js using the `data()` and `enter()`, `update()`, `exit()` selections.
Data binding in D3.js connects data to DOM elements. The data() function joins data to a selection. enter() handles new data points without corresponding DOM elements, creating new elements for them. update() selects elements that already have bound data and allows you to modify their attributes or styles based on the data. exit() selects elements that have bound data but no longer have a corresponding data point, allowing you to remove them.
For example:
const circles = svg.selectAll("circle")
  .data(dataset);

// ENTER selection - create new circles
circles.enter().append("circle")
  .attr("cx", (d, i) => i * 50)
  .attr("cy", 50)
  .attr("r", d => d);

// UPDATE selection - update existing circles
circles.attr("fill", "steelblue");

// EXIT selection - remove circles with no data
circles.exit().remove();
12. How do you handle user interactions, such as clicking or dragging, to modify or filter data in a D3.js visualization?
D3.js provides event listeners that can be attached to SVG elements to handle user interactions. For example, .on('click', function) or .on('drag', function). Inside the callback function, d3.select(this) refers to the clicked or dragged element, and d3.event contains information about the event, like mouse coordinates.
To modify data, you can access the data bound to the element using d3.select(this).datum(). Update the data based on the interaction and then re-render the visualization by calling the appropriate D3 update functions to reflect the changes. For filtering, similarly access the bound data, update a filter variable and re-render the visualization only showing the elements that satisfy the filter.
13. What are some common D3.js layout algorithms (e.g., pie, bar, stack) and how do you customize them?
D3.js offers several layout algorithms to automatically position elements in a visualization. Common ones include: Pie charts (d3.pie), transforming data into angular wedges; Bar charts, which can be created using d3.scaleLinear or d3.scaleBand to determine bar positions and heights based on the data; Stack layouts (d3.stack), useful for displaying data series stacked on top of each other; Tree layouts (d3.tree and d3.cluster), arranging hierarchical data in a tree-like structure; and Force layouts (d3.forceSimulation), simulating physical forces to position nodes and links in a network graph.
Customization involves modifying the layout's parameters or directly manipulating the generated data. For example, with d3.pie, you can change the sort order using .sortValues() or .sort(null) to disable sorting, modify the value accessor using .value(), or adjust the start and end angles. For force layouts, you can tweak the forces applied to nodes (e.g., charge, link distance, centering) using methods like force.force('charge', d3.forceManyBody()), force.force('link', d3.forceLink().distance(d => d.distance)) and force.force('center', d3.forceCenter(width / 2, height / 2)). Bar charts are customized by adjusting the scales that control position and height based on data ranges.
14. Explain how to integrate D3.js with other JavaScript libraries or frameworks (e.g., React, Angular, Vue.js).
Integrating D3.js with frameworks like React, Angular, or Vue.js involves managing D3's direct DOM manipulation to avoid conflicts with the framework's virtual DOM. The general strategy is to let the framework handle component rendering and state management, while using D3 for calculations and visual encodings. Data is typically passed from the framework's components to D3 for visualization. It is generally recommended to perform the D3 manipulations inside of the useEffect or componentDidMount (or similar) lifecycle methods to ensure the DOM element exists before attempting to bind D3 to it.
Here's a simplified approach:
- Component Creation: Create a React/Angular/Vue component to hold the D3 visualization.
- Data Passing: Pass data to this component as props/inputs.
- D3 Integration (inside component):
- Use a
refto get a reference to the DOM element where D3 will draw. - In
useEffect(React),ngAfterViewInit(Angular), ormounted(Vue), use D3 to manipulate the DOM element referenced by the ref. - Update D3 visualizations within
useEffect/ngOnChanges/watchblocks when data changes to re-render based on updated data.
- Use a
- Avoid Direct DOM Manipulation: Avoid directly manipulating the DOM outside of the D3 code within your component. Let the framework manage the rest of the application UI.
Example (React):
import React, { useRef, useEffect } from 'react';
import * as d3 from 'd3';

function MyChart({ data }) {
  const svgRef = useRef();

  useEffect(() => {
    const svg = d3.select(svgRef.current);
    // D3 code to create chart using 'data'
  }, [data]);

  return <svg ref={svgRef}></svg>;
}

export default MyChart;
15. How do you create and customize axes in D3.js, including handling tick formatting and labels?
In D3.js, axes are created using d3.axisTop(), d3.axisRight(), d3.axisBottom(), or d3.axisLeft(), each corresponding to the axis's position. These axis generators are then applied to a selection, typically a g element, using .call(). Customization includes setting the scale using .scale(yourScale) where yourScale is a D3 scale like d3.scaleLinear() or d3.scaleTime(). Tick formatting is handled with .tickFormat(d3.format("yourFormatSpecifier")), allowing control over the appearance of tick labels (e.g., dates, numbers). Specific tick values can be set using .tickValues(yourArrayOfValues). To label the axes, add a text element within the axis group and position it appropriately using transform="translate(x,y)".
Here is a short example:
const xAxis = d3.axisBottom(xScale)
    .tickFormat(d3.timeFormat("%Y-%m-%d"));

svg.append("g")
    .attr("transform", `translate(0, ${height})`)
    .call(xAxis);

svg.append("text")
    .attr("x", width/2)
    .attr("y", height + margin.bottom)
    .style("text-anchor", "middle")
    .text("Date");
16. Describe how to implement data-driven styling in D3.js using CSS and JavaScript to dynamically change visual properties.
Data-driven styling in D3.js involves binding data to DOM elements and then using that data to dynamically control CSS properties. This is typically achieved using D3's selection methods, data binding, and the .style() or .attr() methods.
To implement this:
- Bind Data: Use
.data()to associate data with selected elements. - Define Styling Function: Create a JavaScript function that accepts a data point as input and returns the desired CSS property value (e.g., color, size).
- Apply Style: Use
.style()or.attr()to set the CSS property or attribute, passing your styling function as an argument. For example:
d3.selectAll("circle")
  .data(dataset)
  .style("fill", function(d) { return colorScale(d.value); });
This code snippet selects all circle elements, binds the dataset, and sets their fill style dynamically based on the value property of each data point d, using colorScale to map the value to a color.
17. How can you use D3.js to create a treemap visualization, and what are some best practices for displaying hierarchical data?
To create a treemap visualization with D3.js, you typically use the d3.treemap() layout. You first load your hierarchical data (often in JSON format). Then, you define the treemap layout with specified size and padding. Next, you use d3.hierarchy() to structure the data, followed by applying the treemap layout to this hierarchy. Finally, you create rectangles (usually SVG rect elements) bound to the treemap nodes, setting their x, y, width, and height attributes based on the layout's output. Color coding can be used to differentiate the different sections/branches using d3.scaleOrdinal or other scales.
Some best practices for displaying hierarchical data include: using appropriate color schemes for clarity, providing clear labels for each node (but avoiding label overload by only showing them if size allows), implementing interactive features like zooming or tooltips to reveal more details on hover, and carefully choosing the treemap's aspect ratio to optimize space utilization. Consider accessibility, providing alternative ways to read the information. Lastly, consider using a consistent padding to make the visualisation easier to understand.
18. Explain how to handle missing or invalid data when creating D3.js visualizations, ensuring robustness and clarity.
When creating D3.js visualizations, handling missing or invalid data is crucial for robustness and clarity. One approach is to pre-process the data to filter out or impute missing values before passing it to D3.js. For instance, you can use JavaScript's filter() method to remove data points where specific fields are null, undefined, or NaN. Alternatively, you might replace missing numerical values with the mean or median of the existing data, or categorical values with a placeholder like 'Unknown'.
Within D3.js, you can use conditional logic to handle potential data issues during the visualization process. For example, you might use selection.filter() again to exclude elements from the visualization that have invalid associated data. You could also use ternary operators or if/else statements within your D3 code to provide default values or display alternative visual representations for missing or invalid data points. Here's an example:
.attr('cy', d => (d.value == null ? 0 : yScale(d.value))) // Use 0 if value is null
.style('opacity', d => (d.value == null ? 0.5 : 1)); // Reduce opacity for null values
Furthermore, informative tooltips or labels can be used to indicate missing or imputed data, improving the clarity of the visualization.
19. Describe how to create a scatter plot matrix using D3.js to visualize relationships between multiple variables.
Creating a scatter plot matrix with D3.js involves iterating through pairs of variables from your dataset. For each pair, you create an SVG element and define scales for the x and y axes based on the data range of those variables. You then append circles (or other shapes) to the SVG, positioning them according to the corresponding data points using the scales you defined. Axis labels should also be dynamically generated based on your variables. Finally, you would want to wrap each individual plot within a larger container to display the matrix of plots.
Here's a simplified example of generating a single scatter plot. You'd need to adapt and iterate this for the matrix:
const svg = d3.select("#container").append("svg").attr("width", 200).attr("height", 200);
const xScale = d3.scaleLinear().domain([0, 10]).range([0, 200]);
const yScale = d3.scaleLinear().domain([0, 10]).range([200, 0]);

svg.selectAll("circle")
  .data(data)
  .enter().append("circle")
  .attr("cx", d => xScale(d.x))
  .attr("cy", d => yScale(d.y))
  .attr("r", 5);
Remember to handle data loading and error scenarios. Also, consider adding interactivity like tooltips on hover for a better user experience.
20. How do you implement cross-filtering in D3.js, allowing users to interactively explore data across multiple charts?
Cross-filtering in D3.js often utilizes the Crossfilter library (or similar custom solutions) to efficiently manage and filter data across multiple charts. First, load data and create a crossfilter object. Then, for each chart, create a dimension based on a specific attribute in your dataset. Each chart's visual elements are bound to this dimension's filtered data. When a user interacts with a chart (e.g., brushing or clicking), the corresponding dimension's filter is updated, triggering a redraw of all charts, reflecting the new data selection.
For example, if you have charts showing sales by region and product category, filtering the 'region' chart will update the 'product category' chart to only show sales within the selected regions.
Key steps:
- Create Crossfilter Object:
crossfilter(data) - Create Dimensions:
cf.dimension(function(d) { return d.region; }) - Bind data to charts using dimension's filter:
dimension.filter(selectedRegion) - Redraw charts: Update visualizations based on the filtered data in each dimension.
d3.selectAll(".chart").each(function(){ //redraw chart})
21. What are some techniques for improving the accessibility of D3.js visualizations for users with disabilities?
To improve accessibility in D3.js visualizations, consider these techniques:
- Semantic HTML: Use appropriate HTML elements (e.g.,
<svg>,<text>) with meaningful ARIA attributes to describe the visualization's structure and purpose. Provide alternative text descriptions usingaria-labeloraria-describedbyfor screen readers. Make sure the textual information is readily available even if the visual elements are not perceivable. - Keyboard Navigation: Implement keyboard controls for interacting with chart elements. For example, allow users to tab through data points and trigger actions using the enter key. You can use tabIndex and keyboard event listeners to achieve this.
- Color Contrast: Ensure sufficient color contrast between elements and the background. Use color contrast checkers to verify compliance with WCAG guidelines.
- Focus Indicators: Style focused elements to clearly indicate the current keyboard focus. Use CSS properties like
outlineorbox-shadow. - Screen Reader Updates: Use
aria-liveregions to dynamically announce changes in the visualization to screen reader users. This is helpful for animations or interactive updates. - Accessible Data Tables: Provide an accessible HTML table containing the underlying data displayed in the visualization. This offers an alternative way for users to access the information.
- Descriptive Titles and Labels: Use clear and concise titles and labels for all chart elements, axes, and legends. This helps users understand the purpose and content of the visualization.
- Skip Navigation: Add a 'skip to content' link so keyboard users can bypass repetitive navigation and quickly access the visualization.
22. Explain how to use D3.js to create a calendar view visualization, showing data over time periods.
Creating a calendar view with D3.js involves several steps. First, structure your data to include dates and corresponding values (e.g., counts, sums). Then, define scales for both the x and y axes based on the week and day of the week, respectively. Use these scales to position rectangles representing each day within the calendar grid. The color of each rectangle can be mapped to the data value using a color scale (e.g., d3.scaleSequential or d3.scaleDiverging). Finally, add labels for the months and days of the week to provide context.
To implement this, you'll typically use D3's selection and data binding (.data(), .enter(), .append()) to create the calendar grid. The rect elements representing each day are styled with appropriate x, y, width, height, and fill attributes based on the scales and data. Tooltips can be added to show the exact data value on hover, improving interactivity. Example:
// Simplified example, assuming 'data' is an array of {date: Date, value: Number}
const svg = d3.select("#calendar");
svg.selectAll("rect")
   .data(data)
   .enter().append("rect")
   .attr("x", d => weekScale(d3.timeWeek.count(d3.timeYear(d.date), d.date))) // Week of the year
   .attr("y", d => dayScale(d.date.getDay())) // Day of the week
   .attr("width", cellSize)
   .attr("height", cellSize)
   .attr("fill", d => colorScale(d.value));
23. How do you handle large datasets efficiently in D3.js, including techniques like data aggregation and sampling?
When dealing with large datasets in D3.js, efficient handling is crucial for performance. Data aggregation involves reducing the dataset's size by summarizing data points (e.g., calculating averages or sums for specific intervals). Sampling techniques like random sampling or stratified sampling select a representative subset of the data for visualization, significantly reducing rendering time. Implement these techniques before passing data to D3, using server-side processing or client-side libraries like lodash for aggregation and sampling. Also use d3.scaleQuantize() or d3.bin() methods.
Other optimization tips include: using canvas rendering instead of SVG when appropriate, virtualizing lists/tables (rendering only the visible portion), and optimizing data structures for fast access. For example, consider leveraging indexes or pre-calculated values if the same data transformations are repeatedly applied. Debouncing or throttling event handlers can also prevent excessive updates when users interact with the visualization.
24. Describe how to implement brush and zoom interactions in D3.js to allow users to focus on specific regions of a chart.
To implement brush and zoom in D3.js, you typically define a brush area and a zoom behavior, then apply them to your chart. The brush lets users select a region, and the zoom behavior handles scaling and translation.
First, create a brush using d3.brushX() or d3.brushY() (or d3.brush() for both). Attach this brush to a g element in your SVG. Listen for the brush and end events on the brush. In the brush event handler, determine the selected domain using d3.event.selection and update the scales of your axes based on this selection. Re-render your chart elements using the updated scales. Implement the zoom behavior with d3.zoom() and attach it to the same g element. On zoom, update scales using d3.event.transform and re-render. Consider using selection.call(zoom) and selection.call(brush) to invoke the zoom and brush behaviors respectively. Here is an example:
const brush = d3.brushX().on("brush end", brushed);
const zoom = d3.zoom().scaleExtent([1, 8]).on("zoom", zoomed);

svg.append("g").call(brush);
svg.call(zoom);
25. How can you use D3.js to create a network graph visualization, and what are some common layouts for displaying relationships?
To create a network graph in D3.js, you typically start by preparing your data as a set of nodes and links (edges). The nodes represent the entities in your network, and the links represent the relationships between them. Then, you use D3's force simulation to calculate the positions of the nodes based on forces like attraction (between linked nodes) and repulsion (between all nodes). You bind the node and link data to SVG elements (circles for nodes, lines for links) and update their positions based on the simulation's tick function. Finally, you can add labels and styling for clarity.
Common layouts include:
- Force-Directed Graph: Nodes are connected by links and subject to forces.
- Hierarchical Layouts (Tree, Cluster, Dendrogram): Visualize hierarchical data structures.
- Arc Diagram: Nodes are arranged in a line, and links are drawn as arcs connecting them.
- Matrix Diagram: Relationships are represented in a matrix form.
26. Explain how to create a parallel coordinates plot using D3.js to visualize high-dimensional data.
To create a parallel coordinates plot in D3.js, you'll typically start by loading your high-dimensional data. Then, define scales for each dimension, mapping data values to pixel positions. These scales determine the positioning of the axes. Next, you'll create the axes using D3's axis functions, appending them to the SVG container. For each data point, generate a polyline connecting the data values across all dimensions, effectively drawing a line through all the axes. The code usually involves iterating through the dimensions and creating a path string representing the line. Styling the lines (color, opacity) based on specific attributes of the data can enhance readability. You can also add interactive features like brushing to highlight subsets of data.
27. Describe how to implement custom color scales in D3.js to effectively communicate data insights.
To implement custom color scales in D3.js, you typically use d3.scaleLinear(), d3.scaleQuantize(), d3.scaleThreshold(), or d3.scaleOrdinal(). For continuous data, d3.scaleLinear() is suitable; you map a domain (input data range) to a range of colors. For example:
const colorScale = d3.scaleLinear()
  .domain([0, 100])
  .range(['red', 'blue']);
For discrete data or to create a quantile scale, use d3.scaleQuantize() or d3.scaleThreshold(). d3.scaleOrdinal() maps discrete input values to discrete color values. You define your color palette (an array of colors) and associate it with your data categories. You can use hex codes, color names or rgb values for colors. Remember to choose color scales that are perceptually uniform and accessible, considering colorblindness.
28. How do you use d3-geo for map projections and geographical calculations?
d3-geo is a powerful D3.js module for map projections and geographical calculations. It provides functions to transform geographical coordinates (latitude and longitude) into planar coordinates suitable for display, and vice versa. Common projections like Mercator, Albers, and orthographic are readily available. You create a projection using d3.geo[ProjectionName](), configure it using methods like .center(), .scale(), .translate(), and then use it as a function to project geographic coordinates: projection([longitude, latitude]). For example,
const projection = d3.geoMercator().center([0, 0]).scale(100);
const projectedCoordinates = projection([longitude, latitude]);
Furthermore, d3-geo offers functions for geometric operations on geographic data, like calculating distances using d3.geoDistance(pointA, pointB) which returns the distance in radians, and creating geopath generators with d3.geoPath(projection) that convert GeoJSON features into SVG path data for rendering maps. These path generators greatly simplify the process of drawing map features on a webpage.
D3.js interview questions for experienced
1. How would you optimize a D3.js visualization for performance when dealing with a very large dataset (e.g., millions of data points)?
When dealing with massive datasets in D3.js, performance optimization is crucial. Key strategies include: 1. Data Aggregation/Binning: Reduce the number of data points displayed by grouping similar values (e.g., creating histograms). 2. Data Filtering: Show only the relevant subset of data based on initial filters or user interactions. 3. Virtualization/Canvas: Render elements on a <canvas> for better performance, especially for simple shapes like circles or lines. Consider libraries like d3-force or pixi.js for enhanced canvas rendering. 4. Web Workers: Offload data processing and calculations to a web worker to prevent blocking the main thread and maintaining responsiveness. 5. Debouncing/Throttling: Limit the frequency of updates during events like zooming or panning to avoid overwhelming the browser.
Furthermore, be mindful of DOM manipulation overhead. Minimize unnecessary DOM updates. Instead of recreating elements, update their attributes. If DOM manipulation is still a bottleneck, consider strategies like using requestAnimationFrame to batch updates or using a virtual DOM approach to reduce the number of actual DOM changes. For example:
requestAnimationFrame(() => {
 // Perform DOM updates here
});
2. Describe a scenario where you would choose to use D3.js over other charting libraries like Chart.js or Highcharts.
I would choose D3.js over Chart.js or Highcharts when I need highly customized and interactive visualizations that go beyond standard chart types. For example, if I'm visualizing a complex network graph with custom node shapes, dynamic links, and intricate interactions upon hovering or clicking, D3.js would be the preferred choice. The other libraries offer pre-built chart types, which are good for rapid development but lack the granular control D3.js offers.
D3.js excels when you need fine-grained control over every aspect of the visualization, including data binding, transitions, and animations. The declarative approach also allows for greater control over the way data is displayed and modified. While it demands a steeper learning curve, the flexibility and power it provides are unparalleled for creating unique and data-driven visual experiences. For instance, the creation of a custom geographic projection, a Sankey diagram, or any other visualization not natively available in other libraries would make D3 the correct choice.
3. Explain how you would implement interactive features such as tooltips, zooming, and panning in a D3.js visualization.
To implement interactive features in D3.js, you'd typically use event listeners and D3's built-in behavior modules. For tooltips, you'd attach mouseover, mousemove, and mouseout event listeners to the elements you want to add tooltips to. On mouseover or mousemove, you'd update the position and content of a tooltip div element. On mouseout, you'd hide the tooltip. For zooming and panning, D3 provides a d3.zoom() behavior. You apply this behavior to a selection (usually the SVG element). The zoom behavior automatically handles mouse wheel and drag events to scale and translate the visualization. You can then use transform attribute to apply these changes to the visual elements.
For example, to implement zoom, you can do something like:
const zoom = d3.zoom()
  .scaleExtent([0.5, 10]) // Optional: Set zoom limits
  .on('zoom', (event) => {
    svg.attr('transform', event.transform);
  });

svg.call(zoom);
This code sets up a zoom behavior and applies it to the SVG. When the user zooms, the transform attribute of the SVG (or a group within it) is updated, effectively zooming the entire visualization.
4. How do you handle transitions and animations in D3.js to create smooth and engaging user experiences?
D3.js makes transitions smooth using the .transition() method, which interpolates changes between start and end states over a specified duration. You can chain .duration() to control the speed, .delay() to offset the start, and .ease() to determine the pacing of the animation (e.g., easeLinear, easeBounce). For example, selection.transition().duration(500).delay(100).ease(d3.easeBounce).attr('cx', newX); moves a circle to a new x-coordinate with a bounce effect.
To enhance user experience, consider using meaningful easing functions, avoiding overly long durations that might feel sluggish, and choreographing multiple transitions to create complex animations. Staggering transitions for multiple elements can prevent a jarring, simultaneous change. You can also use callback functions like .on('end', function() { ... }) to trigger subsequent actions after a transition completes.
5. Discuss your approach to testing D3.js visualizations, including unit tests and integration tests.
My approach to testing D3.js visualizations involves both unit and integration tests. For unit tests, I focus on individual D3 components or functions. I use testing frameworks like Jest or Mocha along with assertion libraries like Chai to verify that these functions produce the expected output given specific input data. For example, I might test a function that calculates bar chart heights based on data, ensuring it returns the correct values for different data points. Mocking is used to isolate the functions under test from external dependencies, such as the DOM.
Integration tests ensure that the different parts of the visualization work together correctly. These tests often involve rendering the D3 visualization in a headless browser environment (using tools like Puppeteer or Cypress) and then using DOM querying to verify that the visualization is rendered as expected. This includes checking the presence and attributes of SVG elements (e.g., circles, rectangles, lines), verifying data bindings, and ensuring interactions (e.g., mouseover effects, click handlers) function correctly. Visual regression testing can also be incorporated to catch unintended changes to the appearance of the visualization. npm test would be used to execute the test suites.
6. How would you integrate D3.js visualizations into a modern web application framework like React, Angular, or Vue.js?
Integrating D3.js with modern web frameworks like React, Angular, or Vue.js involves managing the DOM lifecycle effectively. Since these frameworks use a virtual DOM, directly manipulating the DOM with D3.js can lead to conflicts. The key is to let the framework handle the overall structure and data flow, while delegating specific, targeted DOM manipulations to D3.
For example, in React, you'd typically use React refs to target a specific DOM element where D3.js will operate. The useEffect hook is crucial for managing the D3 lifecycle. Inside useEffect, you can initialize the D3 visualization when the component mounts, update it when the data changes (using dependency array), and clean up any resources when the component unmounts. Data binding and event handling are generally managed by React, with D3 primarily used for visual encoding and complex calculations. Use d3.select(this.node) with ref={(node) => this.node = node} in the React component to target an element for D3 manipulation, where this.node is the DOM element. Consider using a library to help in the process if necessary.
7. Describe your experience with creating custom D3.js components or reusable charts.
I've created several custom D3.js components and reusable charts, primarily focusing on modularity and reusability. For example, I built a time series chart component that accepts data, axis labels, colors, and tooltips as configurable parameters. This allowed me to instantiate the same chart with different datasets and styling options across multiple views in a dashboard application. I often use D3's update pattern, enter/exit selections for efficient DOM manipulation when data changes. I also use functions to wrap D3 code to encapsulate the chart logic.
To make these components truly reusable, I also package them as Javascript modules using ES modules and exposed a clear API for configuration and data binding. For more complex charts, I would create custom scales and axes to suit the specific data being visualized. I've also used d3-selection, d3-scale, and d3-axis extensively in creating these components. I would define reusable update functions which are called when the data or configuration changes. This makes it easier to maintain the code, and adapt the charts to new requirements.
8. Explain how you would use D3.js to create a map-based visualization (e.g., a choropleth map) and handle geographic data.
To create a map-based visualization with D3.js, I'd start by loading the necessary geographic data, typically in GeoJSON format, using d3.json(). This data contains the geometries (shapes) and properties of geographic features like countries or states. Then, I'd use D3's geoPath() function to transform these geometries into SVG path elements that can be rendered on the screen. The geoPath() function requires a projection (e.g., Mercator or Albers) which is configured using d3.geoMercator() or other suitable projections, scaling and translating the map to fit the SVG container.
For a choropleth map, I'd bind the geographic data to SVG path elements using D3's data join. I would then define a color scale using d3.scaleQuantize() or d3.scaleThreshold() to map data values (e.g., population density) to a range of colors. The fill attribute of each path would be set based on the corresponding data value and the color scale. I'd add interactivity using D3's event handling, for instance, to display tooltips with feature properties on mouseover. For example:
d3.json("path/to/your/geo.json").then(data => {
 const projection = d3.geoMercator().fitSize([width, height], data);
 const path = d3.geoPath().projection(projection);
 svg.selectAll("path")
 .data(data.features)
 .enter().append("path")
 .attr("d", path)
 .attr("fill", d => colorScale(dataValue(d))); // Assuming colorScale is defined
});
9. How would you approach debugging performance issues in a complex D3.js visualization?
Debugging D3.js performance issues requires a systematic approach. First, identify the bottleneck. Use the browser's developer tools (performance tab) to profile the visualization. Look for long running tasks, excessive garbage collection, or frequent reflows/repaints.
Once identified, apply optimization techniques. These might include: * Data Reduction: Simplify or aggregate data where possible. * Debouncing/Throttling: Limit the frequency of updates based on events. * Virtualization: Only render visible elements. * Caching: Store frequently computed values. * Code Optimization: Ensure D3 selections and transitions are efficient. Use console.time() and console.timeEnd() to measure the execution time of specific code blocks. Examine your data joins using key functions to ensure D3 is efficiently updating elements rather than unnecessarily recreating them. Finally, consider hardware acceleration by using transform: translateZ(0) (or will-change) on appropriate elements.
10. Describe how you have used D3.js to solve a specific data visualization problem in a past project.
In a recent project, I used D3.js to visualize the performance of different machine learning models. The raw data consisted of evaluation metrics like accuracy, precision, recall, and F1-score for each model. My goal was to create an interactive dashboard that would allow users to easily compare model performance across different metrics.
I used D3 to create a scatter plot where each point represented a model. The x and y axes represented two different performance metrics selected by the user (e.g., accuracy vs. precision). I implemented interactive tooltips that displayed the model name and all the performance metrics when hovering over a point. Also, D3's scaling functions were used to map the data values to pixel coordinates on the screen, and the axes were dynamically updated based on the chosen metrics. The chart was also made responsive using D3's selection.attr and window.onresize to adjust the visualization dimensions when the browser window size changed.
11. How do you manage the trade-offs between performance, maintainability, and code complexity when developing D3.js visualizations?
When developing D3.js visualizations, balancing performance, maintainability, and code complexity involves several strategies. For performance, I prioritize data reduction (using .filter() or .map() efficiently), optimize DOM manipulation by minimizing updates, and leverage techniques like using virtual DOM implementations or canvas rendering for very large datasets where appropriate. I also profile the code using browser developer tools to identify performance bottlenecks and address them specifically.
To enhance maintainability and reduce complexity, I adhere to modular design principles by breaking down the visualization into reusable components. I document the code clearly. I also choose appropriate data structures, favor declarative D3 methods where possible, and use data binding effectively. Code reviews and consistent style guidelines are also crucial for maintainability. For example, instead of chaining everything into one long statement:
//Bad
d3.select('body').selectAll('div').data(data).enter().append('div').style('height', function(d) { return d + 'px'; });

//Good
const divs = d3.select('body').selectAll('div').data(data);
divs.enter().append('div').style('height', d => `${d}px`);
This makes it more readable and maintainable.
12. Explain the concept of 'enter', 'update', and 'exit' selections in D3.js and how they are used to manage data updates.
In D3.js, when you bind data to elements using .data(), D3 identifies three groups of elements: 'enter', 'update', and 'exit'. The 'enter' selection represents data points for which no corresponding DOM elements exist. You typically use this to create new elements (e.g., enter().append('div')). The 'update' selection represents existing DOM elements that have corresponding data points. This is used to modify existing elements to reflect the updated data (e.g., changing attributes or text content). The 'exit' selection represents DOM elements for which there are no longer corresponding data points. This is used to remove elements that are no longer needed (e.g., exit().remove()).
These selections allow D3 to efficiently manage data updates. By explicitly separating the creation, modification, and removal processes, D3 provides a clear and performant way to synchronize the DOM with the underlying data. For example:
// Example using D3 selections
const circles = svg.selectAll('circle').data(data);

// Enter
circles.enter().append('circle')
  .attr('r', 5);

// Update
circles.attr('cx', d => d.x)
  .attr('cy', d => d.y);

// Exit
circles.exit().remove();
13. How would you implement a brush and zoom interaction in D3.js, allowing users to select a region of a chart to zoom in on?
To implement brush and zoom in D3.js, first, define a brush using d3.brushX() or d3.brushY() (or d3.brush() for both). Attach it to a g element in your SVG. Then, define a zoom behavior using d3.zoom(). Within the brush's brush.end event handler, determine the selected region using d3.event.selection. Use this selection to calculate the new domain for your x and y scales. Finally, update the chart's elements with the rescaled data and apply the zoom transform to the chart's g element using selection.transition().call(zoom.transform, d3.zoomIdentity.scale(newScale).translate(newTranslate)) where newScale and newTranslate are derived from the brush selection to effectively 'zoom' into the brushed area.
To link the zoom behavior, call the zoom on the root svg element using svg.call(zoom). To reset the zoom, add a double click handler that calls svg.transition().call(zoom.transform, d3.zoomIdentity).
const brush = d3.brushX()
    .extent([[0, 0], [width, height]])
    .on("end", brushed);

svg.append("g")
    .call(brush);

const zoom = d3.zoom()
    .scaleExtent([1, 32])
    .translateExtent([[0, 0], [width, height]])
    .on("zoom", zoomed);

function brushed() {
  if (!d3.event.selection) return;
  // Calculate and apply the zoom based on the selection
}
14. Describe your experience with creating accessible D3.js visualizations that meet accessibility standards (e.g., WCAG).
My experience with accessible D3.js visualizations involves several techniques to ensure they meet WCAG standards. I focus on providing semantic HTML structure wherever possible, using appropriate ARIA attributes to convey information to screen readers. This includes adding role="img" to the SVG container and using aria-label or aria-describedby to provide a textual description of the visualization's purpose and key data points. For interactive elements, I ensure proper keyboard navigation and focus management. Data representation also plays a significant role; using sufficient color contrast, clear labels, and providing alternative text descriptions for chart elements, especially for users with visual impairments are key aspects.
Specifically, I have used tools like eslint-plugin-jsx-a11y in projects using React and D3 to ensure ARIA attributes and other accessibility features are correctly implemented. Consider this example:
<svg role="img" aria-labelledby="chart-title chart-desc">
  <title id="chart-title">Sales Data</title>
  <desc id="chart-desc">A bar chart showing sales data for the last quarter.</desc>
  <!-- D3.js generated chart elements here -->
</svg>
I also provide options for users to customize the visualization, such as increasing font sizes or switching to a high-contrast color scheme to improve usability for all users. Regular testing with screen readers like NVDA or VoiceOver is critical to validate accessibility implementations.
15. How would you handle different data formats (e.g., CSV, JSON, GeoJSON) when loading data into D3.js?
D3.js provides helper functions to load various data formats. Use d3.csv() for CSV, d3.json() for JSON and GeoJSON. For other formats, you might need to parse the data manually using JavaScript's built-in methods or external libraries before passing it to D3.
For example:
d3.csv("data.csv").then(data => {
  // Process CSV data
});

d3.json("data.json").then(data => {
  // Process JSON data
});
If you have a custom format, you can use d3.text() or d3.blob() to load the data as a string or binary data, respectively, and then parse it using appropriate JavaScript methods or external libraries.
16. Explain how you would use D3.js to create a network graph or force-directed graph visualization.
To create a network graph with D3.js, I would first prepare my data as a JSON object with nodes and links arrays. Each node would have properties like id and group, and each link would have source and target properties referencing the node IDs. Then, I'd create an SVG element to hold the graph. A force simulation is created using d3.forceSimulation() to define forces like d3.forceManyBody(), d3.forceLink(), and d3.forceCenter(). Nodes and links are then created as SVG elements (circles and lines, respectively), bound to the data, and their positions are updated on each tick of the simulation using the tick event handler. Styling (colors, sizes) can be applied based on node/link properties.
Specifically, the d3.forceLink() is configured to use the links data with .links(data.links), and d3.forceSimulation()'s .nodes(data.nodes) passes in the nodes. The tick function updates the cx and cy attributes for nodes, and x1, y1, x2, y2 attributes for links, based on the evolving positions calculated by the force simulation. This entire process results in a visually appealing, interactive force-directed graph.
17. How would you approach styling D3.js visualizations using CSS and avoid conflicts with other styles on the page?
To style D3.js visualizations with CSS and prevent conflicts, I'd use these strategies:
- CSS Classes: Apply unique CSS classes to D3 elements. For example, instead of directly styling
rect, use.barif styling a bar chart. Then, define styles specifically for.barwithin a dedicated CSS file or<style>block. CSS cascade and specificity rules will apply naturally. - Namespaces/Prefixes: Prefix class names (e.g.,
d3-chart-bar) to ensure they're unique and less likely to clash with other styles on the page. This provides better namespacing. - Shadow DOM (advanced): For complex visualizations, consider using Shadow DOM (if browser support is adequate). It encapsulates styles, preventing them from leaking out and affecting the rest of the document, or vice-versa. Styles within a Shadow DOM are scoped to that DOM.
18. Describe your experience with using D3.js modules and plugins to extend the functionality of the library.
I have used D3.js modules to organize and extend its functionality. For instance, I've employed the d3-selection module independently for DOM manipulation without loading the entire D3 library. I also utilized d3-scale and d3-axis for creating and rendering scales and axes in my visualizations, improving code modularity.
While I haven't extensively used third-party plugins, I'm familiar with the concept. When needing specific chart types or interactions not readily available in core D3, exploring and integrating a well-maintained plugin would be my approach. This would involve understanding the plugin's API and ensuring compatibility with my D3 version and project structure.
19. How would you implement a dashboard using D3.js, including multiple charts and interactive elements?
To implement a D3.js dashboard with multiple charts and interactive elements, I would start by structuring the HTML with dedicated <div> elements for each chart. Then, I would use D3.js to load and process the data, creating scales, axes, and chart elements (bars, lines, etc.) within each <div>. Interaction would be added using D3's event handling (.on()) to respond to user actions like clicks or mouseovers, updating other charts or displaying tooltips as needed. I'd likely use a modular approach, creating reusable functions for chart creation and data binding, making the code more maintainable.
For example, a bar chart's update function might look like this:
function updateBarChart(data) {
  svg.selectAll(".bar")
    .data(data)
    .join("rect")
    .attr("class", "bar")
    .attr("x", d => xScale(d.x))
    .attr("y", d => yScale(d.y))
    .attr("width", xScale.bandwidth())
    .attr("height", d => height - yScale(d.y));
}
I'd also consider using a layout library like Grid.js or a similar CSS grid system for dashboard arrangement.
20. Explain how you would use D3.js to create a treemap visualization and handle hierarchical data.
To create a treemap visualization with D3.js, I'd start by preparing the hierarchical data in a nested JSON format, where each node represents a category or subcategory with a 'name' and 'children' property (containing its subnodes). The leaf nodes should have a 'value' property representing the size of the rectangle.
Next, I would use D3's d3.treemap() layout to compute the position and dimensions of each rectangle. This involves specifying the size of the treemap container, setting the padding between nodes, and using the .hierarchy() method to transform the JSON data into a D3 hierarchy. Finally, I'd create SVG rectangles for each node, binding the data to the elements and setting their x, y, width, and height attributes based on the treemap layout's computed values. Color can be used to differentiate categories.
21. How do you ensure cross-browser compatibility when developing D3.js visualizations?
Ensuring cross-browser compatibility with D3.js visualizations involves several strategies. First, thoroughly test visualizations across major browsers (Chrome, Firefox, Safari, Edge) and their respective versions. Use browser developer tools to identify and address rendering inconsistencies, JavaScript errors, or CSS conflicts. A common approach is to implement feature detection or use polyfills for specific browser functionalities that D3.js might rely on, ensuring consistent behavior across different environments. Also, using standardized SVG attributes and CSS properties can reduce cross-browser rendering differences.
Specifically, carefully consider the use of CSS selectors and JavaScript methods to use broadly supported options. For example, avoid browser-specific prefixes, rely on standardized properties, and test with tools like BrowserStack or Sauce Labs to automate cross-browser testing. When using specific D3.js features (e.g., transitions, animations), verify their rendering behavior on older browsers and apply appropriate fallbacks or adjustments as needed.
22. Describe your experience with using D3.js to create visualizations for mobile devices or responsive layouts.
My experience with D3.js for mobile and responsive layouts involves using techniques like d3.scale to dynamically adjust visualization elements based on screen size. I've used d3.select(window).on('resize', ...) to re-render visualizations when the viewport changes. Furthermore, I ensure the SVG canvas is responsive by setting its viewBox and using CSS to control its width and height (e.g., width: 100%; height: auto;).
Specifically, I’ve tackled challenges like adapting font sizes and element spacing for smaller screens, often employing conditional logic to display simpler versions of visualizations on mobile. I use media queries in conjunction with javascript logic to conditionally load or render different visual elements based on the detected screen size. For example:
if (window.innerWidth < 768) {
  // Render mobile-friendly visualization
}
23. How would you handle errors and exceptions in a D3.js visualization and provide informative feedback to the user?
Error handling in D3.js visualizations involves wrapping potentially problematic D3 code within try...catch blocks. The catch block can then handle errors gracefully, preventing the entire visualization from crashing. For example, errors during data loading using d3.json() or d3.csv() should be caught. Displaying informative messages to the user (e.g., using a dedicated div element or an alert) is crucial.
To provide informative feedback, the error message should be user-friendly and, if possible, suggest solutions. For instance:
Data loading errors: Display "Failed to load data. Please check the file path or data format." instead of a cryptic JavaScript error. Include details in the console for developers.
Missing data fields: If a required data field is missing, show "Missing data field: [field name]. Visualization may be incomplete." and consider a fallback value or removing the element that uses that field. Use
console.warn()for logging. Use conditional rendering or default values to prevent the visualization from breaking.Invalid input from users: Validate inputs and display error messages such as "Invalid input. Please enter a number between X and Y." before attempting to use the data for visualization changes.
d3.json("data.json")
  .then(data => { /* visualization code */ })
  .catch(error => {
    console.error("Error loading data:", error);
    d3.select("#error-message").text("Failed to load data. Please check the file path.");
  });
24. Explain how you would use D3.js to create a Sankey diagram visualization and represent flow data.
To create a Sankey diagram with D3.js, I'd start by structuring my data into a JSON format with nodes (representing the entities) and links (representing the flow between them, including source, target, and value). Then, I'd use D3's Sankey layout (d3.sankey()) to calculate the position and dimensions of each node and link based on the data and desired diagram size. I'd bind this data to SVG elements, creating rectangles for the nodes and curved paths for the links. The d3.sankeyLinkHorizontal() function can be used to generate the link paths. Styling, such as color, could be applied based on node or link properties. Tooltips or interactions can enhance user understanding of the flow data.
Specifically the code would look something like this:
const sankey = d3.sankey()
    .nodeWidth(15)
    .nodePadding(10)
    .size([width, height]);

const link = svg.append("g")
    .selectAll(".link")
    .data(graph.links)
    .enter().append("path")
    .attr("class", "link")
    .attr("d", d3.sankeyLinkHorizontal())
    .attr("stroke-width", function(d) { return Math.max(1, d.width); });
25. How do you keep up-to-date with the latest developments and best practices in D3.js and data visualization?
I stay current with D3.js and data visualization through a combination of online resources and community engagement. This includes:
- Following key blogs and websites: I regularly check sites like ObservableHQ, Towards Data Science (for relevant articles), and specific D3.js tutorial sites.
- Monitoring D3.js's official GitHub repository: This allows me to track new releases, bug fixes, and discussions.
- Engaging with the D3.js community: I participate in forums like Stack Overflow and Reddit (r/dataisbeautiful, r/d3js) to learn from others and share my knowledge.
- Taking online courses/tutorials: Platforms like Udemy and Coursera often have updated courses on D3.js and data visualization principles. I also review Mike Bostock's examples on Observable and his older (but still relevant) bl.ocks.org examples.
- Reading books: such as Interactive Data Visualization for the Web.
- Experimenting with new techniques: I set aside time to experiment with new features and libraries related to D3.js, applying them to personal projects or code sandboxes (e.g., CodePen) to solidify my understanding. This hands-on approach is crucial for truly understanding the latest advancements. Also reviewing the source code for popular D3 plugins often provides insights.
D3.js MCQ
Question 1.
Which of the following statements best describes the purpose of scales in D3.js?
Options:
Question 2.
Which of the following best describes how D3.js transitions work?
options:
Options:
Question 3.
In D3.js, what does the enter() selection typically represent?
Options:
Question 4.
Which of the following D3.js methods is primarily used to bind data to DOM elements?
Options:
Question 5.
Which of the following D3.js code snippets correctly sets the background color of all paragraph elements to 'lightblue'?
Options:
Question 6.
You are creating a bar chart using D3.js. You have data bound to rect elements representing the bars. Assuming you have a linear scale named yScale that maps your data values to pixel heights, which of the following code snippets correctly sets the height of each bar based on the corresponding data value? The yScale domain is set up such that it outputs the y coordinate where the bar should START. You need to take the difference between the total chart height and the yScale to find out the height of the bar. Assume height is the total height of the chart.
Options:
Question 7.
You want to create a scatter plot using D3.js. You have your data bound to circles. Which of the following code snippets correctly positions the circles on the x-axis using a scale named xScale and the cx attribute?
Options:
Question 8.
Which of the following D3.js code snippets correctly adds a click event listener to all circle elements that, when clicked, changes the fill color of the clicked circle to red?
options:
Options:
Question 9.
Which of the following D3.js code snippets correctly appends a y-axis to an SVG element, assuming you have a scale named yScale?
Options:
Question 10.
Which of the following D3.js code snippets correctly creates a color scale that maps a domain of [0, 100] to a range of colors from red to blue?
options:
Options:
Question 11.
Which of the following approaches is most appropriate for adding tooltips to D3.js elements (e.g., circles in a scatter plot) that display information on hover?
options:
Options:
Question 12.
Which D3.js layout is most suitable for visualizing hierarchical data, such as file systems or organizational charts, where nodes are positioned based on their parent-child relationships?
Options:
Options:
Question 13.
When using D3.js's force simulation layout, which parameter directly controls the strength of the attraction or repulsion between nodes?
Options:
Options:
Question 14.
Which of the following D3.js code snippets correctly updates the text content of paragraph elements (<p>) to display the associated data values?
Options:
Options:
Question 15.
You are creating a line chart using D3.js. Which of the following methods is most appropriate to generate the d attribute of a <path> element, effectively drawing the line based on your data?
Options:
Question 16.
Which of the following D3.js code snippets correctly generates an arc path for a pie chart segment, where d represents the data bound to each segment?
Options:
Question 17.
You are creating a visualization that maps categorical data (e.g., product names: 'A', 'B', 'C') to distinct positions on the x-axis. Which type of D3 scale is most appropriate for this task?
options:
Options:
Question 18.
In D3.js, which of the following code snippets correctly creates and applies a logarithmic scale to a domain of [1, 100] and a range of [0, 500]?
Options:
Question 19.
You're creating a pie chart with D3.js. You have your data and have set up the arc generator. Which of the following code snippets correctly positions each slice of the pie chart in the SVG?
Options:
Question 20.
You're creating a stacked bar chart with D3.js. You have data structured as an array of objects, where each object represents a category and contains properties for different sub-categories to be stacked. Which D3.js layout function is most appropriate for preparing your data for creating a stacked bar chart?
Options:
Question 21.
Which of the following D3.js code snippets correctly creates a histogram from a dataset, where 'data' is an array of numerical values, and 'svg' is a D3 selection of an SVG element?
Options:
Question 22.
Which of the following code snippets correctly creates a bubble chart using D3.js, where the size of each circle (bubble) is determined by a value in the dataset called 'volume'? Assume data is an array of objects, and svg is a D3 selection of an SVG element.
options:
Options:
Question 23.
You want to apply a custom color scheme to a set of circles in your D3.js visualization, where the colors are defined in an array ['#FF0000', '#00FF00', '#0000FF']. Assuming your data is bound to the circles, which of the following code snippets correctly applies these colors sequentially to the circles based on their index?
Options:
Question 24.
Which of the following D3.js code snippets correctly implements a zoom behavior that allows panning and scaling of a visualization?
Options:
Question 25.
Which of the following D3.js code snippets correctly creates a time scale that maps JavaScript Date objects to pixel values?
Options:
Which D3.js skills should you evaluate during the interview phase?
It's impossible to gauge everything about a candidate in a single interview. However, for D3.js roles, certain skills are more indicative of success than others. Evaluating these core competencies will help you identify the best fit for your team.
Data Binding
Gauge a candidate's grasp of data binding concepts with a dedicated assessment. A test like Adaface's D3.js online test includes relevant MCQs to filter for this skill.
To assess their data binding skills, consider asking a targeted interview question. This can help you understand how they approach practical problems related to this D3.js fundamental.
Describe a scenario where you would use different types of data binding in D3.js (e.g., enter, update, exit). Explain why you chose each method.
Look for an understanding of when to use enter for new elements, update for existing elements, and exit for removing elements. The candidate should be able to articulate the benefits of each approach in different data-driven scenarios.
Scales and Axes
A well-designed assessment can help identify candidates with strong understanding of scales and axes. You can use the D3.js assessment to pre-screen candidates based on this D3.js skill.
Ask targeted questions to assess how well they can use scales and axes. This will shed light on their understanding of data mapping and visual representation in D3.js.
Explain how you would create a logarithmic scale in D3.js and why you might choose to use one over a linear scale.
The candidate should demonstrate knowledge of the d3.scaleLog() function and its application. Look for them to explain the benefits of logarithmic scales for handling data with wide ranges or skewed distributions.
Transitions and Animations
An assessment test can help filter candidates with knowledge of transitions and animations. Check out Adaface's D3.js online test for questions on these concepts.
A targeted interview question can reveal how well they can apply transitions and animations in practical situations. This helps assess their ability to create engaging visualizations.
Describe how you would create a transition to smoothly change the color of a bar in a bar chart when its value is updated.
Look for an understanding of D3.js's transition API (selection.transition()) and its usage with attributes like style or attr. The candidate should mention setting the duration and easing function for the animation to control its smoothness.
3 Tips for Using D3.js Interview Questions
Before you put everything you've learned into practice, let's look at a few tips. These tips will help you get the most out of your D3.js interview questions and make the hiring process smoother.
1. Leverage Skill Assessments to Filter Candidates
Skill assessments are great for filtering candidates early in the hiring process. They help you quickly identify individuals with the core D3.js and related skills needed for the role.
Using a tool like the Adaface D3.js online test lets you measure a candidate's practical knowledge and coding abilities. You can also consider using a broader front-end developer test to evaluate complementary skills.
The process is straightforward: send out the assessment link after sourcing candidates and review the results. This saves valuable interview time by ensuring you only speak with candidates who meet the minimum technical requirements.
2. Outline Targeted Interview Questions
Time is valuable, so make every interview question count. Carefully select a mix of relevant questions to efficiently assess a candidate's D3.js expertise and related skills.
To evaluate skills alongside D3.js, explore interview questions related to front-end development or even soft skills like communication.
The goal is to identify candidates with the depth and breadth to truly excel. Pick questions that matter, and you will improve your interview efficiency
3. Ask Follow-Up Questions to Gauge Depth
Simply asking interview questions isn't always enough to gauge a candidate's true understanding. Always be ready with targeted follow-up questions.
Follow-up questions help you uncover whether a candidate truly grasps the concepts or is simply providing surface-level answers. For example, after asking a candidate to explain a D3.js selection, you could follow up with, "Can you describe a situation where you would use a different type of selection? Why?". This helps determine the depth of their knowledge and practical experience.
Hire D3.js Developers with Confidence: Skills Tests and Interview Questions
Looking to hire developers with strong D3.js skills? Accurately assessing their abilities is key. Using skills tests is the most effective way to evaluate candidates' proficiency. Explore our D3.js Online Test and Front-End Developer Test to identify top talent.
Once you've identified promising candidates through skills tests, streamline your interview process. Shortlist the best applicants and invite them for focused interviews. Ready to get started? Sign up today to begin assessing your candidates.
D3.JS Online Test
40 mins | 17 MCQs
The D3.js online test uses scenario-based multiple-choice questions to evaluate a candidate's knowledge and skills related to D3.js fundamentals, data binding and manipulation, scales and axes, SVG and Canvas graphics, event handling, transitions and animations, and integrating D3.js with other web technologies. Candidates are also evaluated on their ability to write efficient and reusable code, design and implement complex visualizations, and troubleshoot and debug common issues.
Try D3.JS Online Test
Download D3.js interview questions template in multiple formats
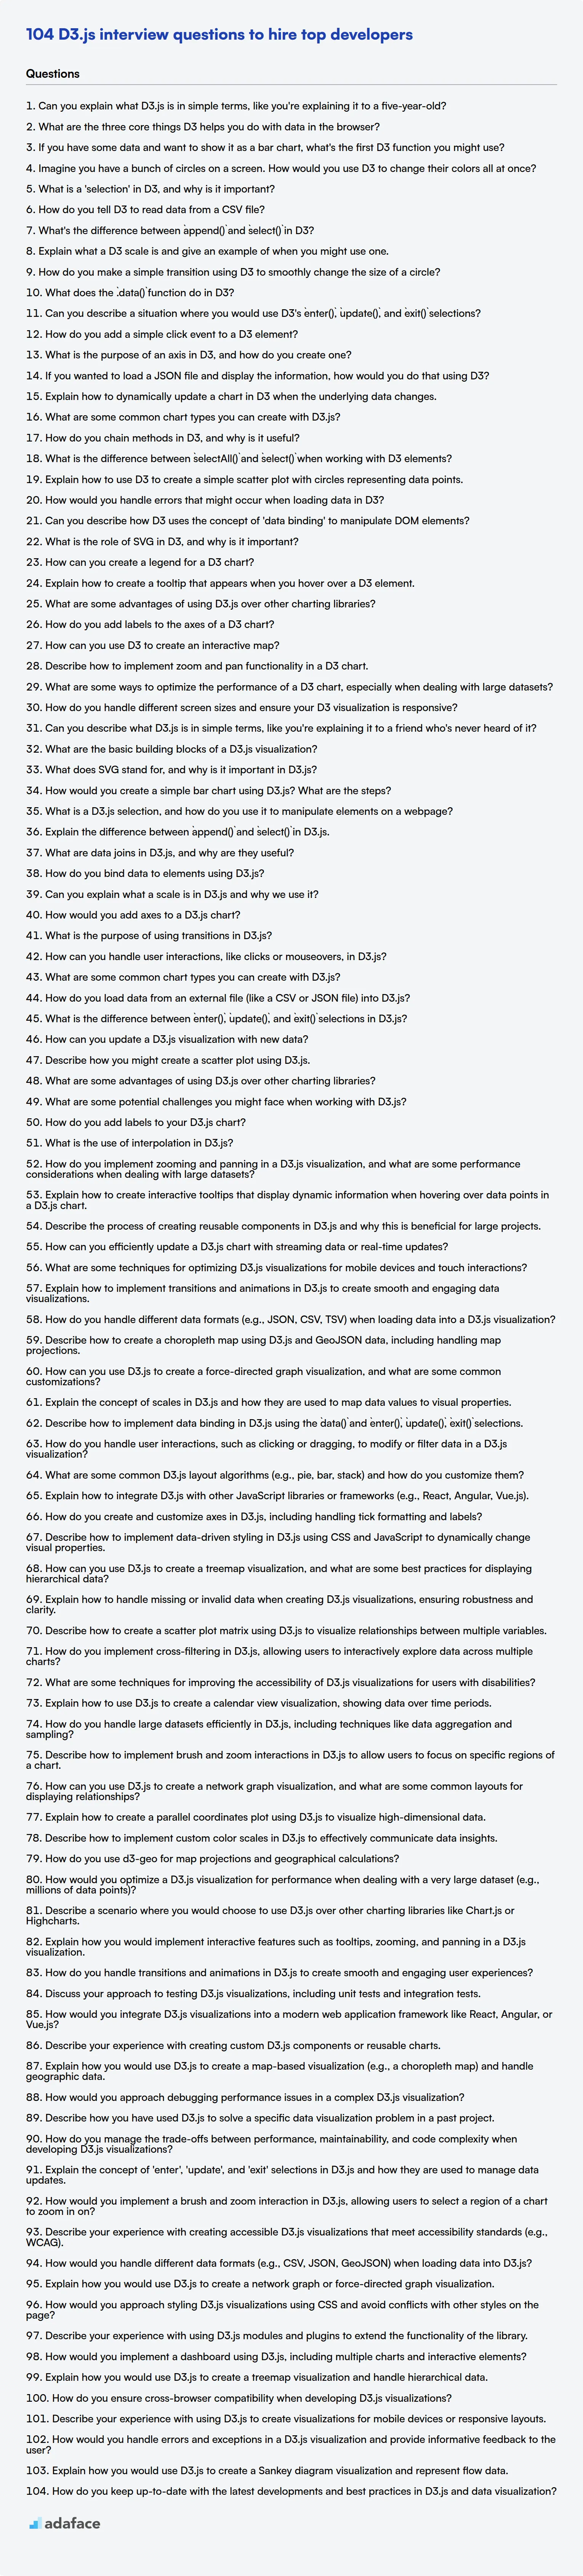
D3.js Interview Questions FAQs
What are some common D3.js interview questions for freshers?
Common questions for freshers often cover basic D3.js concepts like selections, data binding, and creating simple charts.
What kind of D3.js questions should I ask junior developers?
For junior developers, focus on questions that assess their understanding of scales, axes, and handling events in D3.js.
What D3.js topics are important for intermediate-level interviews?
Intermediate interviews should cover more advanced topics such as transitions, animations, layouts, and working with different data formats.
What D3.js knowledge should experienced developers demonstrate in an interview?
Experienced developers should be able to discuss performance optimization, custom chart creation, and integrating D3.js with other frameworks.
How can I effectively use D3.js interview questions during the hiring process?
Prepare a mix of theoretical and practical questions, and always encourage candidates to explain their reasoning and approach to problem-solving.
Besides interview questions, what else should I use to evaluate D3.js skills?
Skills tests or coding challenges can provide objective assessments of candidates' D3.js abilities, complementing interview questions.
40 min skill tests.
No trick questions.
Accurate shortlisting.
We make it easy for you to find the best candidates in your pipeline with a 40 min skills test.
Try for freeRelated posts
Free resources

Join 1200+ companies in 80+ countries.
Try the most candidate friendly skills assessment tool today.

40 min tests.
No trick questions.
Accurate shortlisting.
No trick questions.
Accurate shortlisting.