
DevOps interview questions for freshers
1. Can you describe what DevOps is in simple terms, like you're explaining it to a friend?
2. What are some of the benefits of using DevOps practices?
3. Have you heard of the term 'CI/CD'? What does it mean to you?
4. What is 'Infrastructure as Code', and why is it useful?
5. Can you name a few tools used in DevOps, and what they are used for?
6. What does 'version control' mean, and why is it important in software development?
7. Have you ever used any cloud platforms like AWS, Azure, or GCP? What did you do?
8. If a website is running slow, how would you go about figuring out what's wrong?
9. What is the difference between 'monitoring' and 'logging' in a system?
10. What is containerization, and why is it helpful? Can you name any containerization platform?
11. What is the importance of automation in DevOps?
12. What is your understanding of the software development lifecycle, and how does DevOps fit into it?
13. If you encounter a problem during deployment, what steps would you take?
14. Have you ever worked with a team where developers and operations worked closely together? What was it like?
15. What are some ways to ensure the security of a system in a DevOps environment?
16. How would you test code before deploying it to production?
17. What is the difference between Continuous Integration, Continuous Delivery, and Continuous Deployment?
18. Explain the concept of 'Infrastructure Automation'.
19. Describe a situation where collaboration between developers and operations was crucial to solving a problem.
20. What is the importance of 'feedback loops' in DevOps, and how can they be implemented?
21. How does DevOps help in faster software releases?
22. What are the key differences between Agile and DevOps methodologies?
23. How would you handle a situation where a new feature causes an unexpected issue in production?
24. Can you explain the role of configuration management tools in DevOps?
25. What are some metrics you would use to measure the success of a DevOps implementation?
26. What does it mean to 'scale' an application, and how does DevOps support scaling?
27. What's your take on 'DevSecOps', and why is security important in the DevOps pipeline?
28. How do you stay updated with the latest trends and technologies in DevOps?
29. Explain the concept of 'Blue-Green Deployments' and their benefits.
30. What are some of the challenges you anticipate facing in a DevOps role, and how would you overcome them?
DevOps interview questions for juniors
1. Imagine servers are like LEGO houses. How would you ensure each new house (server) is built exactly the same way, every single time?
2. What's the difference between 'testing' your code and 'monitoring' it after it's running? Think of it like checking a toy before and after a kid plays with it.
3. If you had a magic wand to automate one thing in software development, what would it be and why?
4. Why is it important for developers and operations teams to work together, instead of separately?
5. What is 'infrastructure as code' in simple terms?
6. Can you describe a situation where automation helped you solve a problem?
7. How would you explain the cloud to someone who has never heard of it?
8. What is a virtual machine?
9. What are containers?
10. Explain the concept of CI/CD.
11. What is a 'pipeline' in DevOps?
12. What's your favorite tool for automating tasks, and why?
13. If a website is slow, what are some things you'd check to figure out why?
14. What does it mean to 'version control' your code?
15. Why is it important to track changes to code?
16. What is the command line?
17. How does using the cloud help save money compared to using physical servers?
18. If you accidentally broke something in production, what's the first thing you'd do?
19. What's the difference between a bug, an error, and an incident?
20. Tell me about a time you had to learn something new quickly.
21. Why is security important in DevOps?
DevOps intermediate interview questions
1. How would you approach troubleshooting a slow-running application in a containerized environment?
2. Explain your experience with Infrastructure as Code (IaC) tools like Terraform or CloudFormation, detailing a complex infrastructure deployment you automated.
3. Describe a situation where you had to roll back a deployment due to unforeseen issues. What steps did you take to minimize the impact?
4. How do you ensure security is integrated into the DevOps pipeline, and what tools do you use for security scanning?
5. Explain your understanding of blue-green deployments and how they differ from canary deployments.
6. Describe a time you had to optimize a CI/CD pipeline for faster feedback and reduced build times.
7. How do you monitor the health and performance of your infrastructure and applications, and what alerting mechanisms do you use?
8. Explain your experience with container orchestration platforms like Kubernetes or Docker Swarm, highlighting your role in managing and scaling applications.
9. Describe a situation where you had to implement a disaster recovery plan. What were the key challenges and how did you overcome them?
10. How do you handle configuration management for different environments (e.g., development, staging, production)?
11. Explain your approach to implementing continuous testing in the DevOps pipeline, including the types of tests you would automate.
12. Describe a time you had to troubleshoot a network connectivity issue in a cloud environment.
13. How do you ensure compliance with security and regulatory requirements in your DevOps practices?
14. Explain your experience with log aggregation and analysis tools like ELK stack or Splunk.
15. Describe a situation where you had to automate the provisioning of resources in a multi-cloud environment.
16. How do you handle secrets management in your DevOps pipeline?
17. Explain your understanding of GitOps and how it differs from traditional CI/CD.
18. Describe a time you had to collaborate with developers and operations teams to resolve a complex production issue.
19. How do you measure the success of your DevOps initiatives and what metrics do you track?
20. Explain your approach to implementing Infrastructure as Code (IaC) testing and validation.
21. How do you manage and version control database schema changes in a DevOps environment?
DevOps interview questions for experienced
1. How would you design a CI/CD pipeline for a microservices architecture, considering independent deployments and versioning?
2. Explain your experience with infrastructure as code (IaC) tools beyond basic provisioning, including configuration management and drift detection.
3. Describe a situation where you had to troubleshoot a performance bottleneck in a distributed system. What tools and techniques did you use?
4. How do you approach security automation in a DevOps pipeline, and what security tools are you familiar with?
5. Explain your experience with container orchestration platforms like Kubernetes or Docker Swarm, including scaling, self-healing, and resource management.
6. Describe your experience with different monitoring and alerting tools, and how you would set up a comprehensive monitoring strategy for a complex application.
7. How do you handle database schema migrations in a DevOps environment with zero downtime?
8. Explain your experience with different cloud providers (e.g., AWS, Azure, GCP) and their specific DevOps services.
9. Describe a time when you had to automate a complex and manual process, and what challenges you faced.
10. How do you approach disaster recovery and business continuity planning in a DevOps environment?
11. Explain your understanding of different DevOps methodologies like Kanban, Scrum, or Lean, and how you have applied them in practice.
12. Describe your experience with implementing and managing service meshes like Istio or Linkerd.
13. How do you ensure compliance with regulatory requirements (e.g., GDPR, HIPAA) in a DevOps pipeline?
14. Explain your experience with implementing and managing secrets management solutions like HashiCorp Vault or AWS KMS.
15. Describe a situation where you had to resolve a conflict between developers and operations teams, and how you approached it.
16. How do you approach capacity planning and resource optimization in a cloud environment?
17. Explain your understanding of different networking concepts like VPCs, subnets, and load balancing, and how they relate to DevOps.
18. Describe your experience with implementing and managing blue-green deployments or canary releases.
19. How do you approach testing in a DevOps pipeline, including unit, integration, and end-to-end testing?
20. Explain your understanding of different security vulnerabilities like SQL injection, cross-site scripting, and denial-of-service attacks, and how to prevent them.
21. Describe a time when you had to debug a complex issue in a production environment under high pressure.
22. How do you approach building and maintaining a culture of automation within a team?
23. Explain your experience with different logging and log aggregation tools, and how you would set up a centralized logging system.
24. Describe your experience with implementing and managing GitOps workflows.
25. How do you ensure the quality and reliability of your infrastructure as code (IaC) configurations?
26. Explain your understanding of different container networking concepts like CNI and service discovery.
27. Describe a situation where you had to improve the efficiency of a DevOps pipeline, and what steps you took.
28. How do you approach monitoring and alerting for cloud costs and resource utilization?
29. Explain your experience with different configuration management tools like Ansible, Chef, or Puppet in complex environments.

Hiring DevOps engineers can be difficult because it requires a blend of technical skills and cultural understanding. To identify candidates who can truly bridge development and operations, you need a structured approach to your interviews.
This blog post offers a curated list of DevOps interview questions categorized by experience level, from freshers to experienced professionals, and includes a section of multiple-choice questions. The categories include questions for freshers, juniors, intermediate and experienced professionals as well as a MCQ section.
By using these questions, you'll be able to pinpoint candidates who not only understand the theory but can also apply it practically and for more accurate assessment, consider using Adaface's DevOps online test before interviews.
Table of contents
DevOps interview questions for freshers
DevOps interview questions for juniors
DevOps intermediate interview questions
DevOps interview questions for experienced
DevOps MCQ
Which DevOps skills should you evaluate during the interview phase?
Hire DevOps Experts with Skills Tests and Targeted Interview Questions
Download DevOps interview questions template in multiple formats
DevOps interview questions for freshers
1. Can you describe what DevOps is in simple terms, like you're explaining it to a friend?
Imagine developers building software and operations folks deploying and running it. Traditionally, these teams worked separately, often leading to delays and problems. DevOps is like bridging that gap – it's a way of working where developers and operations collaborate closely throughout the entire software lifecycle.
Think of it as a culture and a set of practices aimed at automating and streamlining the software development and release process. The goal is to deliver software faster, more reliably, and with higher quality. It involves things like continuous integration, continuous delivery, automation, and monitoring, allowing for faster feedback loops and quicker responses to issues.
2. What are some of the benefits of using DevOps practices?
DevOps offers numerous benefits, primarily centered around faster delivery, improved collaboration, and increased reliability.
Some key benefits include:
- Faster Time to Market: Automation and streamlined processes lead to quicker releases.
- Improved Collaboration: Breaks down silos between development and operations teams.
- Increased Reliability: Automated testing and monitoring reduce errors and downtime.
- Faster Feedback Loops: Continuous integration and continuous delivery (CI/CD) enable rapid feedback and improvements.
- Better Resource Utilization: Automation reduces manual effort and allows for efficient resource allocation.
3. Have you heard of the term 'CI/CD'? What does it mean to you?
Yes, I've heard of CI/CD. It stands for Continuous Integration and Continuous Delivery/Deployment. To me, it represents a set of practices and a philosophy aimed at automating and streamlining the software development and release process.
Essentially, CI focuses on automating the integration of code changes from multiple developers into a central repository. This often involves automated builds, testing, and code analysis. CD then takes things further by automating the release process, whether that means deploying to a staging environment (Continuous Delivery) or directly to production (Continuous Deployment). The goal is to make software releases more frequent, reliable, and less risky.
4. What is 'Infrastructure as Code', and why is it useful?
Infrastructure as Code (IaC) is the practice of managing and provisioning infrastructure through machine-readable definition files, rather than through manual processes or interactive configuration tools. This means you define your infrastructure using code (e.g., YAML, JSON) and then use tools to automatically create and manage the infrastructure based on that code.
IaC is useful because it enables automation, consistency, and version control for infrastructure. It reduces the risk of human error, makes infrastructure deployments repeatable and predictable, allows for easy rollback in case of issues, and facilitates collaboration through version control systems like Git. It also helps to improve speed and efficiency of deployments, reduce costs through automation and optimization, and ensure better compliance with security and regulatory requirements. Example: terraform apply to provision resources.
5. Can you name a few tools used in DevOps, and what they are used for?
Several tools are essential in DevOps, each serving a specific purpose in automating and streamlining the software development lifecycle. Jenkins is a popular open-source automation server used for continuous integration and continuous delivery (CI/CD).
Docker is a containerization platform that enables packaging applications with their dependencies into standardized units for software development. Kubernetes is an open-source container orchestration system for automating application deployment, scaling, and management. Ansible, Puppet, and Chef are configuration management tools that automate server configuration and deployment. Finally, Terraform is an infrastructure-as-code (IaC) tool used to define and provision infrastructure through code.
6. What does 'version control' mean, and why is it important in software development?
Version control is a system that records changes to a file or set of files over time so that you can recall specific versions later. It allows you to revert files back to a previous state, revert the entire project back to a previous state, compare changes over time, see who last modified something that might be causing a problem, who introduced an issue and when, and more.
It's important in software development because it enables collaboration, tracks changes, facilitates branching and merging, and provides a safety net for mistakes. Without it, managing code, especially in team environments, would be chaotic and error-prone, leading to significant delays and increased costs. For example, if someone accidentally deletes an important file, with version control, that file can easily be restored from a previous commit. git revert <commit-hash> is a great tool to undo a previous commit.
7. Have you ever used any cloud platforms like AWS, Azure, or GCP? What did you do?
Yes, I have experience with AWS. I've primarily used it for deploying and managing containerized applications using services like ECS and EKS. I've also worked with S3 for storing and retrieving large datasets, and used Lambda for building serverless applications. I've utilized CloudFormation for infrastructure as code to provision and manage AWS resources.
Specifically, I've configured CI/CD pipelines with CodePipeline and CodeBuild to automate the deployment process, set up monitoring and logging with CloudWatch, and implemented IAM roles and policies to manage access control. I also have experience using DynamoDB for NoSQL database solutions.
8. If a website is running slow, how would you go about figuring out what's wrong?
To diagnose a slow website, I'd start by checking the client-side performance using browser developer tools (Network tab) to identify slow-loading resources (images, scripts, etc.). I'd also examine the browser's performance tab to identify any Javascript bottlenecks.
Next, I'd investigate the server-side. I'd check server resource utilization (CPU, memory, disk I/O) and database query performance. Analyzing server logs for errors or slow requests is crucial. Tools like top, htop, or monitoring dashboards can help. I'd also look at any external services the site depends on and check their status. Using profiling tools and APM (Application Performance Monitoring) tools would provide insight into code-level performance bottlenecks.
9. What is the difference between 'monitoring' and 'logging' in a system?
Monitoring and logging are both crucial for system health, but serve different purposes. Logging records discrete events that occur within a system over time. These logs are often text-based and are used for auditing, debugging, and historical analysis. Examples include application errors, security events, and user activity.
Monitoring, on the other hand, focuses on observing the overall state and performance of the system in real-time or near real-time. It involves tracking metrics like CPU usage, memory consumption, response times, and error rates. Monitoring helps in identifying trends, detecting anomalies, and triggering alerts when performance degrades or thresholds are breached. Think of monitoring as checking vital signs, while logging is keeping a detailed diary of events.
10. What is containerization, and why is it helpful? Can you name any containerization platform?
Containerization is a form of operating system virtualization. It packages an application with all of its dependencies (libraries, system tools, code, and runtime) into a single, isolated unit called a container. This ensures that the application will run consistently across different computing environments, from a developer's laptop to a test environment, and ultimately, to production.
Containerization is helpful because it:
- Provides consistency: Ensures applications run the same way regardless of the underlying infrastructure.
- Increases efficiency: Containers are lightweight and require fewer resources compared to virtual machines.
- Improves portability: Containers can be easily moved between different environments.
- Facilitates scalability: Easier to scale applications by creating multiple container instances.
Some containerization platforms include Docker, containerd, and Podman.
11. What is the importance of automation in DevOps?
Automation is central to DevOps, bridging the gap between development and operations. It streamlines processes, reduces manual errors, and accelerates the software delivery lifecycle. Without automation, continuous integration and continuous delivery (CI/CD) pipelines, a cornerstone of DevOps, are simply not feasible.
Specifically, automation in DevOps:
- Increases efficiency: Automating repetitive tasks frees up developers and operations teams to focus on more strategic work.
- Reduces errors: Minimizing human intervention reduces the chance of manual errors in configurations and deployments.
- Speeds up delivery: Automated testing, builds, and deployments enable faster release cycles.
- Improves consistency: Ensures standardized processes and configurations across environments.
- Enhances collaboration: Provides a transparent and repeatable process, fostering better collaboration between development and operations.
12. What is your understanding of the software development lifecycle, and how does DevOps fit into it?
The Software Development Lifecycle (SDLC) is a structured process that outlines the phases involved in building and maintaining software. These phases typically include planning, analysis, design, implementation, testing, deployment, and maintenance. It provides a roadmap for developing high-quality software that meets customer requirements. DevOps is a set of practices that automates and integrates the processes between software development and IT teams. It aims to shorten the SDLC and provide continuous delivery with high software quality.
DevOps fits into the SDLC by automating and streamlining the processes within each phase. For example, automated testing tools and CI/CD pipelines can be used during the testing and deployment phases. DevOps bridges the gap between development and operations, fostering collaboration, automation, and continuous improvement throughout the entire software lifecycle to increase efficiency and reduce time to market.
13. If you encounter a problem during deployment, what steps would you take?
If I encounter a problem during deployment, my first step is to immediately assess the impact and severity to determine the urgency of the situation. Then, I would check the deployment logs, application logs, and system logs for any error messages or exceptions that could provide clues about the root cause. I would also check any monitoring dashboards for anomalies.
Next, I would attempt to rollback to the previous stable version if possible, or implement a temporary fix if a rollback isn't feasible. I would then collaborate with the relevant teams (development, operations, QA) to analyze the root cause and develop a permanent solution. Finally, after the fix is deployed, I would thoroughly test it and monitor the system closely to ensure the problem is resolved and doesn't reoccur. A post-mortem analysis is essential to prevent similar issues in the future.
14. Have you ever worked with a team where developers and operations worked closely together? What was it like?
Yes, I have worked in a team that embraced a DevOps culture, where developers and operations collaborated closely. It was a significant improvement over previous experiences with siloed teams. We used tools like Jenkins for CI/CD pipelines, and developers had more visibility into the deployment process and infrastructure. This collaboration led to faster release cycles, quicker identification and resolution of production issues, and a greater sense of shared responsibility for the product's success.
Specifically, we implemented monitoring tools like Prometheus and Grafana. Developers were involved in setting up alerts and dashboards, enabling them to proactively identify and address performance bottlenecks. This close collaboration also facilitated better communication and knowledge sharing between the two teams, leading to a more efficient and productive work environment.
15. What are some ways to ensure the security of a system in a DevOps environment?
Securing a DevOps environment involves integrating security practices throughout the entire software development lifecycle. Key strategies include:
- Infrastructure as Code (IaC) security: Scan IaC templates (e.g., Terraform, CloudFormation) for vulnerabilities and misconfigurations before deployment using tools like Checkov or tfsec.
- Automated Security Testing: Integrate security testing (SAST, DAST, SCA) into the CI/CD pipeline to identify and address vulnerabilities early.
- Secrets Management: Use dedicated tools like HashiCorp Vault or AWS Secrets Manager to securely store and manage secrets (API keys, passwords) and avoid hardcoding them in code or configuration files. Rotate secrets regularly.
- Container Security: Scan container images for vulnerabilities using tools like Clair or Anchore and implement runtime security policies to prevent malicious activity within containers.
- Identity and Access Management (IAM): Enforce the principle of least privilege by granting users and services only the necessary permissions to access resources. Use multi-factor authentication (MFA).
- Monitoring and Logging: Implement comprehensive monitoring and logging to detect and respond to security incidents in real time. Analyze logs for suspicious activity and set up alerts for security events.
16. How would you test code before deploying it to production?
Before deploying to production, I'd employ a multi-layered testing approach. This includes unit tests to verify individual components, integration tests to ensure different parts of the system work together correctly, and end-to-end (E2E) tests to simulate real user workflows. I'd also conduct performance testing to assess speed and stability under load and security testing to identify vulnerabilities.
Specific techniques include code reviews, static analysis (using tools like linters), and ideally, automated testing integrated into a CI/CD pipeline. Depending on the application I might use tools like pytest for unit testing, Cypress or Selenium for E2E tests, and JMeter for performance testing. For complex systems, shadow deployments or canary releases can allow for gradual rollout and monitoring.
17. What is the difference between Continuous Integration, Continuous Delivery, and Continuous Deployment?
Continuous Integration (CI) is a development practice where developers regularly merge their code changes into a central repository, after which automated builds and tests are run. The primary goal is to detect integration issues early and often.
Continuous Delivery (CD) builds upon CI by automating the release process to an environment. This means that code changes that pass the automated tests are automatically prepared for a release to production. Continuous Deployment goes a step further than Continuous Delivery. With Continuous Deployment, every change that passes the automated tests is automatically deployed to production. It requires very robust automated testing.
18. Explain the concept of 'Infrastructure Automation'.
Infrastructure automation is the process of using tools and technologies to automatically provision, configure, and manage infrastructure resources, replacing manual tasks with automated workflows. This includes servers, storage, networks, operating systems, and applications.
Benefits include: reduced human error, faster deployment times, increased efficiency, improved scalability, and consistent configurations. Common tools used in infrastructure automation include Ansible, Terraform, Chef, Puppet, and cloud provider-specific services like AWS CloudFormation or Azure Resource Manager. This can be as simple as using scripts to bootstrap new servers, or as complex as orchestrating entire application deployments across multiple environments.
19. Describe a situation where collaboration between developers and operations was crucial to solving a problem.
During a critical production outage, our e-commerce site became unresponsive. The initial assumption was a code deployment gone wrong, but reverting the changes didn't fix the issue. Collaboration between development and operations became vital. Developers investigated recent code changes, checking for memory leaks and performance bottlenecks, while operations simultaneously monitored server resources, network traffic, and database performance. Using shared monitoring tools, we discovered a sudden spike in database connection requests coinciding with a large marketing campaign.
Operations quickly scaled up the database servers, while developers optimized database queries and implemented caching mechanisms. This joint effort, using communication channels like Slack and a shared incident management platform, allowed us to identify the root cause (unexpected campaign load overwhelming the database) and implement a solution rapidly. The site was restored to normal operation, and we implemented better load testing and capacity planning procedures to prevent similar issues in the future.
20. What is the importance of 'feedback loops' in DevOps, and how can they be implemented?
Feedback loops are crucial in DevOps because they enable continuous improvement and faster learning. By constantly collecting and analyzing data from various stages of the software development lifecycle (SDLC), teams can quickly identify and address issues, optimize processes, and enhance the quality of the product. This rapid iteration fosters a culture of experimentation and innovation, leading to more efficient and effective development practices.
Feedback loops can be implemented through various mechanisms:
- Monitoring and Alerting: Setting up systems to track application performance, infrastructure health, and security vulnerabilities, and alerting teams to potential issues.
- Automated Testing: Integrating automated tests (unit, integration, end-to-end) into the CI/CD pipeline to catch bugs early.
- User Feedback: Gathering feedback from users through surveys, reviews, and usage analytics to understand their needs and pain points.
- Post-Incident Reviews: Conducting blameless post-incident reviews to analyze the root cause of incidents and identify areas for improvement.
- Continuous Integration/Continuous Delivery (CI/CD): Implementing a CI/CD pipeline to automate the build, test, and deployment process, enabling faster feedback cycles and more frequent releases.
21. How does DevOps help in faster software releases?
DevOps accelerates software releases by automating and streamlining the software development lifecycle. This involves continuous integration (CI) and continuous delivery (CD) pipelines. CI ensures code changes are frequently integrated and tested, reducing integration issues. CD automates the release process, making deployments faster and more reliable.
Key aspects include:
- Automation: Automating build, test, and deployment processes reduces manual errors and speeds up delivery.
- Collaboration: DevOps fosters better communication and collaboration between development, operations, and other teams.
- Continuous Feedback: Implementing monitoring and feedback loops allows teams to identify and fix issues quickly, further improving the release cycle.
22. What are the key differences between Agile and DevOps methodologies?
Agile and DevOps are distinct but complementary methodologies. Agile focuses on iterative software development, emphasizing collaboration, flexibility, and customer feedback within the development team. Its core principles revolve around delivering working software in short cycles (sprints) and adapting to changing requirements. DevOps, on the other hand, bridges the gap between development and operations teams, aiming to automate and streamline the entire software delivery pipeline from code commit to deployment and monitoring.
Key differences include scope and focus. Agile primarily concerns the software development process itself, while DevOps encompasses the entire lifecycle. DevOps emphasizes automation, continuous integration, and continuous delivery (CI/CD) to improve efficiency and reliability, and utilizes infrastructure-as-code (IaC) and tools such as Jenkins, Ansible, and Docker, to automate the release pipeline. Though both value collaboration, DevOps places a strong emphasis on cross-functional collaboration and shared responsibility across the entire organization, promoting a culture of shared ownership and accountability.
23. How would you handle a situation where a new feature causes an unexpected issue in production?
First, I'd immediately focus on mitigating the impact. This involves: Identifying the problem (monitoring dashboards, user reports), Rolling back the feature if possible (feature flags, version rollback), and Implementing a hotfix if a rollback isn't feasible.
Next, I'd perform a root cause analysis. This includes: Analyzing logs and metrics, Reproducing the issue in a staging environment, Collaborating with the development and QA teams to understand the code changes, and Implementing automated testing to prevent regression in the future. I'd also ensure that any postmortem documents are shared and understood across teams to improve future incident management processes.
24. Can you explain the role of configuration management tools in DevOps?
Configuration management (CM) tools are crucial in DevOps for automating and managing the infrastructure and software configurations. They ensure consistency, repeatability, and reliability across different environments, from development to production.
CM tools like Ansible, Puppet, Chef, and SaltStack help define infrastructure as code, meaning the entire infrastructure is defined using configuration files. This allows for version control, automated deployments, and easy rollback. They automate tasks such as server provisioning, software installation, patching, and configuration changes, reducing manual errors and saving time. This provides a standardized and reliable deployment process.
25. What are some metrics you would use to measure the success of a DevOps implementation?
To measure the success of a DevOps implementation, I'd focus on metrics that reflect improved speed, stability, and collaboration. Key metrics include:
- Deployment Frequency: How often code is deployed to production. Higher frequency generally indicates faster cycle times.
- Lead Time for Changes: The time it takes for a code change to go from commit to production. Lower lead time indicates faster delivery.
- Mean Time To Recovery (MTTR): How quickly services are restored after an incident. Lower MTTR indicates improved resilience.
- Change Failure Rate: The percentage of deployments that cause a failure in production. Lower failure rate indicates improved stability.
- Infrastructure Costs: The total costs for the whole infrastructure.
- Customer satisfaction: Number of support tickets and other metrics indicating customer satisfaction.
26. What does it mean to 'scale' an application, and how does DevOps support scaling?
Scaling an application refers to increasing its capacity to handle more traffic, data, or users. This can involve scaling up (vertical scaling), which means increasing the resources of a single server (e.g., more CPU, RAM), or scaling out (horizontal scaling), which means adding more servers to the application's infrastructure.
DevOps practices significantly support scaling through automation, continuous integration/continuous deployment (CI/CD), infrastructure as code (IaC), and monitoring. For example, IaC tools like Terraform or CloudFormation can automate the provisioning of new servers during peak load, enabling rapid horizontal scaling. CI/CD pipelines ensure that code changes are deployed quickly and reliably to the scaled infrastructure. Monitoring tools provide real-time insights into application performance, allowing DevOps teams to proactively identify and address scaling bottlenecks. DevOps methodologies also foster collaboration between development and operations teams, ensuring that scaling strategies are aligned with application architecture and operational requirements.
27. What's your take on 'DevSecOps', and why is security important in the DevOps pipeline?
DevSecOps means integrating security practices into every phase of the DevOps lifecycle, rather than treating it as an afterthought. It's about shared responsibility, automation, and continuous feedback loops to make security a seamless part of development and operations.
Security is crucial in the DevOps pipeline because vulnerabilities introduced early can be very costly to fix later. By incorporating security checks and automated testing (SAST, DAST) throughout the process, we can identify and address issues proactively, reducing risk, improving software quality, and ensuring compliance. This also enables faster delivery cycles without compromising the integrity of the product.
28. How do you stay updated with the latest trends and technologies in DevOps?
I stay updated with DevOps trends and technologies through a variety of methods. These include:
- Online Courses and Platforms: I regularly engage with platforms like Coursera, Udemy, and A Cloud Guru to learn new tools and methodologies.
- Industry Blogs and Publications: I follow blogs like the DevOps.com, InfoQ, and DZone to stay informed about current trends and best practices. I also subscribe to newsletters relevant to DevOps. I pay close attention to vendor blogs from AWS, Azure, Google Cloud, and Hashicorp.
- Conferences and Webinars: Attending online webinars and virtual conferences helps me understand practical applications and implementations of new technologies.
- Community Engagement: I actively participate in online communities like Reddit (r/devops) and Stack Overflow to learn from others and contribute to the DevOps community. Following thought leaders on Twitter and LinkedIn also helps me stay in the loop.
- Hands-on Practice: Experimenting with tools and technologies in personal projects or proof-of-concept environments is crucial. I might try to automate a simple CI/CD pipeline using Jenkins, GitLab CI, or GitHub Actions to learn the tool practically. For example, if I wanted to learn how to configure
nginxload balancing, I would set up a small environment to practice. - Documentation and Release Notes: I review documentation and release notes for various tools and services.
29. Explain the concept of 'Blue-Green Deployments' and their benefits.
Blue-Green deployment is a strategy that reduces downtime and risk by running two identical production environments called "Blue" and "Green". At any time, only one environment is live, serving all production traffic.
Switching between the environments happens at the router level, making it quick and reliable. The benefits include:
- Reduced Downtime: Switching between environments is instant.
- Rollback Capability: If the new (green) deployment has issues, you can immediately switch back to the old (blue) environment.
- Reduced Risk: Only a small percentage of users can be routed to the new version initially for testing.
- Simplified Testing: The green environment can be thoroughly tested before going live.
30. What are some of the challenges you anticipate facing in a DevOps role, and how would you overcome them?
Some challenges I anticipate in a DevOps role include managing infrastructure as code, ensuring security across the development lifecycle, and fostering collaboration between development and operations teams. Overcoming IaC challenges requires adopting robust version control, automated testing, and continuous monitoring of infrastructure changes. For security, I'd implement DevSecOps practices by integrating security checks into the CI/CD pipeline and promoting security awareness among developers. Collaboration can be improved through clear communication channels (like Slack), shared documentation, and cross-functional training sessions to build empathy and understanding between teams. For example, using tools like terraform validate and terraform plan before applying infrastructure changes can minimize errors. Also, setting up automated security scans with tools like OWASP ZAP within the CI/CD pipeline and regular security audits can proactively identify and address vulnerabilities.
Another challenge is dealing with alert fatigue and monitoring complex systems. To mitigate this, I would prioritize creating meaningful alerts based on service level objectives (SLOs) and key performance indicators (KPIs). Implementing robust logging and monitoring solutions with proper aggregation and filtering will help to quickly identify and troubleshoot issues. Tools like Prometheus and Grafana would be essential for visualizing and analyzing system performance and identifying potential bottlenecks.
DevOps interview questions for juniors
1. Imagine servers are like LEGO houses. How would you ensure each new house (server) is built exactly the same way, every single time?
We can use Infrastructure as Code (IaC) principles. Tools like Terraform, Ansible, or CloudFormation define the desired state of our servers in code. This code acts as a blueprint. To ensure consistency, we'd:
- Version Control: Store the IaC code in a repository like Git. Every change is tracked, allowing us to revert to previous configurations if needed.
- Automation: Use CI/CD pipelines to automatically build and configure new servers based on the IaC code.
- Configuration Management: Tools like Ansible ensure that once a server is built, its configuration remains consistent over time, preventing configuration drift.
- Image Creation: Tools like Packer can bake in a golden image, which all houses can be cloned from to ensure that the base install is consistent.
2. What's the difference between 'testing' your code and 'monitoring' it after it's running? Think of it like checking a toy before and after a kid plays with it.
Testing is a proactive process performed before code is released to ensure it behaves as expected under various conditions. It's like checking a toy for defects before a child plays with it. We use techniques like unit tests, integration tests, and end-to-end tests to verify functionality, performance, and security. The goal is to catch bugs early and prevent them from reaching users.
Monitoring, on the other hand, is a reactive process done after the code is deployed. It involves continuously observing the system's health and performance in a live environment. It's like watching the toy while the child is playing with it, to see if anything breaks. We use tools to track metrics like CPU usage, memory consumption, response times, and error rates. When issues are detected, alerts are triggered, enabling engineers to investigate and resolve problems in real-time. For example, a 500 Internal Server Error logged repeatedly would trigger an alert. In essence, testing is preventative, while monitoring is detective.
3. If you had a magic wand to automate one thing in software development, what would it be and why?
If I had a magic wand to automate one thing in software development, I'd choose to automate the generation of comprehensive and accurate unit tests. While AI is making strides, consistently producing tests that cover all edge cases, boundary conditions, and potential failure points remains a challenge.
Automated unit test generation would significantly reduce development time, improve code quality, and decrease the likelihood of bugs making it into production. It would also free up developers to focus on more complex and creative problem-solving, rather than spending a significant amount of time writing and maintaining tests.
4. Why is it important for developers and operations teams to work together, instead of separately?
When developers and operations teams work together (DevOps), the entire software development lifecycle becomes more efficient and effective. Separate teams often lead to silos, resulting in miscommunication, delays, and finger-pointing when problems arise. Collaboration fosters a shared understanding of goals and challenges, enabling faster feedback loops, quicker deployments, and improved software quality.
Specifically, working together allows:
- Faster time to market.
- Reduced deployment failures.
- Improved monitoring and incident response.
- Better resource utilization.
5. What is 'infrastructure as code' in simple terms?
Infrastructure as Code (IaC) means managing and provisioning your infrastructure (servers, networks, load balancers, etc.) through machine-readable definition files, rather than manual configuration. Think of it as writing code to describe your infrastructure. This allows you to automate infrastructure creation, version control infrastructure changes, and easily reproduce environments.
Instead of clicking around a web console, you use tools like Terraform, AWS CloudFormation, or Azure Resource Manager to define your infrastructure in code (e.g., YAML or JSON). This code can then be executed to automatically build and configure the infrastructure. Benefits include increased speed, reduced errors, and better consistency.
6. Can you describe a situation where automation helped you solve a problem?
In a previous role, I was responsible for deploying code updates to multiple servers. This was a manual process involving logging into each server, pulling the latest code, running tests, and restarting the application. This was time-consuming and prone to errors. I automated this process using a combination of shell scripts and Ansible.
The script would connect to each server, execute the necessary commands, and report the status of each step. Ansible was used to orchestrate the entire process and ensure consistency across all servers. This reduced the deployment time from hours to minutes and eliminated the risk of manual errors. This allowed me to focus on more strategic tasks and improved the overall efficiency of the team.
7. How would you explain the cloud to someone who has never heard of it?
Imagine all the computer hardware and software that businesses usually keep in their own offices – servers, storage, applications, etc. The "cloud" is basically renting those same things from someone else over the internet. Instead of owning and maintaining your own infrastructure, you pay a provider (like Amazon, Google, or Microsoft) to do it for you.
Think of it like renting an apartment instead of owning a house. You don't have to worry about repairs, upgrades, or security; the landlord (cloud provider) takes care of all that. You just pay for what you use, and you can scale up or down as needed. This allows companies to be more flexible, cost-effective, and focus on their core business rather than managing IT infrastructure.
8. What is a virtual machine?
A virtual machine (VM) is a software-defined environment that emulates a physical computer. It allows you to run an operating system and applications within another operating system (the host OS). Think of it as a computer within a computer.
VMs provide isolation, resource management, and portability. They're commonly used for testing software, running applications with specific dependencies, and server virtualization where multiple VMs run on a single physical server.
9. What are containers?
Containers are a form of operating system virtualization. A single container might be used to run anything from a small microservice or software process to a larger application.
Key aspects:
- Isolation: Containers isolate applications from one another and from the underlying infrastructure.
- Packaging: They package up an application with all of its dependencies (libraries, binaries, configuration files) into a single image.
- Consistency: This ensures that the application runs consistently across different environments (development, testing, production).
- Examples:
Docker,rkt,LXC
10. Explain the concept of CI/CD.
CI/CD stands for Continuous Integration and Continuous Delivery/Continuous Deployment. It's a software development practice that automates the process of building, testing, and deploying applications, enabling faster and more reliable releases. Continuous Integration (CI) focuses on regularly merging code changes from multiple developers into a central repository, followed by automated builds and tests. This helps detect integration issues early.
Continuous Delivery (CD) extends CI by automatically preparing code changes for release to production. Continuous Deployment goes a step further by automatically deploying code changes to production if all tests pass. Both CD approaches aim to reduce the manual effort and risk associated with deployments, making the release process faster and more predictable. A typical CI/CD pipeline involves stages like code commit, build, automated testing (unit, integration, etc.), and deployment.
11. What is a 'pipeline' in DevOps?
In DevOps, a 'pipeline' is an automated series of processes and tools that allow development and operations teams to collaborate and build, test, and deploy code to production faster and more reliably. It automates the software delivery process, enabling continuous integration and continuous delivery (CI/CD).
A typical pipeline might include stages such as:
- Code Commit: Triggered when code is pushed to a repository.
- Build: Compiles the code into an executable artifact.
- Testing: Runs automated tests (unit, integration, etc.)
- Release: Packages the application for deployment.
- Deploy: Deploys the application to the target environment. Each stage automatically triggers the next upon successful completion, reducing manual intervention and potential errors.
12. What's your favorite tool for automating tasks, and why?
My favorite tool for automating tasks is Python, specifically using libraries like subprocess, schedule, and shutil. Python's versatility allows it to handle a wide range of automation needs, from simple file management and system administration tasks to more complex data processing and API interactions. The readily available libraries significantly reduce development time and effort.
I appreciate Python's clear syntax and extensive documentation, which makes it easy to learn and maintain automation scripts. The cross-platform compatibility also ensures that these scripts can be deployed on various operating systems without significant modifications. For example, I've used subprocess to automate builds, schedule to run scripts at specified intervals, and shutil to automate file transfers. In cases that demand very high performance I would also consider shell scripting because of its lightweight nature.
13. If a website is slow, what are some things you'd check to figure out why?
If a website is slow, I would first check the client-side performance using browser developer tools (Network tab) to identify slow-loading resources (images, scripts, CSS). I'd also check for excessive DOM manipulation or inefficient JavaScript code. Tools like Lighthouse can help pinpoint client-side bottlenecks. I would use console.time() and console.timeEnd() to measure JS execution time.
Then I'd investigate the server-side. This includes checking the server's CPU, memory, and disk I/O usage to see if the server is overloaded. I'd also look at the database query performance using tools like query analyzers to identify slow queries. Checking the web server logs (e.g., Apache or Nginx) for errors or slow requests is also important. Finally, I would examine the network connectivity between the client and server using tools like ping and traceroute to rule out network latency issues and check for CDN issues, if one is in use.
14. What does it mean to 'version control' your code?
Version control is the practice of tracking and managing changes to software code. It allows developers to revert to previous versions of their code, collaborate effectively, and maintain a history of all modifications. This is crucial for managing complexity, especially in large projects involving multiple developers.
Using a version control system (VCS) like Git involves tracking changes to files, merging contributions from different developers, and resolving conflicts. It provides features such as:
- Branching: Creating separate lines of development.
- Merging: Combining changes from different branches.
- Committing: Saving changes with a descriptive message.
- Reverting: Undoing changes to a previous state.
- Example: Using git commands
git add,git commit,git push,git pull.
15. Why is it important to track changes to code?
Tracking changes to code is crucial for several reasons. It enables collaboration by providing a clear history of modifications, allowing developers to understand who made what changes and why. This is essential for debugging, code review, and understanding the evolution of the software.
Furthermore, change tracking supports version control, enabling teams to revert to previous states if needed. This is particularly important when introducing new features or fixing bugs, as it provides a safety net in case something goes wrong. It also facilitates auditing, allowing for compliance and traceability of code changes over time.
16. What is the command line?
The command line is a text-based interface used to interact with a computer's operating system. It allows users to execute commands by typing them directly, rather than using a graphical user interface (GUI) with windows and icons.
Common examples of command-line interfaces include:
- Terminal (macOS and Linux)
- Command Prompt (Windows)
- PowerShell (Windows)
Commands can be used for tasks like file management (ls, cd, mkdir, rm), running programs (./myprogram), and system administration. The shell interprets these commands.
17. How does using the cloud help save money compared to using physical servers?
Using the cloud can save money compared to physical servers in several ways. First, it eliminates the need for upfront capital expenditure on hardware, reducing costs significantly. Instead of purchasing servers, you pay for cloud resources as you use them, shifting from a capital expense (CapEx) to an operational expense (OpEx).
Second, the cloud provides scalability and flexibility. You can easily scale resources up or down based on demand, avoiding the costs associated with over-provisioning physical servers. Physical servers often require more cooling, space, and power which significantly increases costs. The cloud handles all the underlying infrastructure, reducing IT staff time and expertise needed for maintenance, power, cooling, and security. Finally, cloud providers often offer volume discounts and other cost optimization tools, further reducing expenses.
18. If you accidentally broke something in production, what's the first thing you'd do?
The very first thing I'd do is immediately try to mitigate the impact. This often means escalating the issue by notifying the appropriate people (team members, on-call engineer, manager) based on the severity and potential customer impact. Then, depending on the nature of the breakage, I would consider immediate rollback to a known good state, disable the offending feature, or apply a hotfix if one is readily available. The priority is to restore service as quickly and safely as possible.
Once the immediate crisis is under control, I'd focus on understanding why the breakage occurred. This involves gathering logs, analyzing the code, and collaborating with the team to identify the root cause. Following that, we'd implement a proper fix, test it thoroughly, and then deploy it. Finally, a post-mortem analysis should be conducted to prevent similar incidents in the future; documenting the incident, the root cause, and the steps taken to resolve it. This post-mortem should ideally lead to action items for improvements in our processes, testing, or monitoring.
19. What's the difference between a bug, an error, and an incident?
A bug is a flaw or defect in the code that causes the software to produce an incorrect or unexpected result. An error is a broader term that indicates a deviation from the expected behavior, which could be due to a bug, environmental issue, or user input. An incident, on the other hand, is an event that disrupts or degrades the normal operation of a service.
Think of it this way: a bug in code (e.g., an incorrect calculation in a function) can lead to an error (e.g., the application crashes), and that error can then trigger an incident (e.g., the website becomes unavailable to users). Bugs are code-level, errors are manifestations of issues, and incidents are disruptions to service.
20. Tell me about a time you had to learn something new quickly.
In my previous role, I was assigned to a project requiring expertise in React, a JavaScript library I had only basic familiarity with. The project had a tight deadline, so I needed to quickly upskill myself.
I dedicated my evenings and weekends to online courses, documentation, and tutorials. I also started building small personal projects to solidify my understanding and applied these concepts to the project at hand. I asked more senior team members for code review and guidance. Within a few weeks, I was able to contribute meaningfully to the project and even took the lead on a component. It required intense focus, but I successfully learned React and delivered on the project’s requirements.
21. Why is security important in DevOps?
Security is critical in DevOps because it helps to integrate security practices early and throughout the software development lifecycle (SDLC), rather than treating it as an afterthought. This approach, often called DevSecOps, allows for faster identification and remediation of vulnerabilities, reducing the risk of breaches and data loss.
Integrating security into DevOps ensures that security considerations are addressed at every stage, from planning and coding to testing, deployment, and monitoring. By automating security checks and incorporating security feedback loops, it's possible to build more secure and resilient systems while maintaining the speed and agility that DevOps promises. This reduces potential costs associated with fixing security issues later in the process and protects the organization's reputation and data.
DevOps intermediate interview questions
1. How would you approach troubleshooting a slow-running application in a containerized environment?
To troubleshoot a slow-running containerized application, I'd start by isolating the issue. First, I'd check container resource usage (CPU, memory, disk I/O, network) using tools like docker stats or kubectl top. If resource limits are being hit, I'd adjust them or investigate resource leaks in the application using profiling tools. I'd also examine application logs for errors or slow queries and use distributed tracing (e.g., Jaeger, Zipkin) to identify bottlenecks in the request flow across different services.
Next, I'd investigate the container's health and network connectivity. I'd ensure the application within the container is healthy using health checks. Network latency between containers or to external services can significantly impact performance, so tools like ping or traceroute inside the container can help identify network issues. Finally, I'd examine the host machine's resources. If the underlying host is overloaded, containers might be throttled, causing slowdowns.
2. Explain your experience with Infrastructure as Code (IaC) tools like Terraform or CloudFormation, detailing a complex infrastructure deployment you automated.
I have extensive experience with Terraform for managing infrastructure as code. I've used it to automate the deployment of various complex infrastructures, including multi-region, highly available web applications and data pipelines.
One notable project involved automating the deployment of a data lake on AWS. This included configuring S3 buckets for data storage, setting up IAM roles and policies for secure access, deploying an EMR cluster for data processing, and configuring a Redshift cluster for data warehousing. The Terraform configuration defined the infrastructure, handled dependencies, and enabled version control. We leveraged modules to encapsulate reusable components and implemented CI/CD pipelines to automatically apply infrastructure changes upon code commits. This reduced manual effort, improved consistency, and minimized deployment time while maintaining infrastructure as code.
3. Describe a situation where you had to roll back a deployment due to unforeseen issues. What steps did you take to minimize the impact?
During a recent deployment of a new user authentication service, we encountered a critical bug in production that caused intermittent login failures for a subset of users. After quickly identifying the issue through monitoring and user reports, we made the decision to immediately roll back to the previous stable version. To minimize the impact, we first communicated the rollback plan to the stakeholders and support teams. Simultaneously, we started the rollback process using our automated deployment pipeline. This involved reverting the code to the previous commit and redeploying the older version of the service. During the rollback process, we actively monitored the system to ensure the login issues were resolved. Post rollback we communicated the resolution to stakeholders.
To further mitigate future incidents, we implemented more rigorous testing procedures, including increased test coverage and more comprehensive integration testing to catch similar bugs before deployment. We also improved our monitoring dashboards to provide earlier alerts for unusual activity. Finally, we are exploring canary deployments and feature flags to reduce the blast radius of future releases.
4. How do you ensure security is integrated into the DevOps pipeline, and what tools do you use for security scanning?
Security is integrated into the DevOps pipeline through a concept called DevSecOps, which emphasizes shared responsibility for security across the entire development lifecycle. This is achieved by automating security checks and incorporating security considerations at every stage, from code commit to deployment.
For security scanning, I would leverage several tools:
- Static Application Security Testing (SAST): Tools like SonarQube, Checkmarx, or Veracode analyze source code for vulnerabilities early in the development process.
- Dynamic Application Security Testing (DAST): Tools such as OWASP ZAP or Burp Suite scan running applications to identify vulnerabilities that are only apparent during runtime.
- Software Composition Analysis (SCA): Tools like Snyk or Black Duck scan dependencies and libraries for known vulnerabilities.
- Infrastructure as Code (IaC) Scanning: Tools like Checkov or tfsec analyze IaC templates (e.g., Terraform, CloudFormation) for misconfigurations and security risks before deployment.
- Container Security Scanning: Tools like Clair or Trivy scan container images for vulnerabilities.
These scans are integrated into the CI/CD pipeline to automatically detect and address security issues. Results are used to gate deployments, ensuring that only secure code is released.
5. Explain your understanding of blue-green deployments and how they differ from canary deployments.
Blue-green deployments involve running two identical environments, 'blue' (live) and 'green' (new version). Traffic is switched entirely from blue to green after testing. Rollback is as simple as switching traffic back to the blue environment if issues arise. Canary deployments, on the other hand, release the new version (canary) to a small subset of users. Performance and error rates are monitored closely. If everything is stable, the canary is gradually rolled out to more users until it completely replaces the old version.
The key difference is the traffic switch. Blue-green is an all-or-nothing switch, while canary is a gradual rollout. Canary deployments allow for better real-world testing with less risk because only a small number of users are impacted initially.
6. Describe a time you had to optimize a CI/CD pipeline for faster feedback and reduced build times.
In a previous role, our CI/CD pipeline for a microservice application had become a bottleneck, with build times exceeding 30 minutes. This significantly slowed down development cycles and feedback loops. To address this, I first profiled the pipeline to identify the slowest steps, which turned out to be dependency resolution and integration tests.
I implemented several optimizations: First, we introduced caching for dependencies using tools like mvn dependency:go-offline for Maven, reducing the time spent downloading artifacts. Second, we parallelized integration tests, splitting them across multiple agents to run concurrently. Finally, we adopted Docker layer caching to minimize the amount of data transferred between build stages. These changes reduced the average build time to under 10 minutes, resulting in faster feedback and increased developer productivity.
7. How do you monitor the health and performance of your infrastructure and applications, and what alerting mechanisms do you use?
I monitor infrastructure and application health using a combination of tools and techniques. For infrastructure, I leverage tools like Prometheus and Grafana to collect and visualize metrics related to CPU usage, memory consumption, disk I/O, and network traffic. Application performance is monitored using tools like New Relic or Datadog, focusing on metrics such as response times, error rates, and throughput. Log aggregation tools such as the Elastic Stack (Elasticsearch, Logstash, Kibana) are used to centralize and analyze logs for identifying errors and anomalies.
For alerting, I configure thresholds in Prometheus Alertmanager, New Relic, or Datadog to trigger notifications when metrics exceed acceptable levels. These alerts are sent via email, Slack, or PagerDuty, depending on the severity and the on-call schedule. Additionally, I implement health checks that proactively probe the availability and responsiveness of services. For example, a simple health check endpoint might return a 200 OK status if the service is healthy, and any other response code would trigger an alert.
8. Explain your experience with container orchestration platforms like Kubernetes or Docker Swarm, highlighting your role in managing and scaling applications.
I have experience with Kubernetes for container orchestration. My role primarily involved deploying, managing, and scaling applications within a Kubernetes cluster. This included defining and managing Kubernetes resources such as Deployments, Services, ConfigMaps, and Secrets. I also used Helm charts for packaging and deploying applications, streamlining the deployment process and ensuring consistency across different environments.
Specifically, I've worked with:
- Deployments: Defining desired state of applications and handling rolling updates.
- Services: Exposing applications and managing network traffic.
- Scaling: Horizontally scaling applications based on resource utilization or custom metrics using
kubectl scaleand Horizontal Pod Autoscalers (HPAs). - Monitoring: Utilizing tools like Prometheus and Grafana to monitor application performance and cluster health, and setting up alerts based on predefined thresholds. I've also used tools for managing containerized applications like
kubectl,helm, andkustomize.
9. Describe a situation where you had to implement a disaster recovery plan. What were the key challenges and how did you overcome them?
In a previous role, we faced a potential disaster scenario when a major power outage threatened our primary data center. Our disaster recovery plan involved failing over critical applications and data to a geographically separate secondary data center. The key challenges were ensuring data consistency during the failover and minimizing downtime for users. We overcame these challenges by implementing real-time data replication between the two data centers and conducting regular failover drills to identify and address any potential issues.
During a planned exercise we identified that our DNS propagation was taking longer than anticipated, impacting user experience post-failover. We resolved this by reducing the TTL (Time To Live) value on our DNS records prior to the failover event. We also improved monitoring dashboards to provide immediate visibility into the status of applications and services in the secondary data center, allowing for faster identification and resolution of any problems that arose.
10. How do you handle configuration management for different environments (e.g., development, staging, production)?
I use a combination of techniques to manage configurations across different environments. Primarily, I leverage environment variables to inject environment-specific settings into the application at runtime. This is often coupled with a configuration file (e.g., config.json, application.yml) that provides default values, which are then overridden by environment variables when available. I might also use dedicated configuration management tools like Ansible, Terraform, or Kubernetes ConfigMaps/Secrets, depending on the infrastructure and deployment strategy.
For sensitive information such as API keys or database passwords, I would utilize a secrets management solution like HashiCorp Vault or AWS Secrets Manager. This ensures that secrets are stored securely and accessed only by authorized applications. Furthermore, I ensure immutability of the configuration by baking the necessary setup into a container image during the build process, promoting consistency between environments and reducing drift.
11. Explain your approach to implementing continuous testing in the DevOps pipeline, including the types of tests you would automate.
My approach to continuous testing involves integrating automated tests into every stage of the DevOps pipeline. This ensures that code changes are validated quickly and frequently, minimizing the risk of introducing defects. Key to this is creating a feedback loop so developers get notified promptly if a build fails. I would focus on automating several types of tests, including: Unit tests: To verify individual components or functions. Integration tests: To check interactions between different modules or services. API tests: To validate the functionality and performance of APIs. End-to-end tests: To simulate real user scenarios and ensure the entire application works as expected. Security tests: To scan for vulnerabilities. Performance tests: To measure the application's responsiveness and scalability.
I'd implement these tests using tools like JUnit/pytest for unit tests, Selenium/Cypress for UI tests, Postman/RestAssured for API tests, and Jenkins/GitLab CI/GitHub Actions for pipeline orchestration. The testing framework should provide clear and actionable reports that help developers identify and fix issues quickly.
12. Describe a time you had to troubleshoot a network connectivity issue in a cloud environment.
During a recent deployment, our application running on AWS EC2 instances experienced intermittent connectivity issues with our RDS database. The application logs showed frequent connection timeouts. I started by checking the EC2 instance's security group rules and the RDS security group rules to ensure that inbound and outbound traffic was allowed on the correct ports. I also verified that the Network ACLs associated with the subnets allowed traffic between the EC2 instances and the RDS instance.
After confirming the security groups and ACLs were correctly configured, I used ping and traceroute from the EC2 instances to the RDS endpoint to diagnose network latency and potential routing problems. I discovered that the route table configuration was incorrect, causing traffic to be routed through an unintended network path, introducing latency. Updating the route table to correctly route traffic resolved the connectivity issues.
13. How do you ensure compliance with security and regulatory requirements in your DevOps practices?
Ensuring security and regulatory compliance in DevOps involves integrating security practices throughout the entire development lifecycle. I achieve this through several key strategies: Automated security testing (SAST/DAST) is incorporated into CI/CD pipelines to identify vulnerabilities early. Infrastructure as Code (IaC) allows me to define and manage infrastructure in a compliant and auditable manner. We also perform regular security audits and penetration testing to proactively identify and address potential weaknesses. Finally, Role-Based Access Control (RBAC) and Principle of Least Privilege are used to restrict access to sensitive resources.
Regulatory requirements are addressed by implementing specific controls and policies based on the relevant standards (e.g., GDPR, HIPAA, PCI DSS). This includes data encryption at rest and in transit, detailed logging and monitoring, and establishing clear incident response procedures. Compliance checks are automated where possible and documented meticulously to demonstrate adherence to regulations during audits.
14. Explain your experience with log aggregation and analysis tools like ELK stack or Splunk.
I have experience with the ELK stack (Elasticsearch, Logstash, and Kibana) for log aggregation and analysis. I've used Logstash to ingest logs from various sources, including application servers and system logs, and transform them into a structured format. I then configured Elasticsearch to index and store these logs, enabling efficient searching and analysis. Kibana was used to create dashboards and visualizations to monitor application performance, identify errors, and track key metrics. I've also worked with creating filters and grok patterns to parse complex log formats.
While my primary experience is with ELK, I understand the core concepts behind Splunk and similar tools. I'm familiar with the importance of centralized logging, real-time analysis, and alerting based on log data. I'm comfortable learning new tools and adapting my skills to different log management platforms. I have used command-line tools like grep, awk, and sed for analyzing logs, and I have experience in writing scripts (primarily in Python) to automate log analysis tasks.
15. Describe a situation where you had to automate the provisioning of resources in a multi-cloud environment.
I once automated resource provisioning across AWS and Azure for a disaster recovery setup. We used Terraform to define infrastructure as code, specifying the resources needed in both clouds (VMs, databases, networking). A CI/CD pipeline, triggered by code changes, executed the Terraform scripts, creating and configuring the resources in parallel across both environments. This significantly reduced the provisioning time from days to hours and ensured consistent configurations. We used cloud-agnostic naming conventions and tagging strategies to easily manage and monitor the resources regardless of the underlying cloud provider. We also implemented health checks and failover mechanisms to automatically switch traffic to the secondary cloud in case of a primary outage.
16. How do you handle secrets management in your DevOps pipeline?
Secrets management in a DevOps pipeline is crucial for security. I typically use a dedicated secrets management tool like HashiCorp Vault, AWS Secrets Manager, or Azure Key Vault. These tools provide secure storage, access control, and auditing of secrets.
My approach involves:
- Storing secrets centrally in the chosen secrets manager.
- Granting access to secrets based on the principle of least privilege, usually using service accounts.
- Using environment variables or configuration files to inject secrets into applications at runtime. This prevents hardcoding secrets in the code.
- Rotating secrets regularly to minimize the impact of potential breaches. Secrets are not stored in the codebase or CI/CD configuration files. Using tools like
git-cryptorBlackBoxfor encrypting secrets in Git is an option for source code but is less robust than a full secrets management solution.
17. Explain your understanding of GitOps and how it differs from traditional CI/CD.
GitOps is a declarative approach to continuous delivery that focuses on managing infrastructure and application deployments through Git repositories. The desired state of the system is defined in Git, and automated operators continuously reconcile the actual state with the desired state. This contrasts with traditional CI/CD, where pipelines directly push changes to environments.
The core difference lies in how deployments are triggered. In CI/CD, a pipeline directly executes deployment steps. In GitOps, the pipeline updates the Git repository (the source of truth), and then an operator within the cluster detects this change and reconciles the environment to match the new state. Think of GitOps as 'infrastructure as code' taken to its logical conclusion for deployments, leveraging Git for versioning, auditing, and rollback capabilities. This ensures deployments are auditable, reproducible, and easier to manage.
18. Describe a time you had to collaborate with developers and operations teams to resolve a complex production issue.
During a critical outage affecting our e-commerce platform, I worked with developers and operations to diagnose and resolve the issue. The website became unresponsive intermittently, causing significant user impact. Initially, operations suspected a network problem due to increased latency alerts. However, developers noticed a spike in database connection pool exhaustion. I facilitated a joint troubleshooting session where developers analyzed recent code deployments, identifying a memory leak in a newly released feature responsible for product recommendations.
We collaborated to implement a temporary fix by increasing the database connection pool size, buying us time to address the root cause. Developers then patched the code to eliminate the memory leak. Operations rolled out the patched code during off-peak hours, and monitored the system closely. Post-deployment, we observed a significant reduction in database connection usage and the website's stability returned to normal. This experience highlighted the importance of cross-functional collaboration and the necessity of having robust monitoring tools and rollback plans in place.
19. How do you measure the success of your DevOps initiatives and what metrics do you track?
I measure the success of DevOps initiatives by tracking metrics that reflect improved speed, stability, and efficiency. Key metrics include: Deployment Frequency (how often code is deployed), Lead Time for Changes (time taken from code commit to production deployment), Mean Time To Recovery (MTTR) (time taken to restore service after an incident), and Change Failure Rate (percentage of deployments causing incidents). I also monitor Infrastructure Costs, Resource Utilization (CPU, memory), and Customer Satisfaction (Net Promoter Score, support tickets).
By monitoring these metrics, I can identify bottlenecks, areas for improvement, and the overall impact of DevOps practices. For example, a decrease in MTTR indicates improved incident response, while increased deployment frequency suggests faster delivery cycles. These metrics help demonstrate the value of DevOps initiatives to stakeholders and guide continuous improvement efforts.
20. Explain your approach to implementing Infrastructure as Code (IaC) testing and validation.
My approach to IaC testing involves several stages. First, static analysis using tools like terraform validate or cfn-lint to catch syntax errors and policy violations early. Second, unit testing for individual modules or components using frameworks such as Kitchen or Terratest. These tests verify the functionality of specific resources. Third, integration testing to ensure that different components work together seamlessly in a pre-production environment. Finally, end-to-end testing to validate the entire infrastructure and its applications.
Validation is a continuous process. I incorporate automated testing pipelines into the CI/CD workflow using tools like Jenkins or GitLab CI. This includes pre-commit hooks for static analysis, and automated builds/deployments in isolated environments for integration and end-to-end tests. Monitoring and alerting are crucial after deployment to detect unexpected configuration drifts or performance issues. Regularly scanning for security vulnerabilities using tools like trivy is also part of the process to ensure a secure IaC environment.
21. How do you manage and version control database schema changes in a DevOps environment?
In a DevOps environment, managing and version controlling database schema changes is crucial for maintaining consistency and enabling collaboration. We typically use a combination of tools and practices. First, we employ database migration tools like Flyway, Liquibase, or Alembic. These tools allow us to define schema changes as code (SQL or other DSL) and apply them in a controlled and versioned manner. Each change (migration) is typically a separate file with a unique identifier.
Second, we integrate these migration scripts into our version control system (e.g., Git). This allows us to track the history of schema changes, collaborate on changes, and rollback changes if needed. The migration scripts are typically executed as part of the CI/CD pipeline, ensuring that database schemas are automatically updated as part of the deployment process. We use branching strategies similar to application code, allowing for development, testing, and production environments. For example, new feature branches may contain specific database migration scripts and are merged to a main branch when the feature is ready.
Example using Flyway:
-- Flyway migration script V1__create_table_users.sql
CREATE TABLE users (
 id INT PRIMARY KEY,
 name VARCHAR(255)
);
DevOps interview questions for experienced
1. How would you design a CI/CD pipeline for a microservices architecture, considering independent deployments and versioning?
For a microservices CI/CD pipeline, I'd aim for independent deployments. Each microservice should have its own pipeline triggered by code changes in its repository. The pipeline would typically include stages like build (compiling code, running unit tests), artifact creation (creating a Docker image tagged with a version number), testing (integration and end-to-end tests against other services, possibly using mocks/stubs), and deployment (deploying the new image to a staging or production environment). Versioning is crucial; I'd use semantic versioning for each microservice and incorporate the version into the Docker image tag, database schema migrations, and API documentation. Rollbacks would be facilitated by the versioned images.
To manage dependencies between services, I'd use a service registry/discovery mechanism. The deployment process might involve updating this registry with the new version of the service. Canary deployments or blue-green deployments can be employed for safer releases. Each pipeline must have automated testing covering the critical path to avoid pushing any code breaking changes to production. For instance, if service A depends on service B's API, the automated testing phase of service A's pipeline should call service B API to assert the contract is not broken. Dependencies between services are managed via API contracts and using contract testing frameworks for the dependent services. Each service would use its own database and database migrations would be part of the CI/CD pipeline.
2. Explain your experience with infrastructure as code (IaC) tools beyond basic provisioning, including configuration management and drift detection.
Beyond basic provisioning with IaC tools like Terraform and AWS CloudFormation, I've utilized them for more comprehensive infrastructure management. This includes configuration management, where I define and enforce the desired state of servers and applications. For example, using Ansible playbooks triggered by Terraform to configure newly provisioned EC2 instances, installing software, and setting up monitoring agents.
I also have experience with drift detection. IaC allows defining the desired state of infrastructure, and drift occurs when the actual state deviates. I've used Terraform's terraform plan to identify configuration drift by comparing the current infrastructure state to the defined state. Additionally, I have integrated tools like AWS Config to continuously monitor resource configurations and alert on deviations from the baseline defined in my IaC code. For example, if a security group rule is manually changed outside of Terraform, AWS Config would flag this as a non-compliant change, prompting me to remediate the drift by updating the Terraform configuration and applying the changes.
3. Describe a situation where you had to troubleshoot a performance bottleneck in a distributed system. What tools and techniques did you use?
In a previous role, we experienced a significant performance bottleneck in our e-commerce platform during peak hours, specifically with order processing. Orders were timing out, and database load was extremely high. I used a combination of tools and techniques to identify the issue.
First, I used monitoring tools like New Relic and DataDog to observe application performance metrics such as response times, error rates, and resource utilization (CPU, memory, I/O). I then used database profiling tools (e.g., pg_stat_statements in PostgreSQL) to identify slow-running queries. The bottleneck turned out to be inefficient queries joining large tables without proper indexes. I optimized these queries by adding appropriate indexes and rewriting some complex joins. We also implemented caching for frequently accessed data using Redis to reduce the load on the database. Finally, we used load testing with tools like Gatling to simulate peak traffic and ensure the fixes were effective and the system could handle the expected load.
4. How do you approach security automation in a DevOps pipeline, and what security tools are you familiar with?
Security automation in a DevOps pipeline is crucial for shifting security left and ensuring continuous security. My approach involves integrating security checks and tools at various stages of the pipeline to identify and address vulnerabilities early. This includes static analysis, dynamic analysis, and infrastructure-as-code scanning. Specifically, I integrate security tools within the CI/CD process to automatically test code, containers and infrastructure for vulnerabilities during the build, test, and deployment phases. This provides early and rapid feedback to developers.
I'm familiar with several security tools, including:
- Static Application Security Testing (SAST): SonarQube, Checkmarx
- Dynamic Application Security Testing (DAST): OWASP ZAP, Burp Suite
- Software Composition Analysis (SCA): Snyk, Black Duck
- Infrastructure as Code (IaC) Scanning: Terraform compliance, Checkov, tfsec
- Container Security: Trivy, Aqua Security, Anchore
- Secrets Management: HashiCorp Vault, AWS Secrets Manager
- Vulnerability Management: Nessus, Qualys
5. Explain your experience with container orchestration platforms like Kubernetes or Docker Swarm, including scaling, self-healing, and resource management.
I have experience with Kubernetes for container orchestration. I've used it to deploy and manage applications, focusing on scaling, self-healing, and resource management. For scaling, I’ve configured Horizontal Pod Autoscalers (HPAs) based on CPU and memory utilization to dynamically adjust the number of pods based on traffic demands. I've also implemented rolling updates and deployments to ensure zero downtime during application updates.
Regarding self-healing, I’ve used liveness and readiness probes to automatically restart failing containers. If a pod fails the liveness probe, Kubernetes automatically restarts it. For resource management, I define resource requests and limits for containers to ensure fair allocation of resources across the cluster and prevent any single container from consuming excessive resources. I've also utilized namespaces to logically isolate applications and teams within the cluster.
6. Describe your experience with different monitoring and alerting tools, and how you would set up a comprehensive monitoring strategy for a complex application.
I've worked with various monitoring and alerting tools like Prometheus, Grafana, Nagios, and ELK stack (Elasticsearch, Logstash, Kibana). My experience includes configuring alerts based on thresholds for metrics like CPU utilization, memory usage, disk I/O, and response times. For logging, I've used tools to centralize logs from different application components and create dashboards for analysis and troubleshooting.
To set up a comprehensive monitoring strategy for a complex application, I'd start by identifying key performance indicators (KPIs) and critical business functions. Then, I'd implement monitoring at different levels: infrastructure (servers, network), application (performance, errors), and user experience (response times, availability). For alerting, I'd configure tiered alerts (warning, critical) based on severity, routing notifications to the appropriate teams via email, Slack, or PagerDuty. Finally, I'd use dashboards to visualize data, analyze trends, and proactively identify potential issues. I'd also incorporate synthetic monitoring to simulate user interactions and ensure application availability even when there is no real user traffic. Example: API monitoring using tools like Postman or custom scripts.
7. How do you handle database schema migrations in a DevOps environment with zero downtime?
Handling database schema migrations in a DevOps environment with zero downtime involves a combination of strategies that minimize impact on the running application. One common approach is to use rolling deployments alongside techniques like blue/green deployments or canary releases. During schema changes, we apply backward-compatible changes first (e.g., adding new columns, creating new tables), allowing both old and new application versions to function. Old code reads/writes using defaults, while new code uses the new features. Once the old application versions are phased out, we remove any obsolete components or columns.
Tools like Liquibase, Flyway, or database-specific migration tools (e.g., Alembic for SQLAlchemy) are crucial for managing and automating the migration process. These tools provide version control for schema changes, allowing for predictable and repeatable deployments. Before applying migrations to production, we thoroughly test them in a staging environment that mirrors production. It is good to keep database changes small and incremental for smooth execution and easier rollback.
8. Explain your experience with different cloud providers (e.g., AWS, Azure, GCP) and their specific DevOps services.
I have experience with AWS, Azure, and GCP, focusing on their DevOps services. On AWS, I've worked extensively with services like EC2, S3, and Lambda for infrastructure and application deployment. I've used CloudFormation and Terraform for infrastructure as code, CodePipeline and CodeBuild for CI/CD, and CloudWatch for monitoring. In Azure, I've utilized Azure VMs, Azure Blob Storage, and Azure Functions. I have used Azure DevOps for CI/CD pipelines and Azure Resource Manager for infrastructure management. On GCP, I've worked with Compute Engine, Cloud Storage, and Cloud Functions, leveraging Cloud Build for CI/CD and Terraform for infrastructure automation. I've also used Google Cloud Monitoring for performance analysis.
Specifically, regarding CI/CD tools, my experience includes configuring build pipelines, setting up automated testing, and deploying applications to various environments using these platforms' respective services. For example, in AWS CodePipeline, I've created pipelines to build, test, and deploy applications to EC2 instances, while in Azure DevOps, I've used YAML-based pipelines to automate the deployment of containers to Azure Kubernetes Service (AKS). In GCP, I've configured Cloud Build triggers to automatically build and deploy container images to Cloud Run upon code changes in the repository. I'm comfortable adapting to the nuances of each platform's services and integrating them into cohesive DevOps workflows.
9. Describe a time when you had to automate a complex and manual process, and what challenges you faced.
In my previous role, we had a very manual process for generating monthly reports. It involved pulling data from multiple databases, cleaning it in Excel, and then manually creating charts and summaries. This process took about 2-3 days each month, so I automated it using Python. I used pandas for data manipulation, SQLAlchemy to connect to the databases, and matplotlib to generate charts. The biggest challenge was handling inconsistencies in the data from different sources. I had to write custom scripts to standardize the data formats and handle missing values. Also, ensuring the reports met all regulatory requirements required thorough testing and validation. Eventually, the automated script reduced the reporting time to a couple of hours and significantly improved accuracy.
Another challenge was version controlling the code and managing dependencies as the project grew. We adopted git for code management and venv for dependency management, ensuring that future updates and collaborations would be more manageable. Furthermore, the automated script was parameterized allowing for easy modification of filters and groupings within the resulting reports, increasing its utility across different departments.
10. How do you approach disaster recovery and business continuity planning in a DevOps environment?
In a DevOps environment, disaster recovery (DR) and business continuity (BC) are integrated into the entire development lifecycle, emphasizing automation and infrastructure as code (IaC). We approach it by automating backups, utilizing infrastructure-as-code to quickly provision environments, and regularly testing recovery procedures. Key aspects include defining recovery point objectives (RPO) and recovery time objectives (RTO), and using cloud services to quickly scale resources in case of an outage.
Furthermore, we use CI/CD pipelines to manage deployments across multiple regions, ensuring redundancy. Monitoring is crucial, with alerts set up to detect failures early. IaC tools like Terraform or CloudFormation are used to define infrastructure, enabling quick and consistent recovery. Regular drills are performed to validate DR plans and identify areas for improvement, with post-mortems conducted after each drill to refine our processes.
11. Explain your understanding of different DevOps methodologies like Kanban, Scrum, or Lean, and how you have applied them in practice.
I understand DevOps methodologies as frameworks to streamline software development and deployment. Kanban focuses on visualizing workflow, limiting work in progress (WIP), and continuous flow. Scrum uses short iterations (sprints) with defined roles and events like daily stand-ups and sprint reviews. Lean emphasizes eliminating waste and optimizing the entire value stream.
In practice, I've used Kanban for ongoing maintenance projects. I visualized tasks on a board (physical or digital), limited WIP to avoid bottlenecks, and focused on delivering value continuously. For new feature development, I've used Scrum. We defined sprints, planned work, tracked progress, and adapted based on sprint reviews and retrospectives. Specifically, I automated the build process using Jenkins and Docker, reducing deployment time and errors which aligns with Lean principles by eliminating waste in the release process. I've also used infrastructure as code using Terraform to automate infrastructure creation and updates which is another application of Lean principles.
12. Describe your experience with implementing and managing service meshes like Istio or Linkerd.
I have experience implementing and managing Istio for enhanced observability, security, and traffic management in Kubernetes environments. My experience includes: configuring traffic routing using VirtualServices and Gateways, implementing mTLS for secure service-to-service communication, and setting up monitoring dashboards using Prometheus and Grafana to track service health and performance. I've also utilized Istio's fault injection capabilities for resilience testing. For example, I have configured fault injection to introduce latency and simulate failures to test application behavior.
While I have less hands-on experience with Linkerd, I understand its core principles and have explored its lighter-weight approach to service mesh implementation. I am familiar with the differences between Linkerd and Istio in terms of their architecture, resource footprint, and feature set. I'm comfortable using tools such as kubectl and the Istio CLI (istioctl) to manage and troubleshoot service mesh deployments.
13. How do you ensure compliance with regulatory requirements (e.g., GDPR, HIPAA) in a DevOps pipeline?
Ensuring compliance in a DevOps pipeline involves integrating security and compliance checks at every stage. For GDPR, this means data minimization, privacy by design, and secure data handling practices. For HIPAA, it's about protecting PHI through access controls, encryption, and audit trails. Key strategies include:
- Automated Security Scanning: Implement SAST and DAST tools in the CI/CD pipeline to detect vulnerabilities early.
- Infrastructure as Code (IaC): Use IaC to define and enforce compliant configurations.
- Policy as Code: Automate compliance checks using tools like Open Policy Agent (OPA) or similar rule engines, which will either pass or fail a particular deployment based on specified criteria, such as 'is the application using encryption at rest?' or 'is there personally identifiable information being stored in the logs?'
- Data Masking and Anonymization: Implement data masking and anonymization techniques in non-production environments.
- Audit Logging: Enable comprehensive audit logging and monitoring for all activities.
- Version Control: Use version control for all code, configurations, and policies to track changes and ensure accountability.
- Regular Audits: Conduct regular security and compliance audits to identify and address any gaps.
14. Explain your experience with implementing and managing secrets management solutions like HashiCorp Vault or AWS KMS.
I have experience implementing and managing secrets management solutions, primarily HashiCorp Vault and AWS KMS. With Vault, I've configured various authentication methods like LDAP and Kubernetes, defined policies for access control, and implemented secret engines such as KV and database secrets. I've also automated Vault deployments using Terraform and integrated it with applications using Vault's API and SDKs. I've rotated secrets automatically using Vault's built-in functionality.
Regarding AWS KMS, I've used it to encrypt sensitive data at rest and in transit, managed cryptographic keys, and integrated it with other AWS services like S3 and RDS. I've also implemented key rotation policies and monitored KMS usage for security and compliance. I created IAM policies to restrict access to KMS keys. I also integrated KMS into applications using the AWS SDK.
15. Describe a situation where you had to resolve a conflict between developers and operations teams, and how you approached it.
I once encountered a conflict where developers were rapidly deploying new features, leading to instability in the production environment reported by the operations team. The operations team felt the developers weren't considering the impact of their changes, while the developers felt operations were slowing them down and blocking innovation. To resolve this, I facilitated a meeting where both teams could openly voice their concerns and perspectives.
I encouraged both teams to define clear SLOs/SLAs, and introduced automated testing and monitoring to proactively catch issues before they impacted users. We implemented a phased rollout strategy with canary deployments and feature flags, allowing for controlled releases and quick rollbacks if necessary. The developers committed to better documentation and communication about upcoming changes, while operations agreed to a more streamlined deployment process. This improved collaboration and reduced the number of production incidents.
16. How do you approach capacity planning and resource optimization in a cloud environment?
Capacity planning in the cloud involves forecasting future resource needs based on application demands and usage patterns. I start by monitoring current resource utilization (CPU, memory, storage, network) using cloud provider tools like AWS CloudWatch or Azure Monitor. This data helps establish baselines and identify trends. I then use these insights to predict future resource requirements, taking into account factors like anticipated user growth, seasonal variations, and planned application updates.
Resource optimization involves ensuring that resources are used efficiently. This can be achieved through techniques like right-sizing instances, using auto-scaling to dynamically adjust resources based on demand, implementing load balancing to distribute traffic evenly, and leveraging serverless functions for event-driven workloads. Regularly reviewing resource utilization and identifying underutilized or over-provisioned resources is key. Cost optimization is a major consideration, and choosing appropriate pricing models (e.g., reserved instances, spot instances) also helps.
17. Explain your understanding of different networking concepts like VPCs, subnets, and load balancing, and how they relate to DevOps.
VPCs (Virtual Private Clouds) provide isolated, private network environments within a public cloud. Subnets are subdivisions of a VPC, allowing you to organize resources into logically separated segments, often based on security or function. Load balancing distributes incoming network traffic across multiple servers or instances, improving application availability, scalability, and fault tolerance.
In DevOps, these networking concepts are crucial for infrastructure as code (IaC) implementations. For example, tools like Terraform or CloudFormation can be used to define and automate the creation and configuration of VPCs, subnets, and load balancers. Automating these networking components facilitates faster deployments, reduces manual errors, and ensures consistency across environments. Load balancers are often integrated into CI/CD pipelines to automatically distribute traffic to newly deployed application versions. Understanding these concepts enables DevOps engineers to build scalable, resilient, and secure applications in the cloud, aligning infrastructure management with software development practices.
18. Describe your experience with implementing and managing blue-green deployments or canary releases.
I've implemented blue-green deployments and canary releases in several projects to minimize downtime and risk during software updates. In one project, we used blue-green deployments to upgrade a critical e-commerce application. We created a duplicate environment (the 'blue' environment) with the new version, tested it thoroughly, and then switched traffic from the 'green' (old) environment to the 'blue' environment using a load balancer. This allowed for a near-zero downtime upgrade. For canary releases, I've used feature flags and load balancer weights to gradually roll out new features to a small subset of users. We closely monitored the canary deployment for errors and performance issues before rolling it out to the entire user base. We used tools like Datadog and Prometheus to track metrics and identify any regressions introduced by the new code. This allowed us to quickly revert changes if any issues were detected.
19. How do you approach testing in a DevOps pipeline, including unit, integration, and end-to-end testing?
In a DevOps pipeline, testing is automated and integrated throughout the software delivery lifecycle. Unit tests are conducted by developers to verify individual components in isolation. Integration tests then ensure that different modules work together correctly. These are often automated and run frequently. End-to-end (E2E) tests validate the entire application workflow from start to finish, simulating real user scenarios. These are typically automated but run less frequently due to their complexity and longer execution time.
We use a combination of tools for testing, such as JUnit/pytest for unit testing, Cypress/Selenium for E2E testing, and Jenkins/GitLab CI for pipeline orchestration. Test results are automatically reported, and build failures trigger immediate feedback to the development team. A key principle is to shift testing to the left, identifying and fixing issues early in the development process to reduce costs and improve software quality. We aim for a high degree of automation and continuous feedback loops to achieve rapid and reliable deployments.
20. Explain your understanding of different security vulnerabilities like SQL injection, cross-site scripting, and denial-of-service attacks, and how to prevent them.
SQL Injection occurs when malicious SQL code is inserted into an application's database query, potentially allowing attackers to bypass security measures, access sensitive data, or even modify the database. Prevention involves using parameterized queries or prepared statements, which treat user input as data rather than executable code, and validating user input to ensure it conforms to expected formats. Cross-Site Scripting (XSS) vulnerabilities enable attackers to inject malicious scripts into websites viewed by other users. These scripts can steal cookies, redirect users, or deface the website. Prevention methods include encoding user input, especially when displaying it on the page, using Content Security Policy (CSP) to control the resources that the browser is allowed to load, and employing input validation to filter out potentially malicious scripts. Denial-of-Service (DoS) and Distributed Denial-of-Service (DDoS) attacks overwhelm a system or network with traffic, making it unavailable to legitimate users. Prevention strategies include implementing rate limiting to restrict the number of requests from a single source, using firewalls to filter malicious traffic, and employing DDoS mitigation services that can absorb and filter large volumes of traffic. Web application firewalls (WAFs) can also help filter malicious requests.
21. Describe a time when you had to debug a complex issue in a production environment under high pressure.
During a Black Friday sale, our e-commerce platform experienced a sudden surge in failed order placements. The error logs were flooded with cryptic messages pointing to a potential database deadlock. The pressure was immense as every minute of downtime translated to significant revenue loss. I immediately joined a war room with the on-call team (DBAs, SREs, and other developers). I started by analyzing the database connection pool metrics which indicated a severe exhaustion of available connections.
Using pg_stat_activity on the database server, we identified long-running transactions that were blocking other queries. These were traced back to a faulty data aggregation job that had been inadvertently triggered during the peak sales period. We killed the offending job after confirming its non-criticality. Next, we scaled up the database connection pool and optimized the most frequently executed queries. This combination of actions stabilized the system within an hour and prevented further order failures. We also implemented a circuit breaker to prevent the job from running during peak hours again, and also created monitoring dashboards to track connection pool usage and query performance.
22. How do you approach building and maintaining a culture of automation within a team?
To foster an automation culture, I'd start by championing its benefits: increased efficiency, reduced errors, and faster feedback loops. This involves demonstrating quick wins with simple automation tasks to showcase value and encourage adoption. I'd also prioritize providing necessary training and resources, such as access to automation tools and knowledge sharing sessions.
Maintaining this culture requires continuous reinforcement. This can include recognizing and rewarding automation efforts, actively soliciting feedback to improve processes, and promoting collaboration to share automation best practices. Regular code reviews and documenting the processes would also solidify a culture of automation to ensure all automations are easily maintainable and extensible.
23. Explain your experience with different logging and log aggregation tools, and how you would set up a centralized logging system.
I have experience with various logging frameworks and tools, including log4j, logback, and slf4j in Java, and the built-in logging module in Python. I've also worked with log aggregation tools like the ELK stack (Elasticsearch, Logstash, Kibana) and Splunk. My experience involves configuring these tools to capture application logs, system logs, and audit logs.
To set up a centralized logging system, I would first choose an appropriate log aggregator based on the project's scale and requirements (e.g., ELK for open-source, Splunk for enterprise features). Then, I'd configure each application server to forward logs to the aggregator, often using agents like Filebeat or Fluentd. These agents collect logs from files or systemd journals and ship them to the central server. On the aggregator, I would configure parsing and indexing rules for efficient searching and analysis, and visualize the data using dashboards (e.g., in Kibana or Splunk).
24. Describe your experience with implementing and managing GitOps workflows.
I have experience implementing GitOps workflows using tools like Argo CD and Flux. I've defined infrastructure and application configurations as code in Git repositories and automated deployments based on Git events. This involved setting up CI/CD pipelines to build and test changes, and then using GitOps tools to synchronize the desired state in Git with the live environment.
Specifically, I've worked with defining Kubernetes manifests (e.g., Deployments, Services) in Git, configuring Argo CD to monitor these repositories, and automatically deploying updates when changes are merged. I also have experience with managing drift detection and reconciliation, ensuring that the cluster state always matches the desired state defined in Git. For example, I used kubectl diff to debug differences between running resources and the git repository definitions.
25. How do you ensure the quality and reliability of your infrastructure as code (IaC) configurations?
To ensure the quality and reliability of IaC configurations, I use a multi-faceted approach. Firstly, I implement version control using Git to track changes, enabling collaboration and rollback capabilities. Secondly, I conduct thorough testing, including unit tests to validate individual components and integration tests to verify the interaction between different parts of the infrastructure. Static code analysis tools like terraform validate or cfn-lint are incorporated to identify potential errors and enforce coding standards early in the development process.
Further, I use automated pipelines (CI/CD) to deploy the IaC configurations, providing consistency and repeatability. Infrastructure is treated as immutable, with changes being applied through updates rather than direct modification. Finally, I use monitoring and alerting to detect any issues in the infrastructure and trigger automated remediation steps.
26. Explain your understanding of different container networking concepts like CNI and service discovery.
Container Network Interface (CNI) is a specification and a set of libraries for configuring network interfaces in Linux containers. Its primary role is to connect containers to a network, allocating IP addresses and configuring routing. Kubernetes uses CNI plugins (like Calico, Flannel, and Weave Net) to manage container networking. These plugins handle tasks such as creating virtual network interfaces, assigning IP addresses, and configuring network policies.
Service discovery allows applications within a containerized environment to automatically locate and connect to each other, even as their IP addresses or locations change. Kubernetes offers built-in service discovery mechanisms using DNS and environment variables. When a service is created in Kubernetes, a DNS entry is automatically created, allowing other containers to resolve the service's name to its IP address. Kubernetes also uses environment variables to provide service information to containers. Tools like Consul or etcd can also be used for service discovery outside of, or in conjunction with, Kubernetes' built-in capabilities.
27. Describe a situation where you had to improve the efficiency of a DevOps pipeline, and what steps you took.
In a previous role, our CI/CD pipeline for deploying microservices to Kubernetes was taking over 30 minutes, significantly slowing down development cycles. I identified several bottlenecks. First, the Docker image build process was inefficient. Second, the integration tests were sequential and time-consuming.
To address this, I implemented multi-stage Docker builds to reduce image size by removing unnecessary dependencies, which cut image build times by 40%. I also parallelized the integration tests using pytest-xdist, reducing the total test time by 60%. Finally, I optimized the Kubernetes deployment manifests and applied rolling updates instead of recreating pods. These changes reduced the overall pipeline duration to under 15 minutes, improving developer productivity and reducing deployment risks.
28. How do you approach monitoring and alerting for cloud costs and resource utilization?
I approach cloud cost and resource monitoring with a multi-faceted strategy, leveraging native cloud provider tools (like AWS Cost Explorer, Azure Cost Management + Billing, or Google Cloud Billing) and third-party solutions. I establish a baseline for expected costs and resource consumption and then define alerts for anomalies. These alerts trigger when costs exceed a predefined threshold or when resource utilization (CPU, memory, network) deviates significantly from the norm.
Specifically, I use cost allocation tags for detailed tracking, implement budgets with notifications, and configure alerts based on forecasted spending. For resource utilization, I monitor key performance indicators (KPIs) and set up alerts using cloud monitoring services (CloudWatch, Azure Monitor, Google Cloud Monitoring) or tools like Prometheus and Grafana. These alerts notify relevant teams via email, Slack, or PagerDuty, enabling timely investigation and remediation.
29. Explain your experience with different configuration management tools like Ansible, Chef, or Puppet in complex environments.
I have experience using Ansible for configuration management in both small and large-scale environments. I've utilized it to automate server provisioning, application deployment, and system updates. I've designed and implemented Ansible playbooks and roles to ensure consistency and repeatability across different environments, including development, staging, and production. I have worked with Ansible Vault to manage sensitive data, like passwords and API keys.
While I have less hands-on experience with Chef and Puppet, I understand their core principles and how they differ from Ansible's agentless approach. I've been exposed to Chef through training and have a general understanding of how it uses recipes and cookbooks. I am familiar with Puppet's declarative language and its focus on desired state configuration. My preference leans towards Ansible due to its simplicity, ease of use, and agentless architecture but I am always open to using other tools if the situation demands.
DevOps MCQ
Question 1.
Which configuration management tool is best suited for managing Windows-based servers and infrastructure as code?
Options:
Options:
Question 2.
Which of the following is a primary benefit of implementing Infrastructure as Code (IaC)?
options:
Options:
Question 3.
Which of the following is the primary function of Prometheus in a DevOps environment?
options:
Options:
Question 4.
What is a primary benefit of using a Blue/Green deployment strategy?
Options:
Question 5.
In a typical CI/CD pipeline, which of the following stages generally involves automated testing and code quality checks after the code is built and integrated?
options:
Options:
Question 6.
Which of the following statements best describes the primary benefit of using a container orchestration system like Kubernetes?
Options:
Question 7.
Which of the following BEST describes the primary benefit of using Terraform for infrastructure provisioning?
options:
Options:
Question 8.
Which of the following tools is MOST suitable for managing and versioning artifacts (e.g., JAR files, Docker images, Python packages) produced during the CI/CD pipeline?
Options:
Question 9.
Which of the following is a PRIMARY security best practice when implementing Infrastructure as Code (IaC)?
Options:
Question 10.
Which of the following is the MOST significant benefit of incorporating automated testing into a CI/CD pipeline?
Options:
Question 11.
Which of the following tools is MOST suitable for centralized log management, analysis, and alerting across a large, distributed infrastructure?
Options:
Question 12.
Which of the following best describes the primary goal of implementing a canary deployment strategy in a CI/CD pipeline?
Options:
Question 13.
What is the primary benefit of adopting an immutable infrastructure approach in a DevOps environment?
Options:
Options:
Question 14.
Which load balancing algorithm distributes incoming traffic evenly across all available servers regardless of their current load?
Options:
Question 15.
Which of the following is the PRIMARY benefit of implementing automated rollbacks in a CI/CD pipeline?
options:
Options:
Question 16.
Which of the following BEST describes the key difference between 'push' and 'pull' configuration management strategies in Infrastructure as Code (IaC)?
options:
Options:
Question 17.
Which of the following approaches BEST exemplifies automating disaster recovery in a DevOps environment using Infrastructure as Code (IaC)?
Options:
Question 18.
Which of the following is the PRIMARY benefit of implementing Chaos Engineering in a DevOps environment?
Options:
Question 19.
Which of the following practices BEST enhances security within a CI/CD pipeline?
Options:
Options:
Question 20.
Which of the following is the MOST important benefit of implementing autoscaling in a cloud environment?
Options:
Question 21.
Your organization has adopted a microservices architecture, with services deployed across multiple cloud providers. You need to implement a monitoring solution that provides centralized visibility, real-time alerts, and comprehensive tracing capabilities across all services and platforms. Which of the following monitoring tools would be MOST suitable for this scenario?
Options:
Question 22.
Which of the following is the PRIMARY benefit of implementing automated patch management in a DevOps environment?
Options:
Question 23.
Which of the following tools is BEST suited for comprehensive infrastructure monitoring, focusing on both system-level metrics and application performance, and offers extensive alerting capabilities?
Options:
Question 24.
Which of the following data backup and recovery strategies is MOST suitable for ensuring minimal data loss and rapid recovery time in a cloud-native environment where applications are deployed across multiple availability zones?
Options:
Question 25.
Which of the following approaches is MOST suitable for automating database schema updates as part of a CI/CD pipeline?
Options:
Which DevOps skills should you evaluate during the interview phase?
While a single interview can't fully assess a candidate's skills, focusing on core competencies is key. For DevOps roles, certain skills are more predictive of success than others. Evaluating these areas will help you identify top talent.
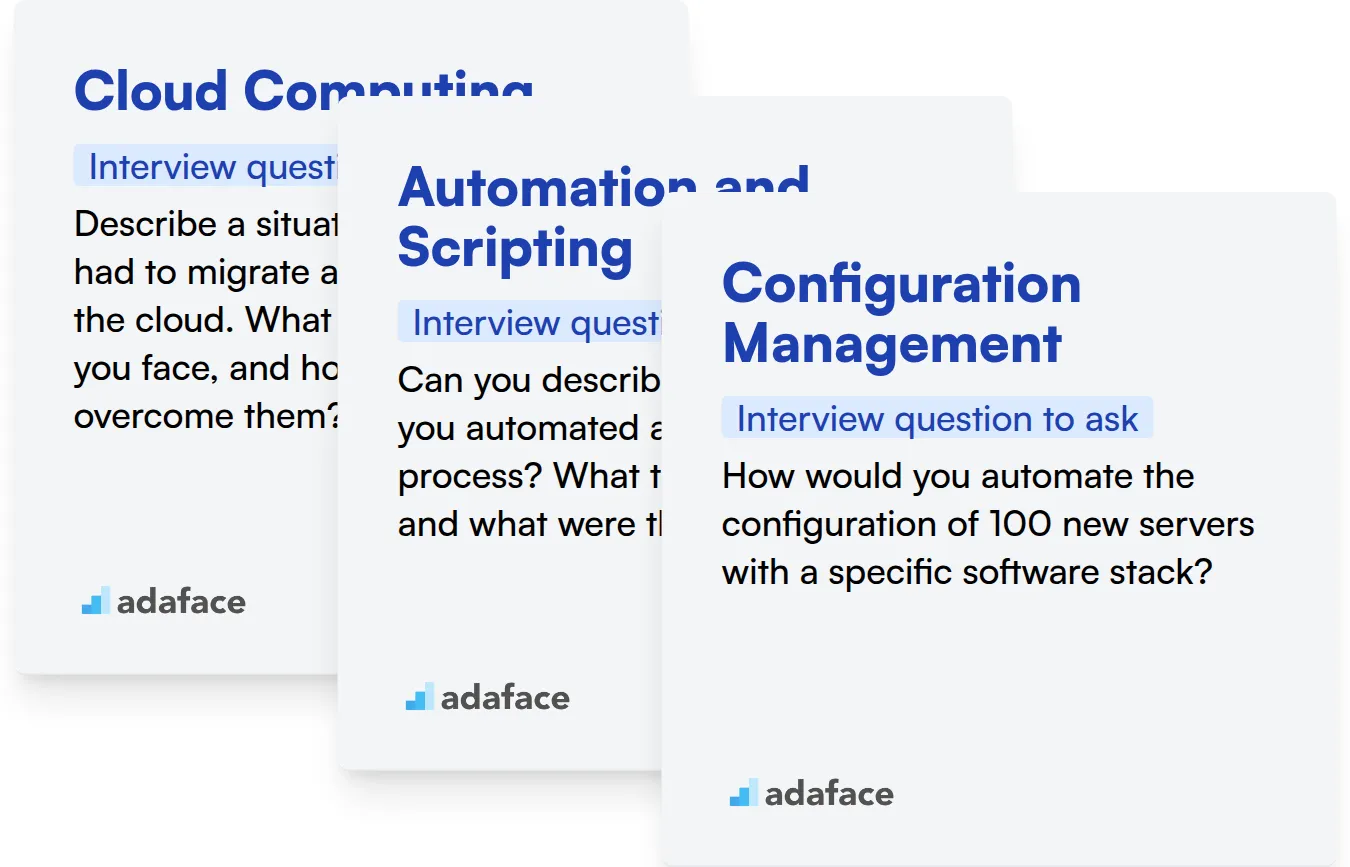
Cloud Computing
Assess cloud expertise with an online test that covers key concepts and services. Adaface's Azure online test can help filter candidates based on their knowledge of Azure services.
To gauge practical knowledge, pose scenario-based interview questions. This helps to understand the depth of their cloud experience.
Describe a situation where you had to migrate an application to the cloud. What challenges did you face, and how did you overcome them?
Look for candidates who can articulate the migration process, challenges, and solutions. They should also be able to discuss trade-offs and best practices.
Automation and Scripting
Use assessments focusing on scripting languages and automation tools. Adaface's Python online test or Shell Scripting test can help you assess this skill.
To explore their automation capabilities, ask them to describe an automation project. This can highlight their understanding of automation principles.
Can you describe a time when you automated a complex process? What tools did you use, and what were the results?
The candidate should demonstrate understanding of automation frameworks and tools. Look for a clear articulation of problem-solving and results achieved.
Configuration Management
Verify their configuration management knowledge with targeted MCQs. Adaface offers a Terraform online test to evaluate their knowledge of infrastructure as code.
Present a scenario requiring configuration management to understand their approach. This will reveal how they handle infrastructure changes.
How would you automate the configuration of 100 new servers with a specific software stack?
The candidate should be able to outline a process using configuration management tools. Look for understanding of idempotency, version control, and rollback strategies.
Hire DevOps Experts with Skills Tests and Targeted Interview Questions
Hiring individuals with strong DevOps skills requires a method to accurately assess their expertise. Verifying that candidates possess the necessary abilities is key to building a high-performing team.
Using skills tests is an objective way to measure a candidate's DevOps knowledge. Adaface offers a range of relevant assessments, including the DevOps Online Test, AWS DevOps Test, and Kubernetes Online Test.
Once you've used these tests to identify top candidates, you can shortlist them for focused interviews. This allows you to explore their practical experience and problem-solving capabilities in more detail.
Ready to find your next DevOps superstar? Sign up for a free trial of Adaface's skills assessment platform here to get started.
DevOps Test
45 mins | 20 MCQs
The DevOps Test is a scenario-based online test designed to assess a candidate's proficiency in working with Linux, Git, Python, Docker and DevOps skills.
Try DevOps Test
Download DevOps interview questions template in multiple formats
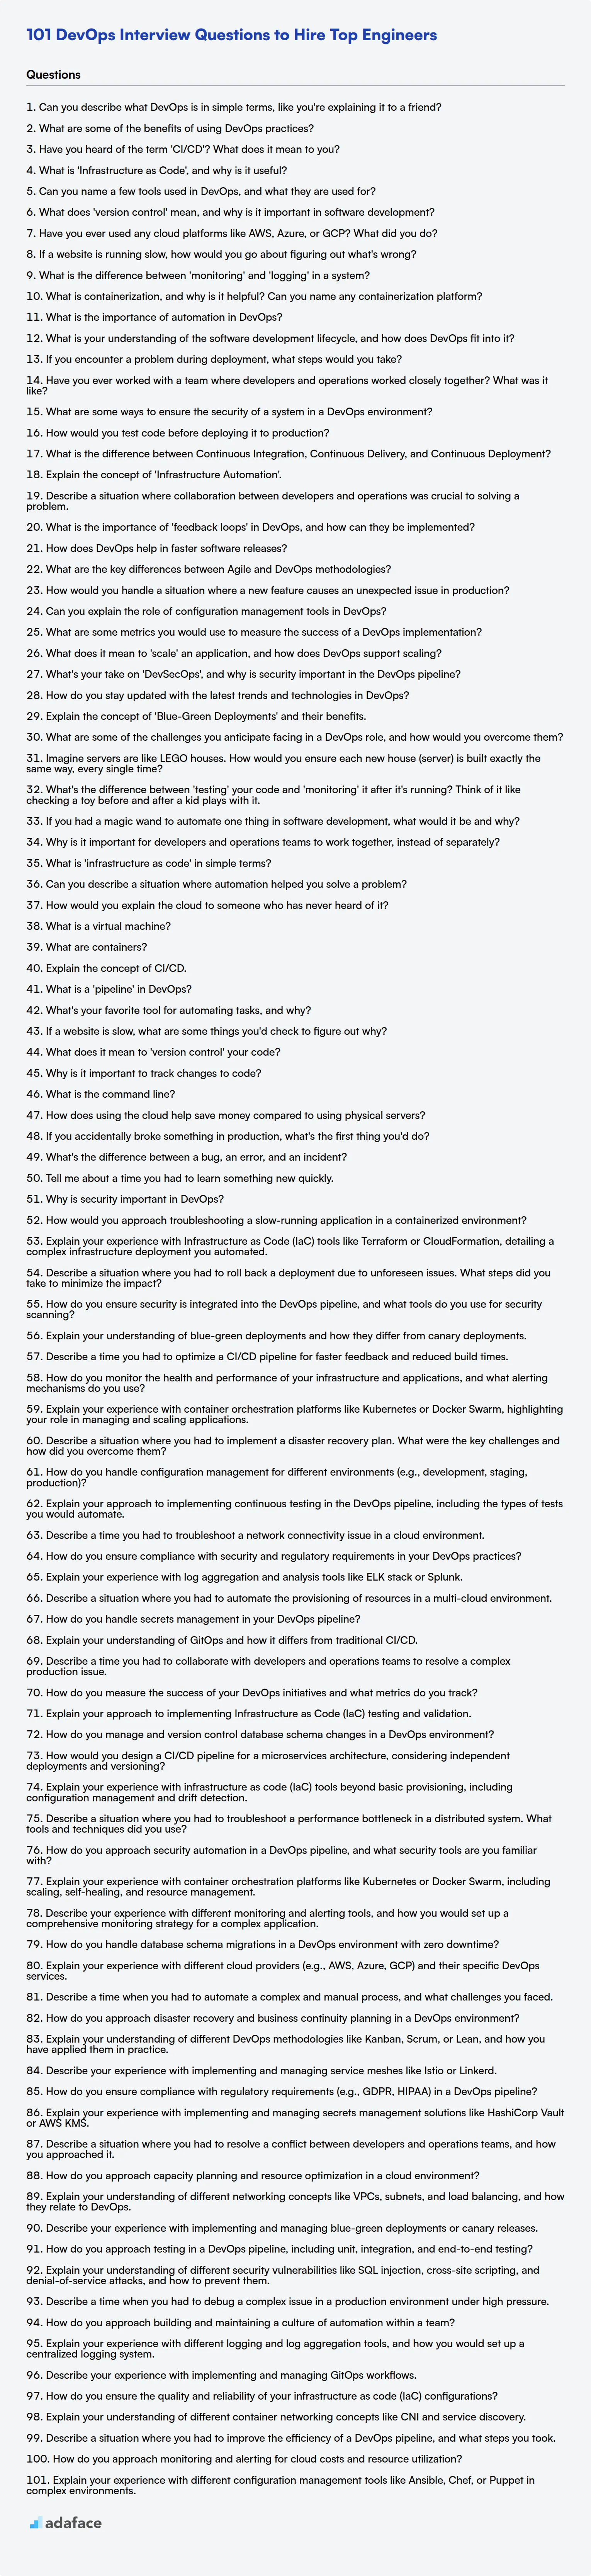
DevOps Interview Questions FAQs
What are some key areas to assess in a DevOps interview?
Key areas include understanding of CI/CD pipelines, infrastructure as code (IaC), containerization, automation, monitoring, and collaboration practices.
Why is it important to ask behavioral questions in a DevOps interview?
Behavioral questions help evaluate a candidate's problem-solving skills, teamwork abilities, and how they handle high-pressure situations, all necessary in a DevOps environment.
How can I assess a candidate's understanding of automation?
Ask about their experience with tools like Ansible, Chef, or Puppet, and have them describe how they've used these tools to automate infrastructure or deployment tasks.
What are some good questions to assess a candidate's experience with cloud platforms?
Ask about their experience with specific cloud providers (AWS, Azure, GCP), their knowledge of cloud services, and how they approach designing and deploying applications in the cloud.
How do I evaluate a DevOps candidate's understanding of monitoring and logging?
Ask them about the tools they've used for monitoring (e.g., Prometheus, Grafana) and logging (e.g., ELK stack), and how they leverage these tools to identify and resolve issues.
What are some red flags to watch out for during a DevOps interview?
Red flags include a lack of understanding of core DevOps principles, poor communication skills, unwillingness to collaborate, and resistance to automation.
40 min skill tests.
No trick questions.
Accurate shortlisting.
We make it easy for you to find the best candidates in your pipeline with a 40 min skills test.
Try for freeRelated posts
Free resources

Join 1200+ companies in 80+ countries.
Try the most candidate friendly skills assessment tool today.

40 min tests.
No trick questions.
Accurate shortlisting.
No trick questions.
Accurate shortlisting.