Test Duration
70 分钟
Difficulty Level
Moderate
Questions
- 5 Power BI MCQs
- 5 Tableau MCQs
- 4 r MCQs
- 5 Python MCQs
- 5 SQL MCQs
- 1 Python Coding Question
Availability
Ready to use
About the test:
商业智能开发人员测试使用基于方案的多项选择问题来评估候选人与数据建模和ETL流程,数据仓库和数据挖掘,BI报告和可视化,数据分析和预测建模以及BI项目管理相关的知识和技能。还可以评估他们使用BI工具和技术(例如SQL Server,Power BI,Tableau和其他相关工具)的能力,以及他们在应用数据分析和业务智能技术方面的熟练程度来解决复杂的业务问题。
Covered skills:
Test Duration
70 分钟
Difficulty Level
Moderate
Questions
Availability
Ready to use
The BI开发人员测试 helps recruiters and hiring managers identify qualified candidates from a pool of resumes, and helps in taking objective hiring decisions. It reduces the administrative overhead of interviewing too many candidates and saves time by filtering out unqualified candidates at the first step of the hiring process.
The test screens for the following skills that hiring managers look for in candidates:
Traditional assessment tools use trick questions and puzzles for the screening, which creates a lot of frustration among candidates about having to go through irrelevant screening assessments.
The main reason we started Adaface is that traditional pre-employment assessment platforms are not a fair way for companies to evaluate candidates. At Adaface, our mission is to help companies find great candidates by assessing on-the-job skills required for a role.
Why we started AdafaceWe have a very high focus on the quality of questions that test for on-the-job skills. Every question is non-googleable and we have a very high bar for the level of subject matter experts we onboard to create these questions. We have crawlers to check if any of the questions are leaked online. If/ when a question gets leaked, we get an alert. We change the question for you & let you know.
How we design questions这些只是我们库中有10,000多个问题的一个小样本。关于此的实际问题 BI开发人员测试 将是不可行的.
| 🧐 Question | |||||
|---|---|---|---|---|---|
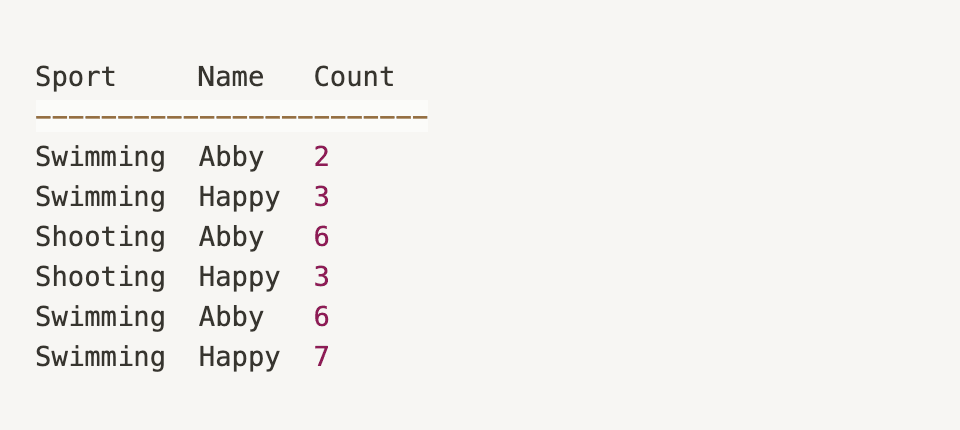
Medium Data Filtering | Solve | ||||
Medium Many-to-one error | Solve | ||||
Medium Power Query Functions | Solve | ||||
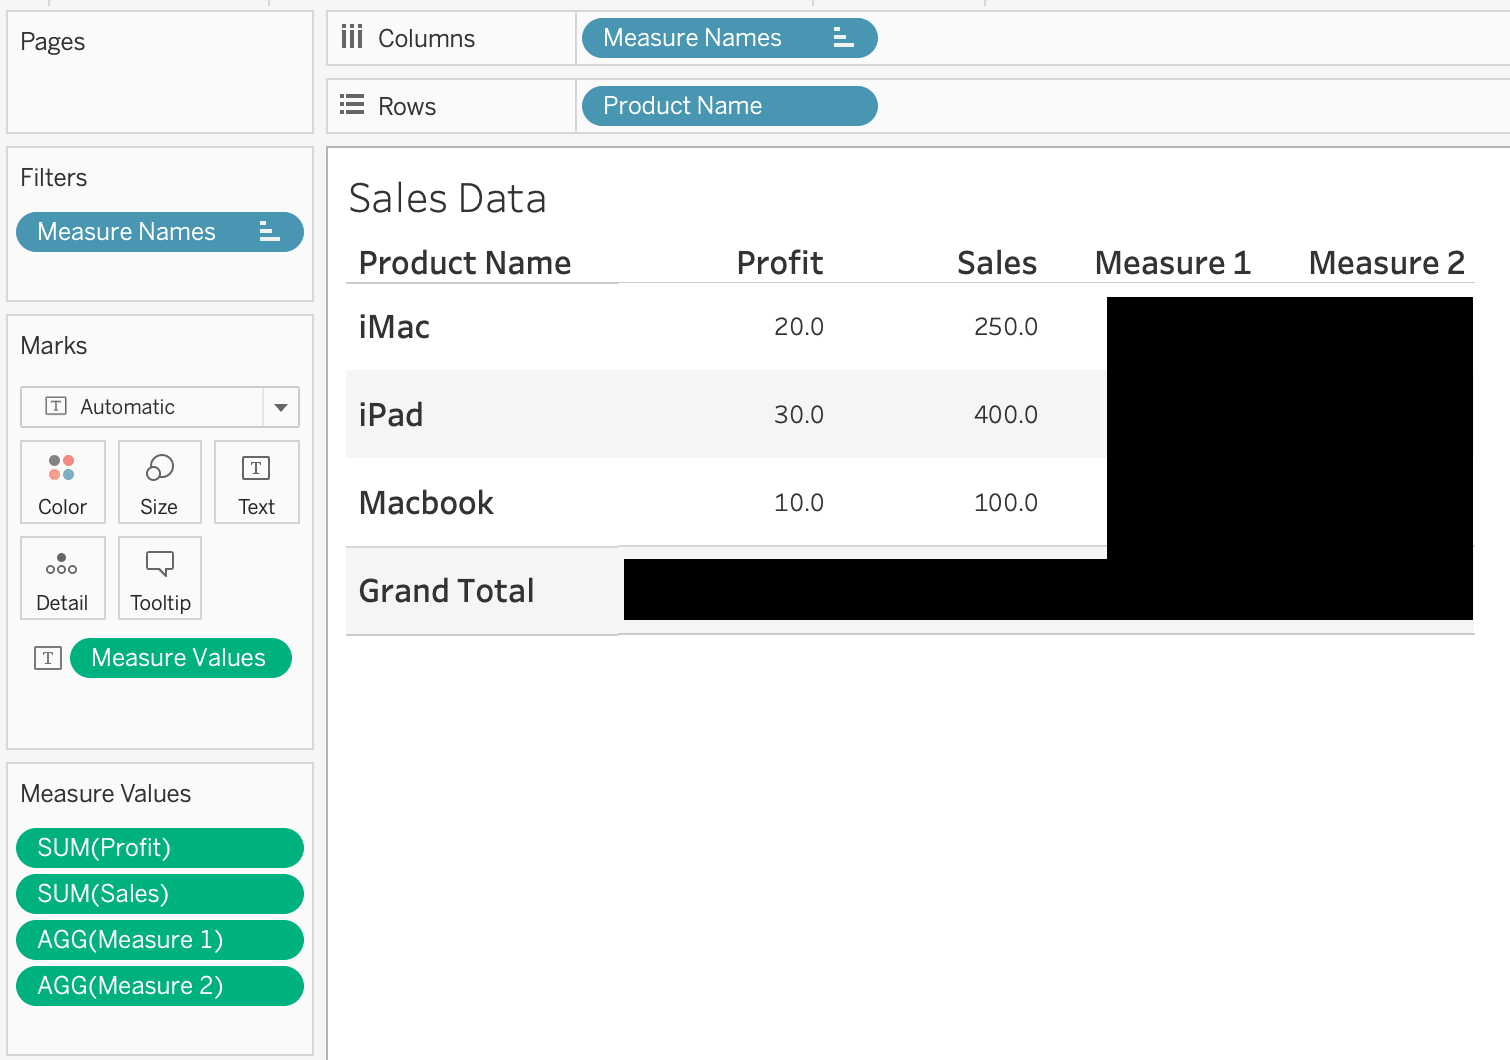
Medium Calculated Properties | Solve | ||||
Medium Change display icon | Solve | ||||
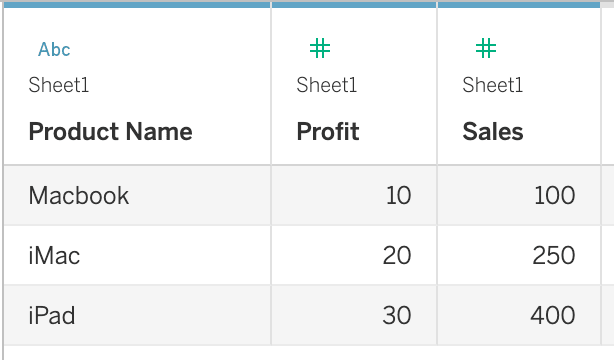
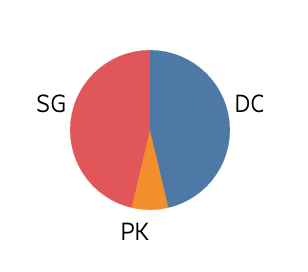
Easy Pie Chart | Solve | ||||
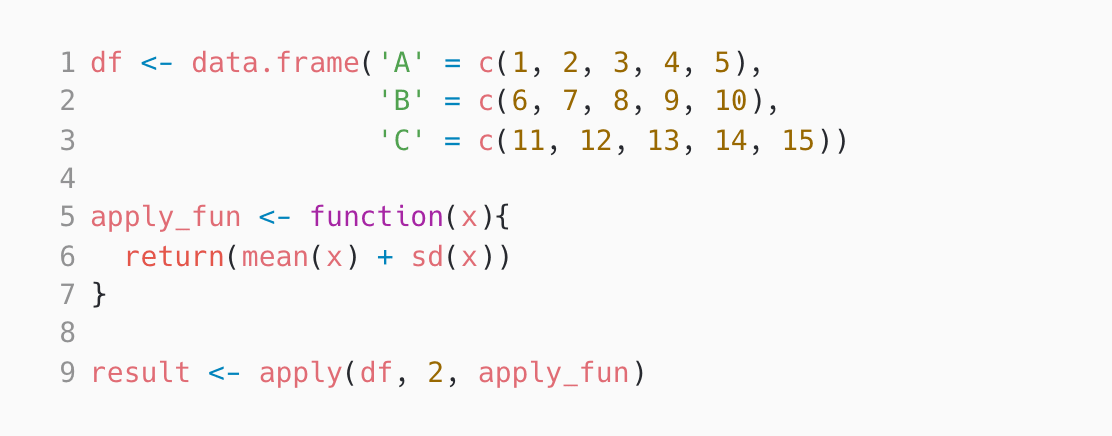
Medium Applying Functions | Solve | ||||
Medium Dataframe Transform | Solve | ||||
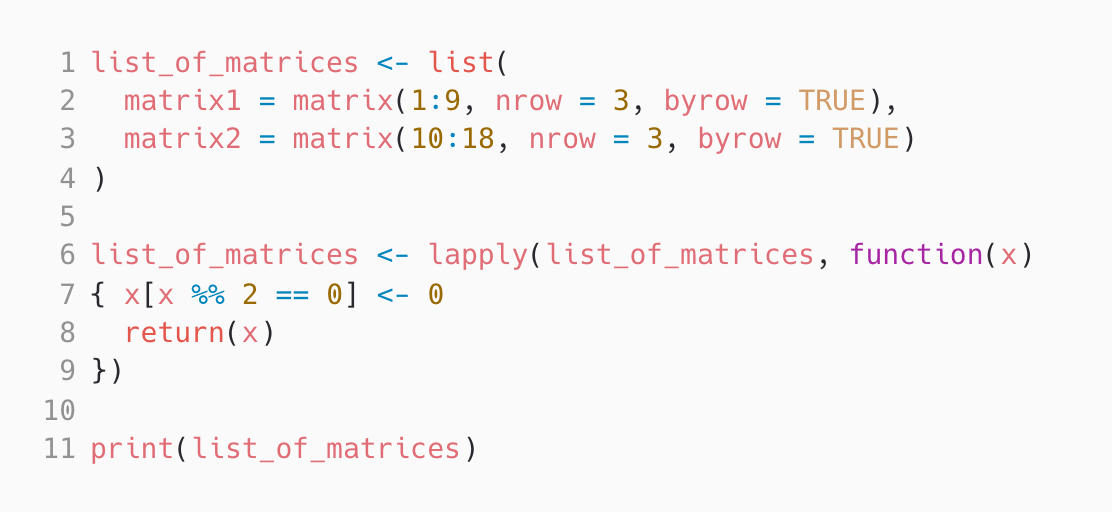
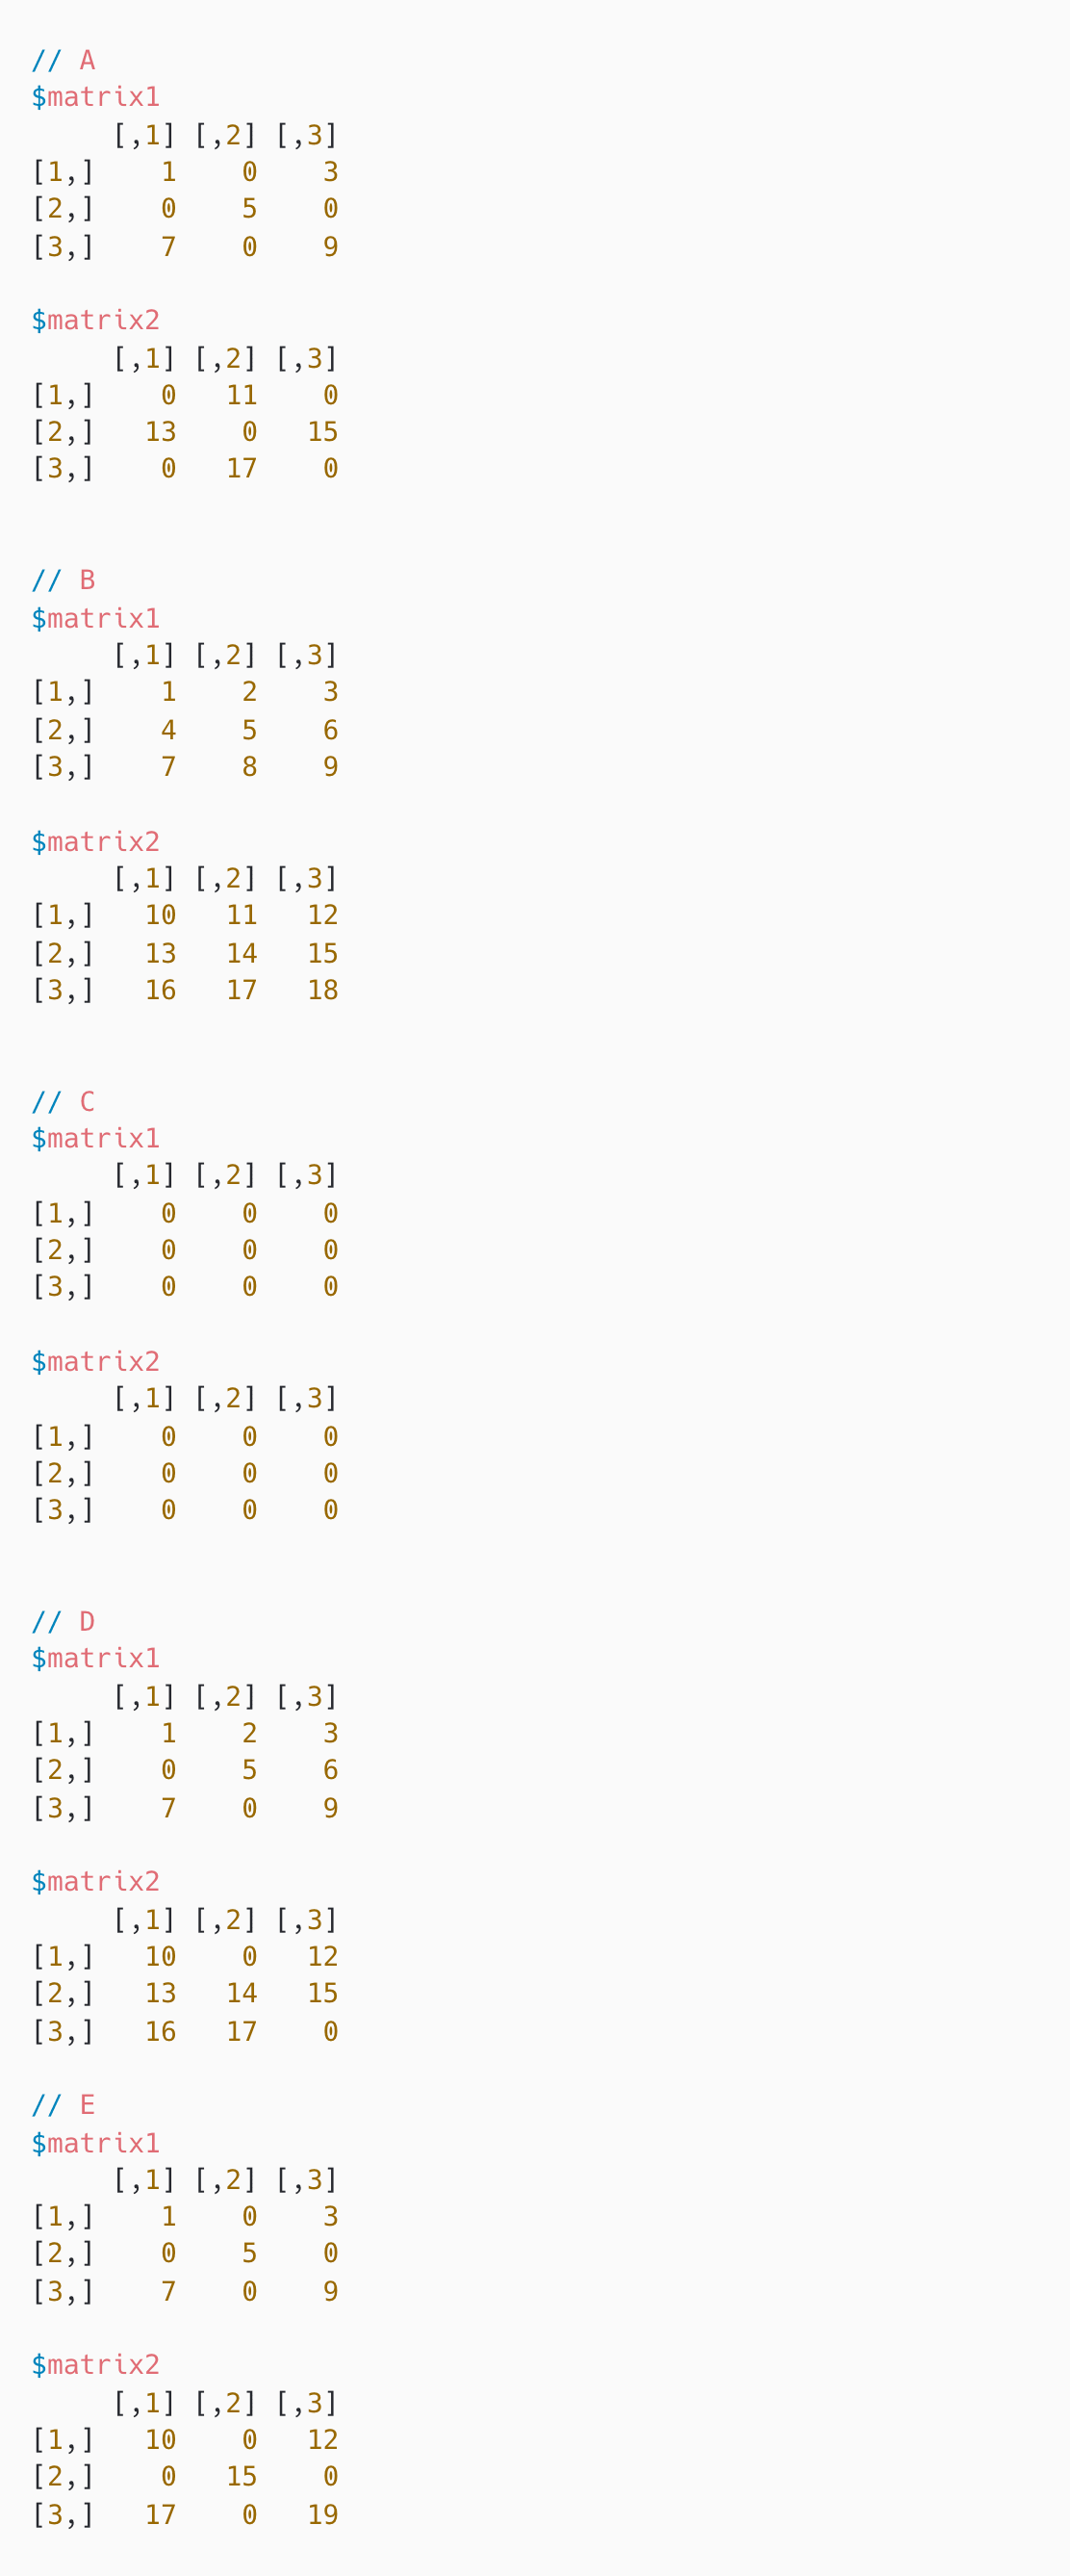
Medium Matrix Manipulation | Solve | ||||
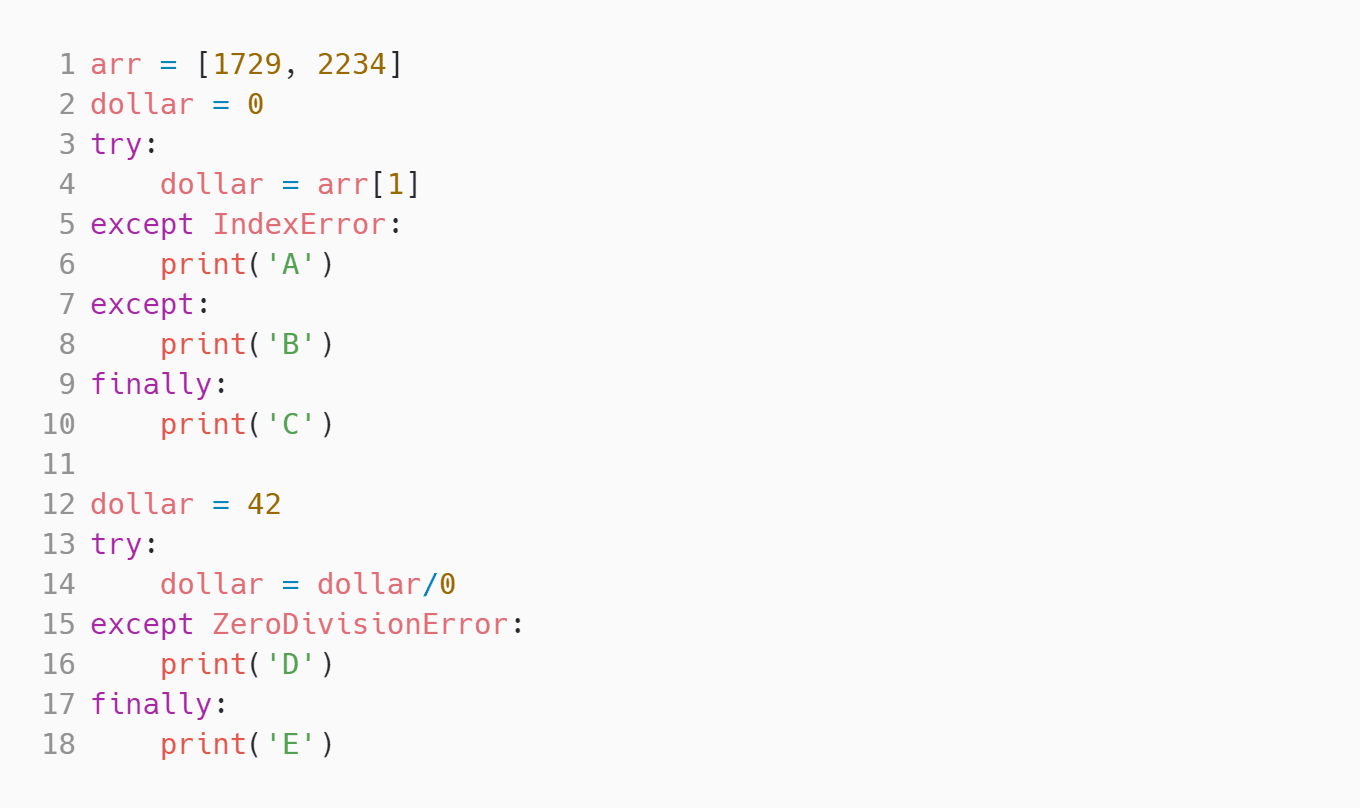
Medium ZeroDivisionError and IndexError | Solve | ||||
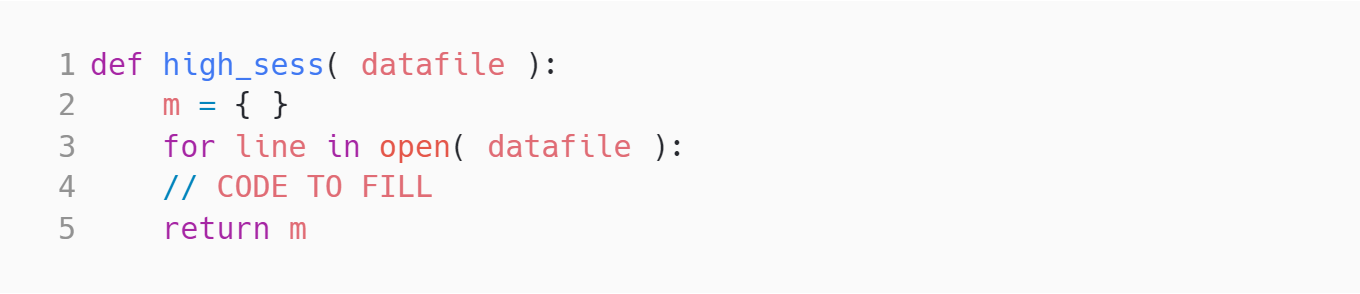
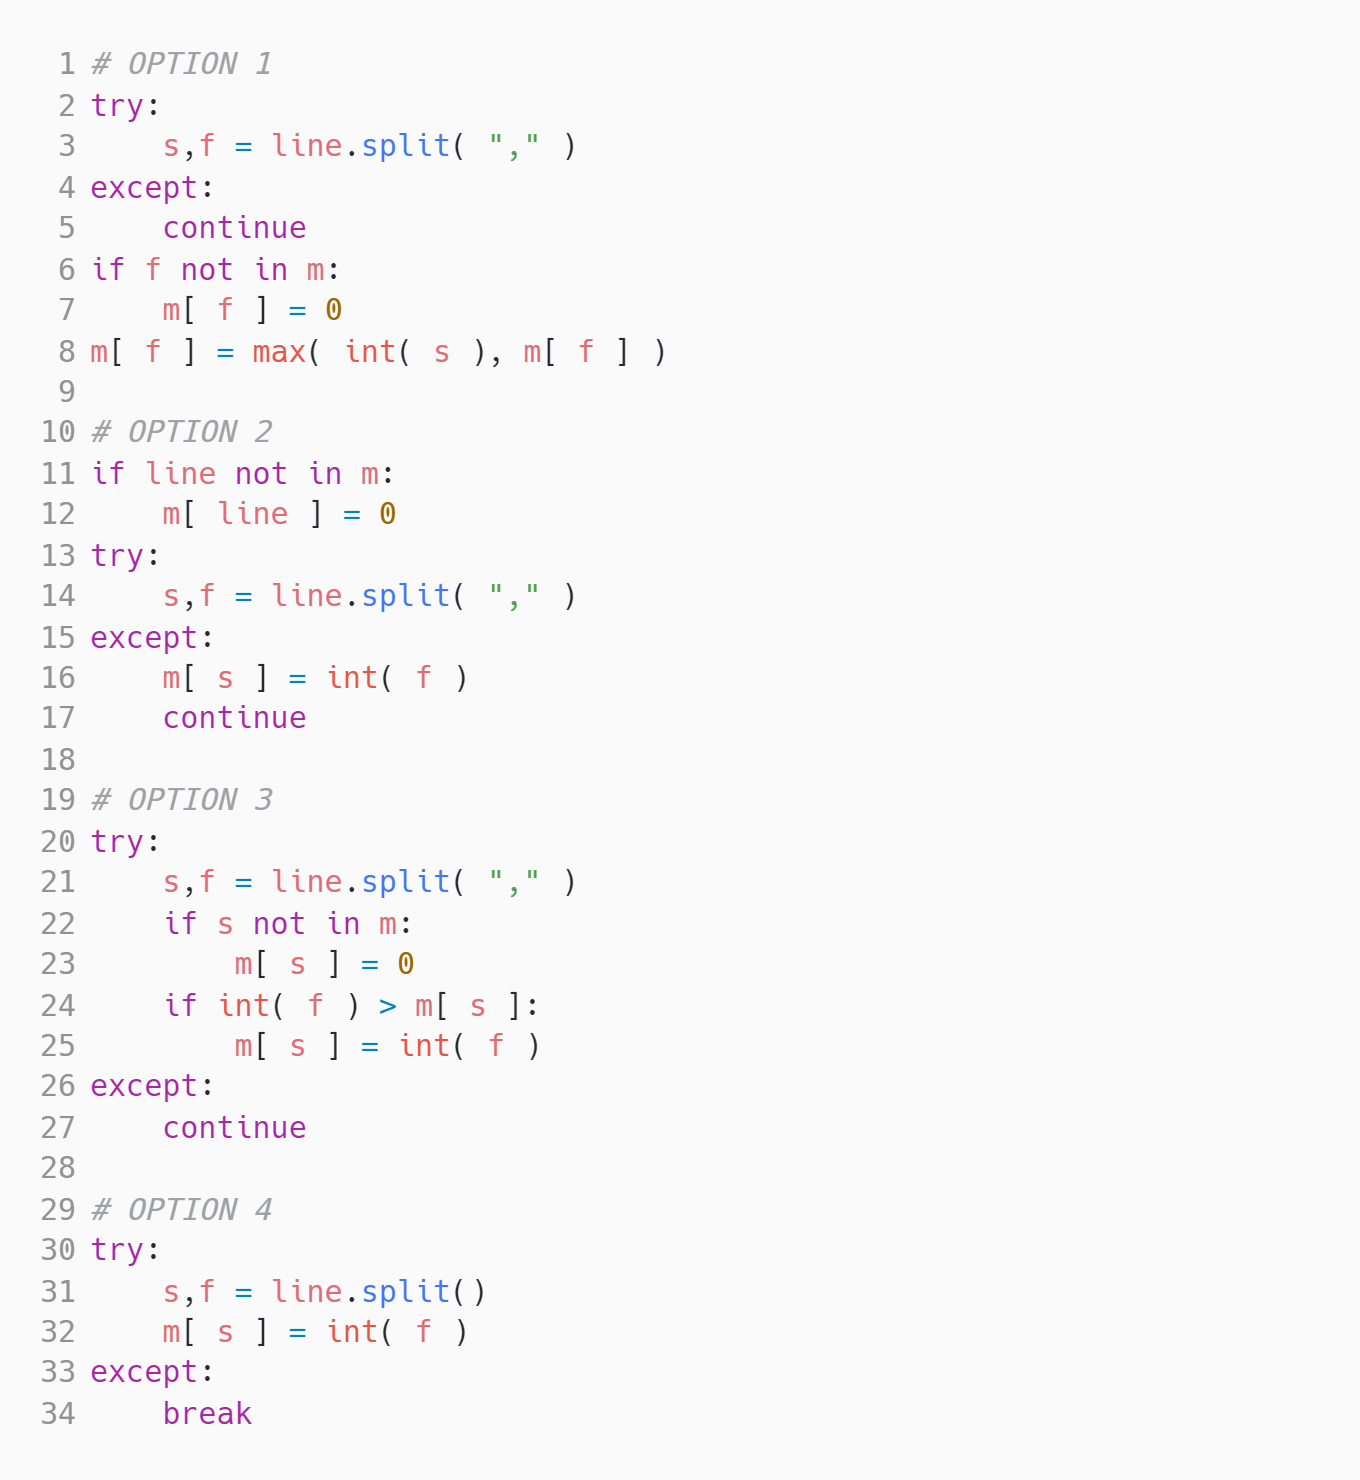
Medium Session | Solve | ||||
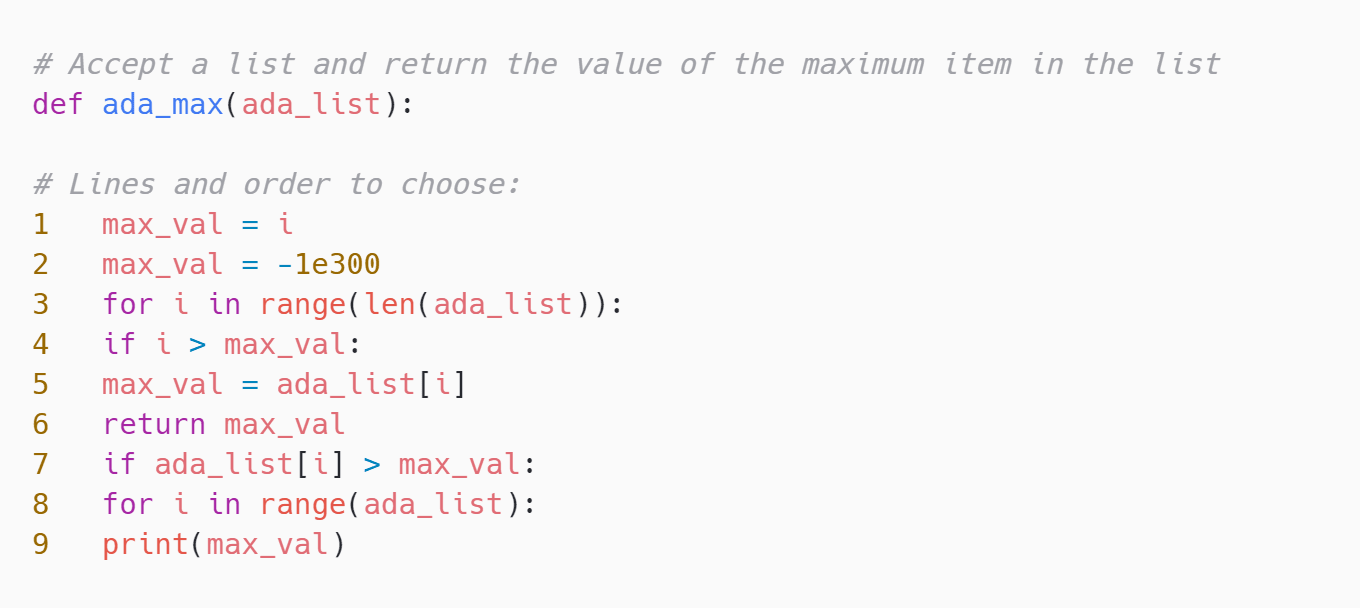
Medium Max Code | Solve | ||||
Medium Recursive Function | Solve | ||||
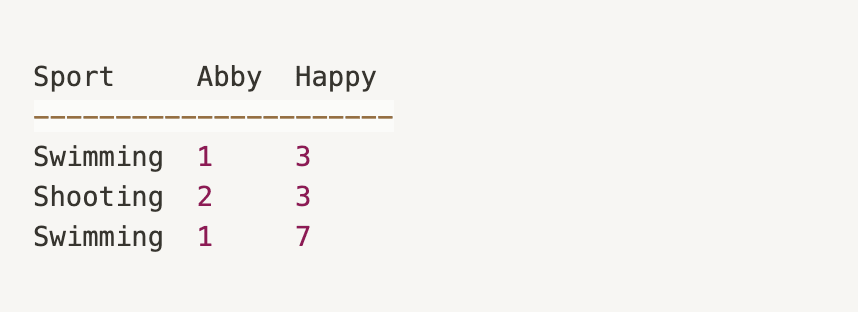
Medium Stacking problem | Solve | ||||
Medium Multi Select | Solve | ||||
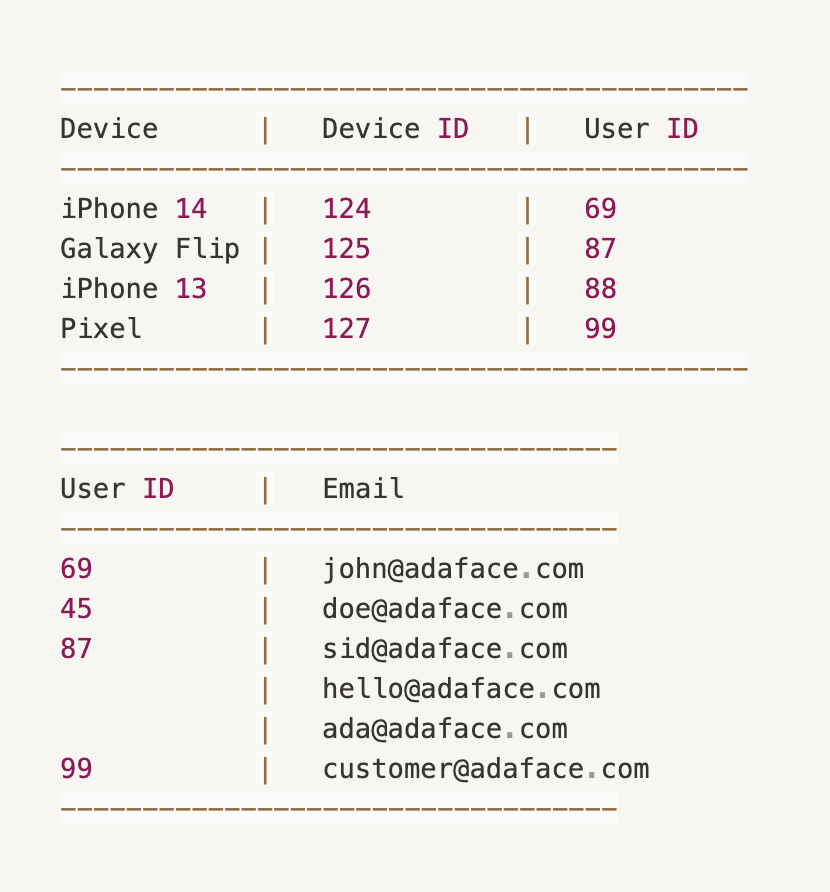
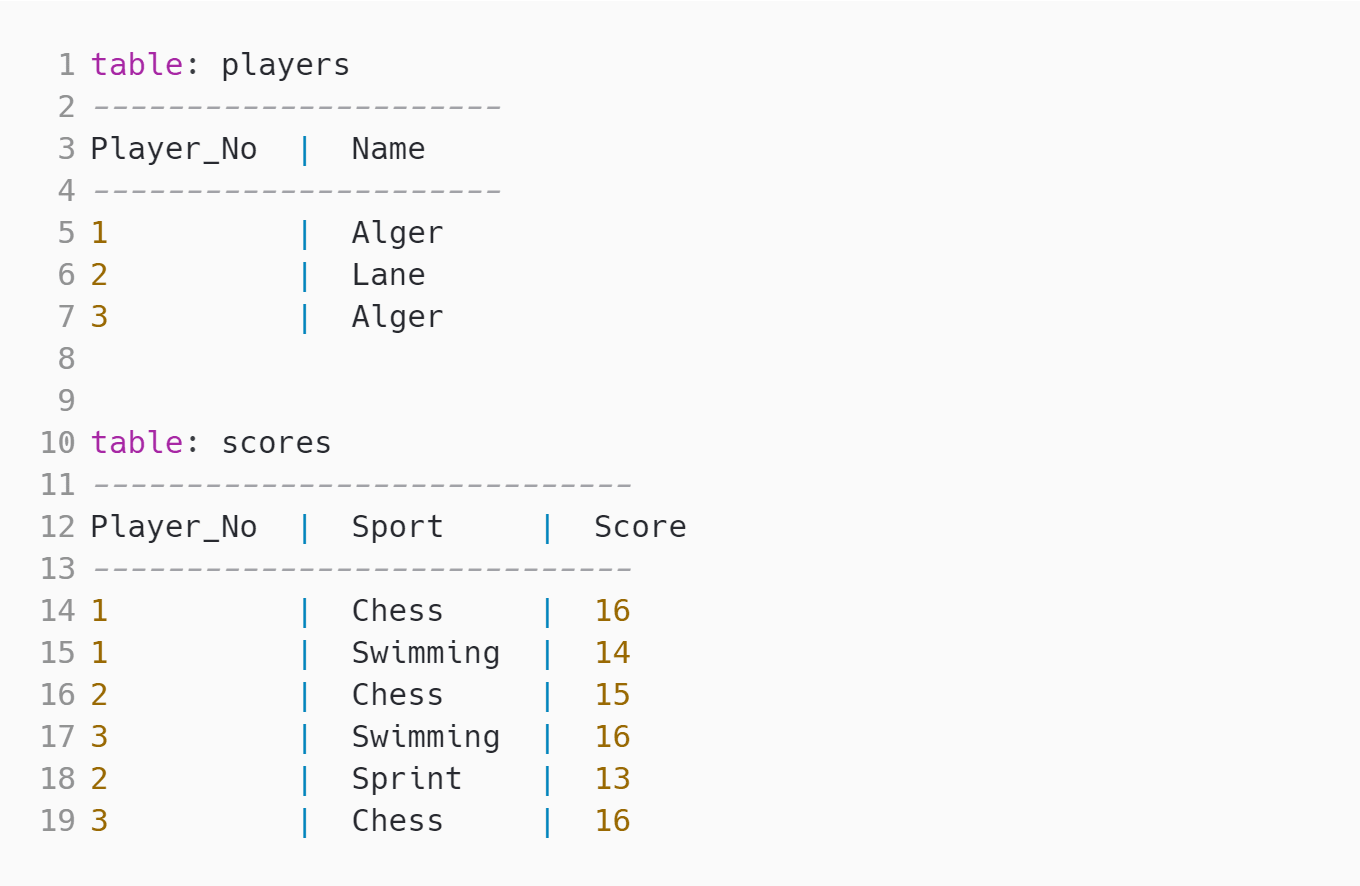
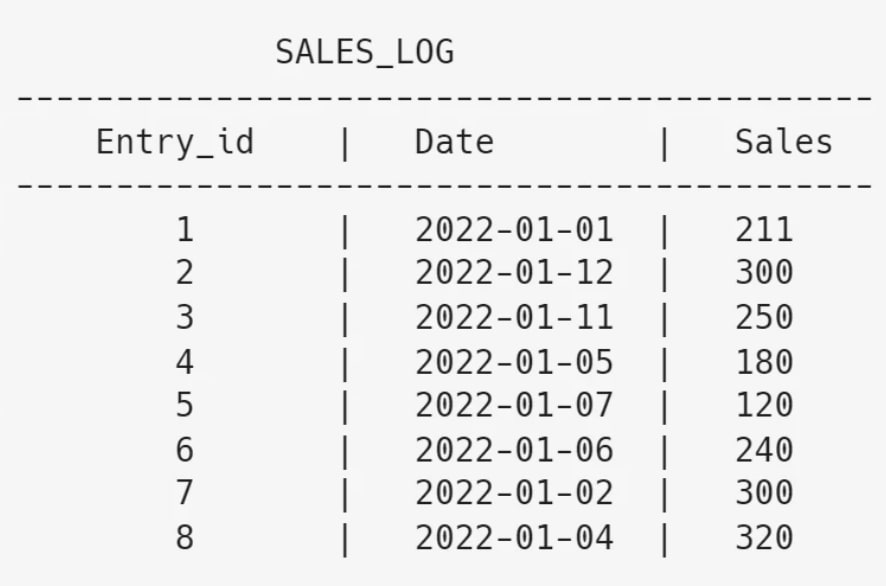
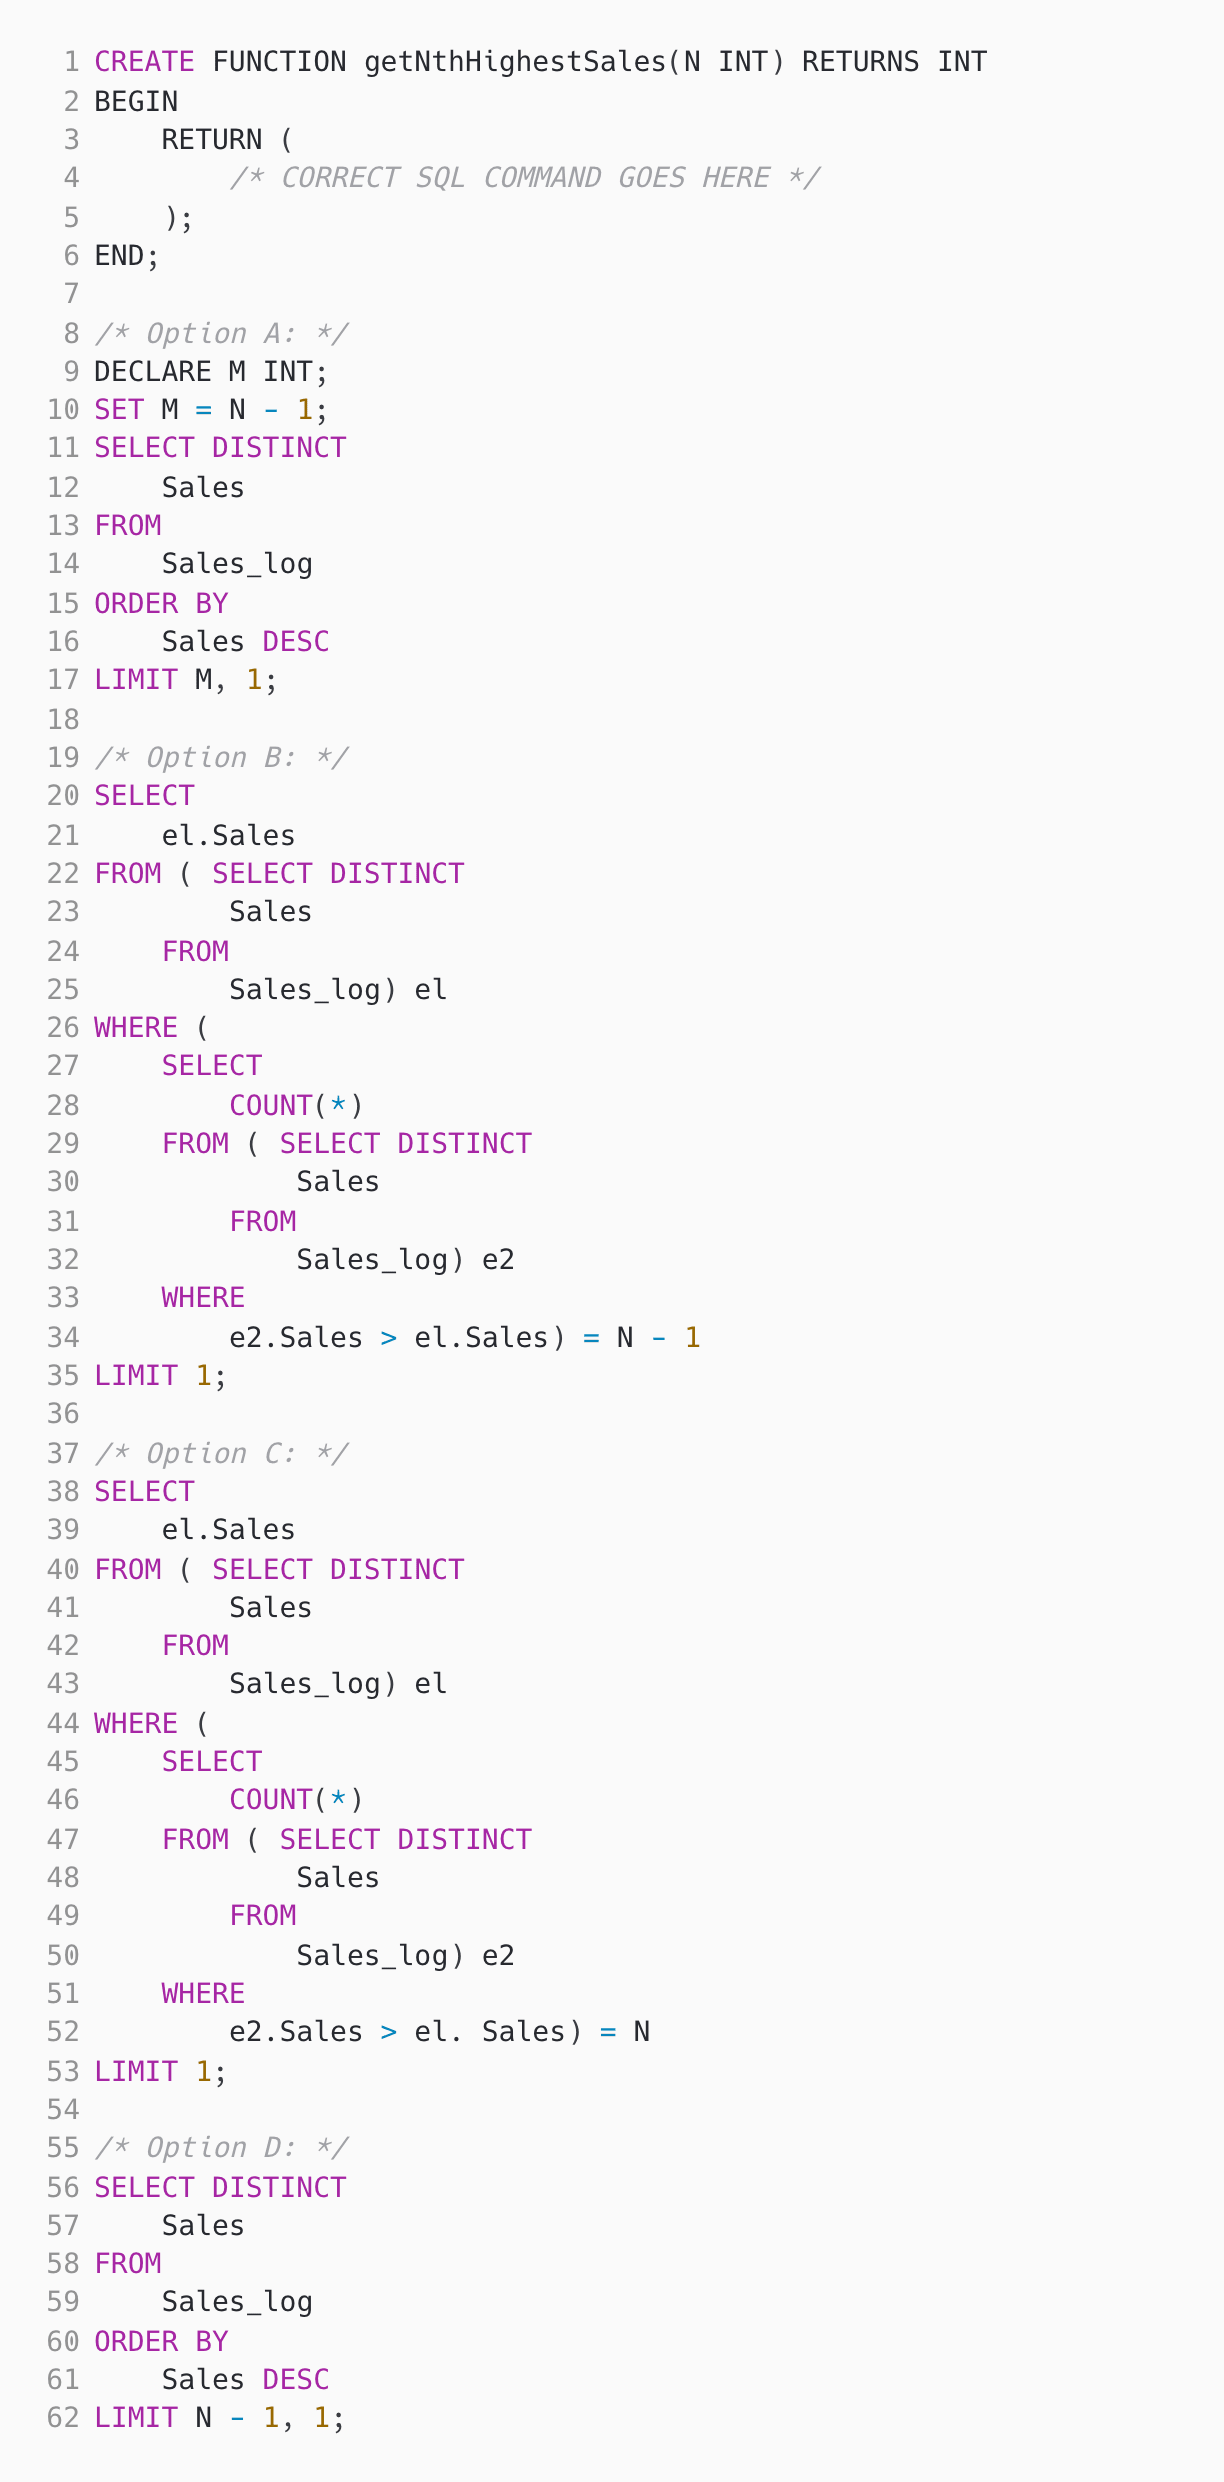
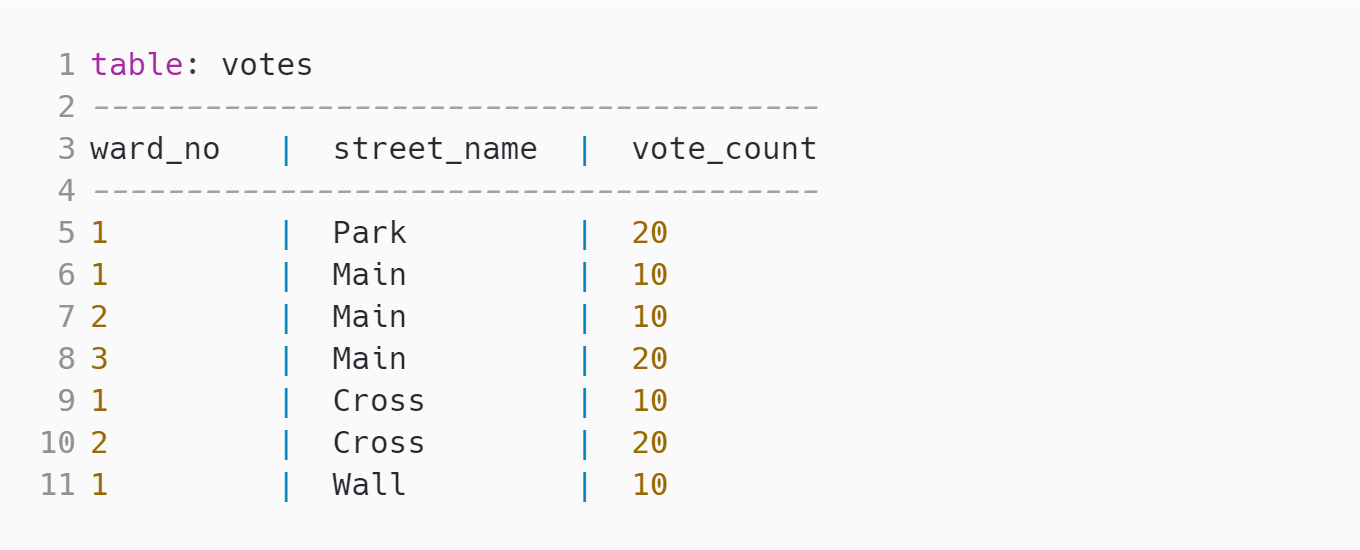
Medium nth highest sales | Solve | ||||
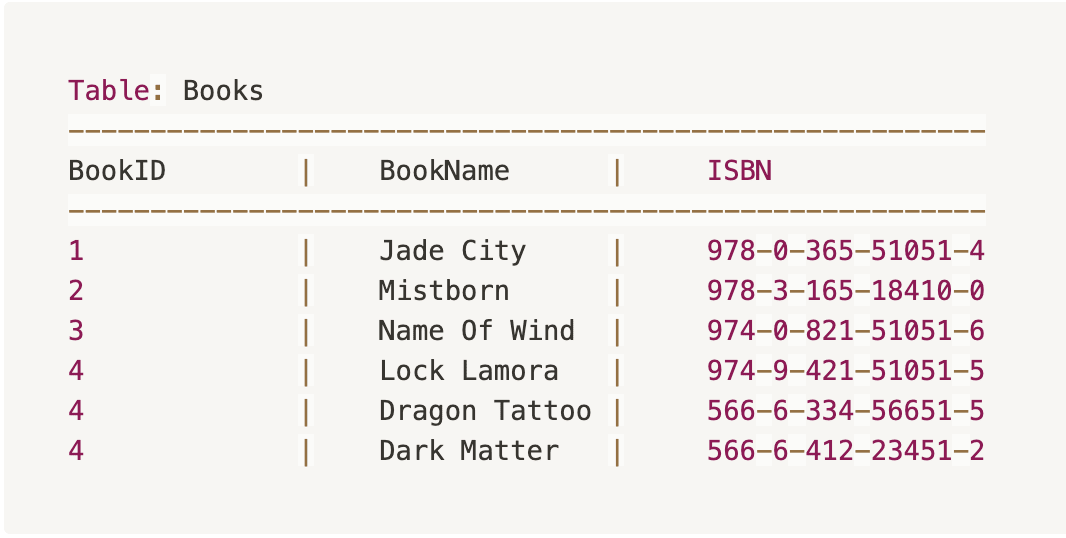
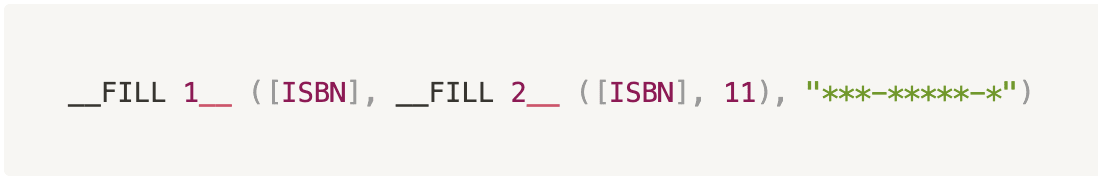
Medium Select & IN | Solve | ||||
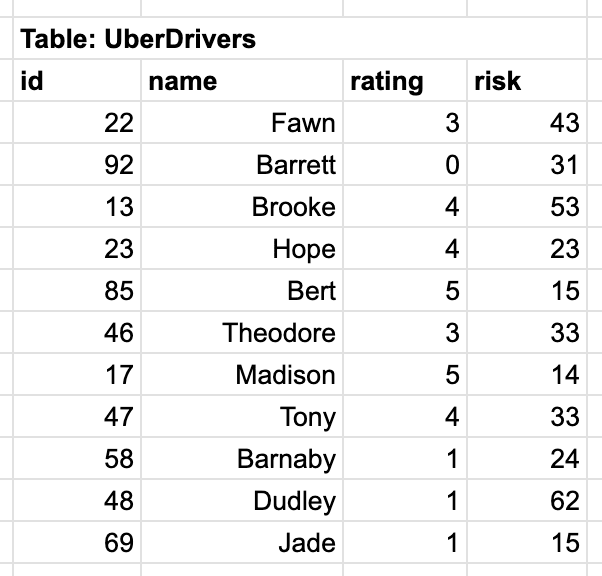
Medium Sorting Ubers | Solve | ||||
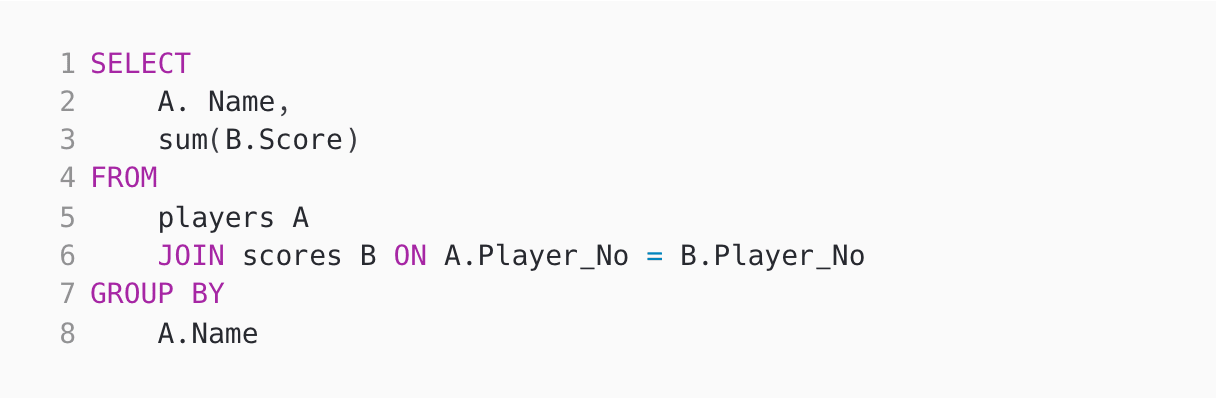
Hard With, AVG & SUM | Solve | ||||
Easy Registration Queue | Solve | ||||
Medium Visitors Count | Solve | ||||
| 🧐 Question | 🔧 Skill | ||
|---|---|---|---|
Medium Data Filtering | 2 mins Power BI | Solve | |
Medium Many-to-one error | 2 mins Power BI | Solve | |
Medium Power Query Functions | 2 mins Power BI | Solve | |
Medium Calculated Properties | 3 mins Tableau | Solve | |
Medium Change display icon | 2 mins Tableau | Solve | |
Easy Pie Chart | 3 mins Tableau | Solve | |
Medium Applying Functions | 3 mins R | Solve | |
Medium Dataframe Transform | 3 mins R | Solve | |
Medium Matrix Manipulation | 3 mins R | Solve | |
Medium ZeroDivisionError and IndexError | 2 mins Python | Solve | |
Medium Session | 2 mins Python | Solve | |
Medium Max Code | 2 mins Python | Solve | |
Medium Recursive Function | 3 mins Python | Solve | |
Medium Stacking problem | 4 mins Python | Solve | |
Medium Multi Select | 2 mins SQL | Solve | |
Medium nth highest sales | 3 mins SQL | Solve | |
Medium Select & IN | 3 mins SQL | Solve | |
Medium Sorting Ubers | 3 mins SQL | Solve | |
Hard With, AVG & SUM | 2 mins SQL | Solve | |
Easy Registration Queue | 30 mins Coding | Solve | |
Medium Visitors Count | 30 mins Coding | Solve |
| 🧐 Question | 🔧 Skill | 💪 Difficulty | ⌛ Time | ||
|---|---|---|---|---|---|
Data Filtering | Power BI | Medium | 2 mins | Solve | |
Many-to-one error | Power BI | Medium | 2 mins | Solve | |
Power Query Functions | Power BI | Medium | 2 mins | Solve | |
Calculated Properties | Tableau | Medium | 3 mins | Solve | |
Change display icon | Tableau | Medium | 2 mins | Solve | |
Pie Chart | Tableau | Easy | 3 mins | Solve | |
Applying Functions | R | Medium | 3 mins | Solve | |
Dataframe Transform | R | Medium | 3 mins | Solve | |
Matrix Manipulation | R | Medium | 3 mins | Solve | |
ZeroDivisionError and IndexError | Python | Medium | 2 mins | Solve | |
Session | Python | Medium | 2 mins | Solve | |
Max Code | Python | Medium | 2 mins | Solve | |
Recursive Function | Python | Medium | 3 mins | Solve | |
Stacking problem | Python | Medium | 4 mins | Solve | |
Multi Select | SQL | Medium | 2 mins | Solve | |
nth highest sales | SQL | Medium | 3 mins | Solve | |
Select & IN | SQL | Medium | 3 mins | Solve | |
Sorting Ubers | SQL | Medium | 3 mins | Solve | |
With, AVG & SUM | SQL | Hard | 2 mins | Solve | |
Registration Queue | Coding | Easy | 30 mins | Solve | |
Visitors Count | Coding | Medium | 30 mins | Solve |
借助 Adaface,我们能够将初步筛选流程优化高达 75% 以上,为招聘经理和我们的人才招聘团队节省了宝贵的时间!
Brandon Lee, 人事主管, Love, Bonito
The most important thing while implementing the pre-employment BI开发人员测试 in your hiring process is that it is an elimination tool, not a selection tool. In other words: you want to use the test to eliminate the candidates who do poorly on the test, not to select the candidates who come out at the top. While they are super valuable, pre-employment tests do not paint the entire picture of a candidate’s abilities, knowledge, and motivations. Multiple easy questions are more predictive of a candidate's ability than fewer hard questions. Harder questions are often "trick" based questions, which do not provide any meaningful signal about the candidate's skillset.
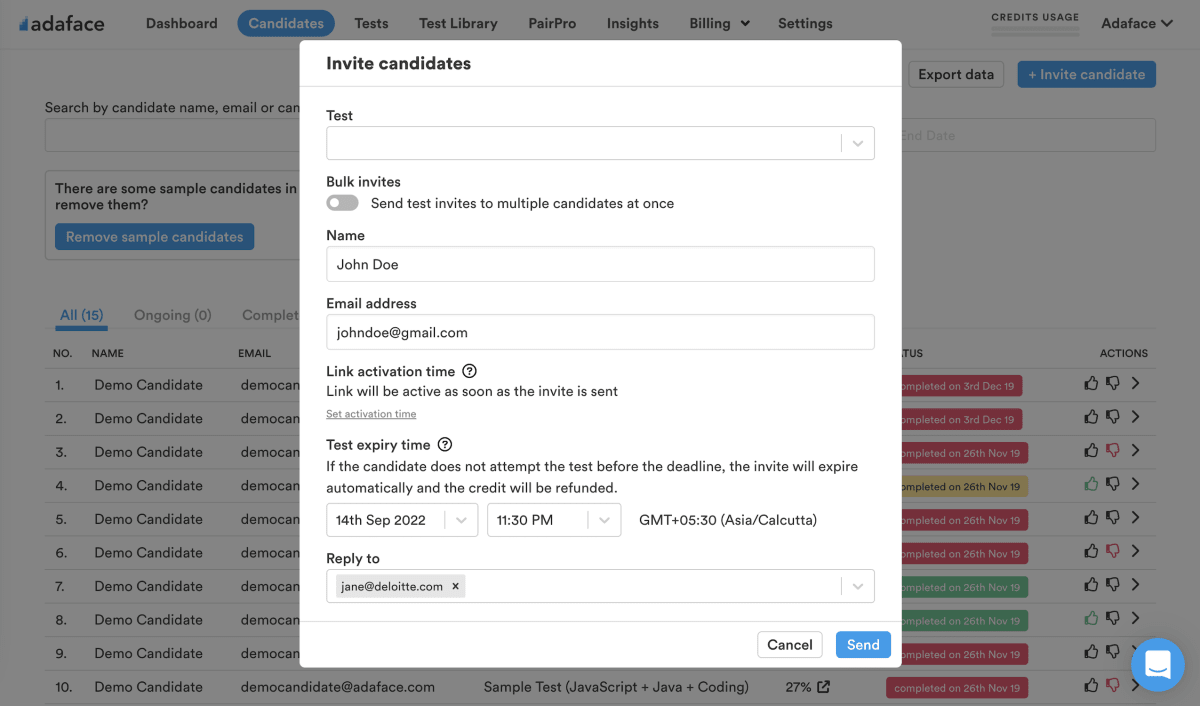
Science behind Adaface testsEmail invites: You can send candidates an email invite to the BI开发人员测试 from your dashboard by entering their email address.
Public link: You can create a public link for each test that you can share with candidates.
API or integrations: You can invite candidates directly from your ATS by using our pre-built integrations with popular ATS systems or building a custom integration with your in-house ATS.
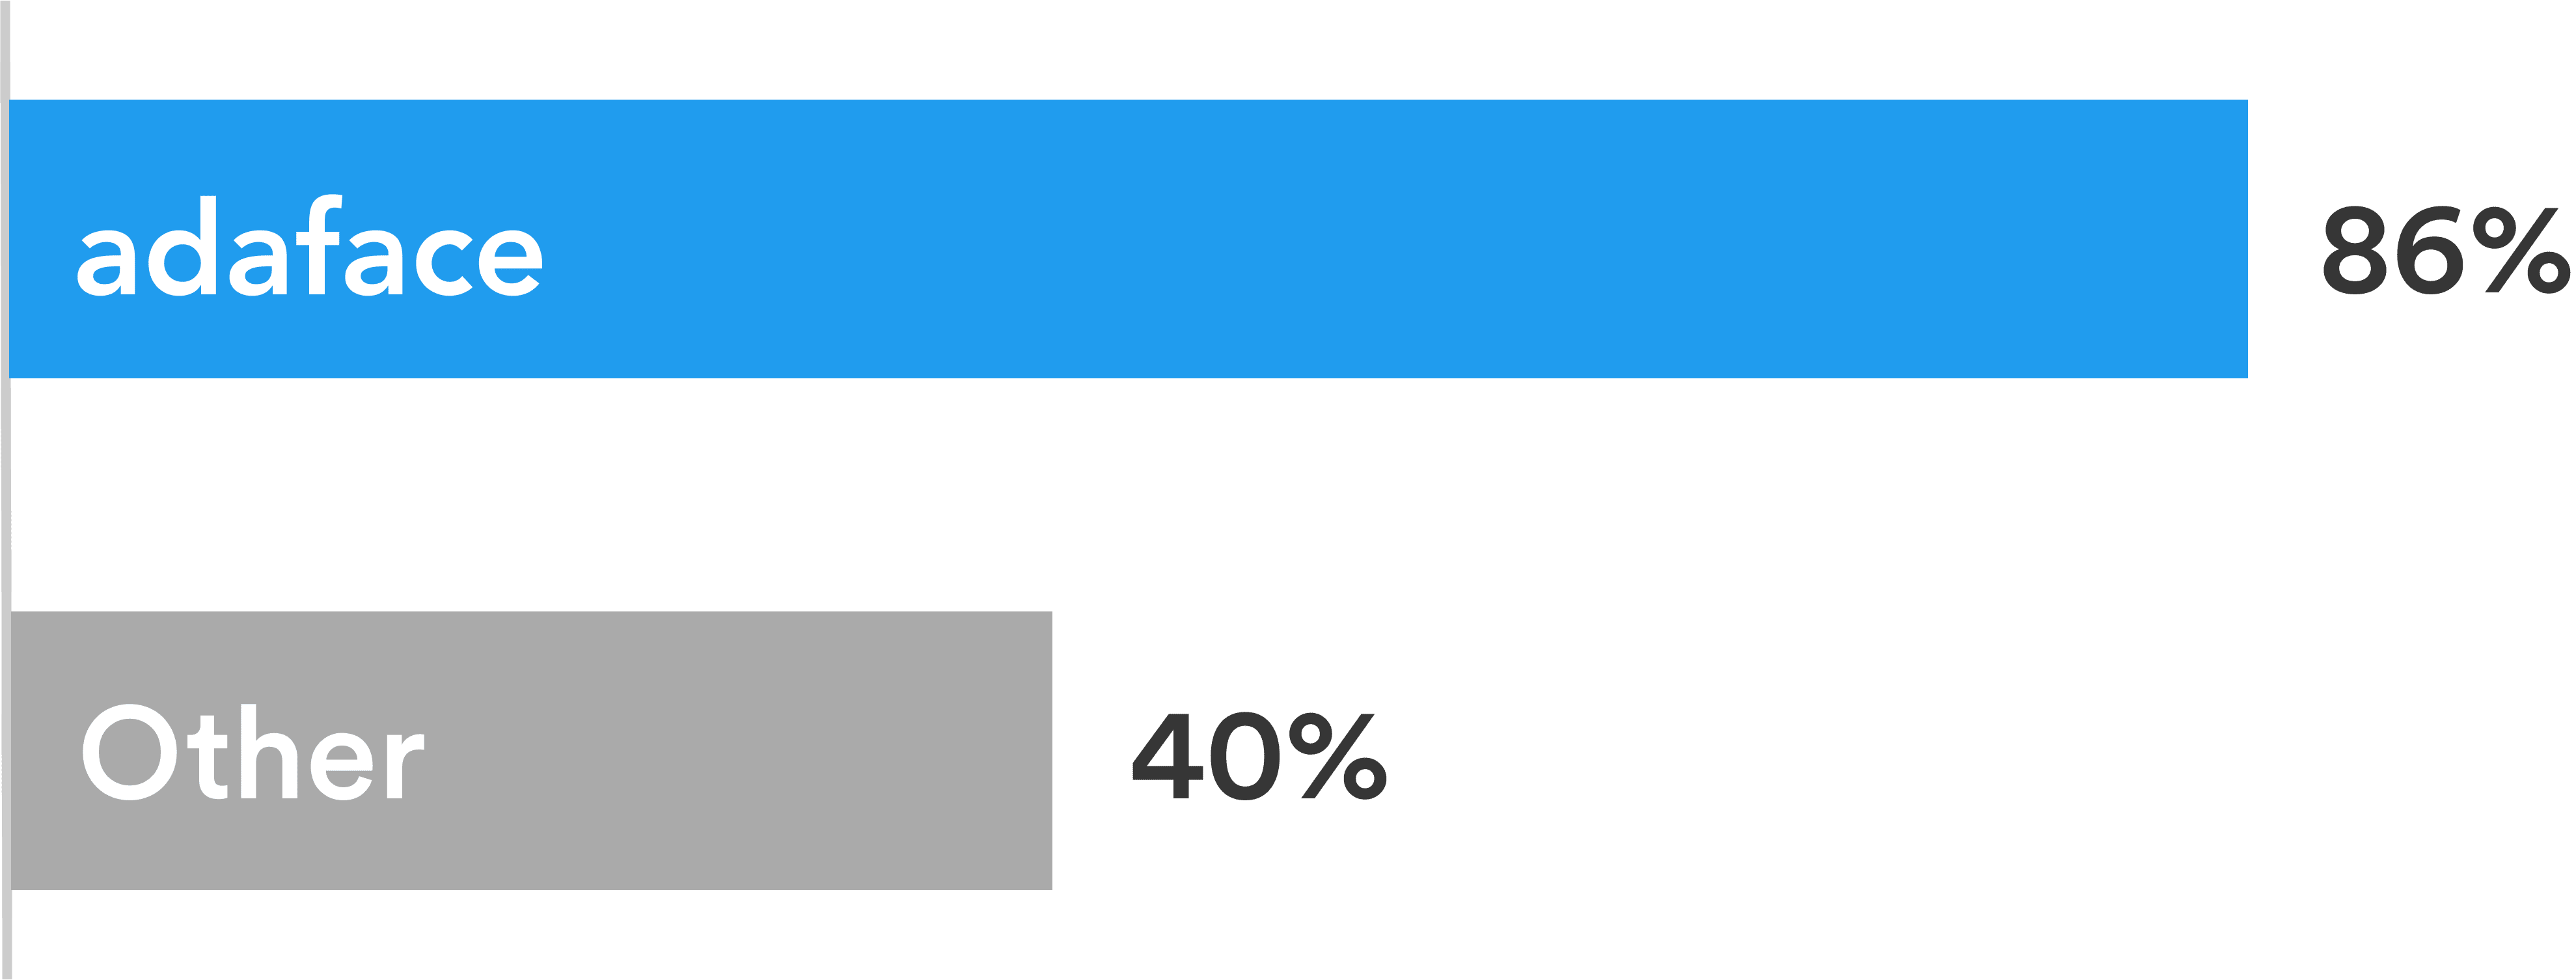
Adaface tests are conversational, low-stress, and take just 25-40 mins to complete.
This is why Adaface has the highest test-completion rate (86%), which is more than 2x better than traditional assessments.
ChatGPT protection
Screen proctoring
Plagiarism detection
Non-googleable questions
User authentication
IP proctoring
Web proctoring
Webcam proctoring
Full screen proctoring
Copy paste protection
招聘经理认为,通过小组面试中提出的技术问题,他们能够判断哪些候选人得分更高,并与得分较差的候选人区分开来。他们是 非常满意 通过 Adaface 筛选入围的候选人的质量。
是的,一点没错。自定义评估是根据您的职位描述进行的,并将包括有关您指定的所有必备技能的问题。
我们具有以下反交易功能:
阅读有关[Proctoring功能](https://www.adaface.com/proctoring)的更多信息。
要记住的主要问题是评估是消除工具,而不是选择工具。优化了技能评估,以帮助您消除在技术上没有资格担任该角色的候选人,它没有进行优化以帮助您找到该角色的最佳候选人。因此,使用评估的理想方法是确定阈值分数(通常为55%,我们为您提供基准测试),并邀请所有在下一轮面试中得分高于门槛的候选人。
每个ADAFACE评估都是为您的职位描述/理想候选角色定制的(我们的主题专家将从我们的10000多个问题的图书馆中选择正确的问题)。可以为任何经验级别定制此评估。
是的,这使您比较候选人变得容易得多。 MCQ问题的选项和问题顺序是随机的。我们有[抗欺骗/策略](https://www.adaface.com/proctoring)功能。在我们的企业计划中,我们还可以选择使用类似难度级别的问题创建多个版本的相同评估。
不,不幸的是,我们目前不支持实践测试。但是,您可以使用我们的[示例问题](https://www.adaface.com/questions)进行练习。
您可以查看我们的[定价计划](https://www.adaface.com/pricing/)。