Test Duration
70 мин
Difficulty Level
Moderate
Questions
- 5 Сила би MCQs
- 5 Таблица MCQs
- 4 р MCQs
- 5 Питон MCQs
- 5 SQL MCQs
- 1 Питон Coding Question
Availability
Ready to use
About the test:
В тесте разработчика бизнес-аналитики используются вопросы с множественным выбором на основе сценариев для оценки знаний и навыков кандидата, связанных с моделированием данных и процессами ETL, хранилищем данных и интеллектуальным анализом, отчетностью и визуализацией BI, анализом данных и прогнозированием моделирования и управлением BI проекта. Кандидаты также оцениваются по их способности использовать BI -инструменты и технологии, такие как SQL Server, Power BI, Tableau и другие связанные инструменты, и их знание применения анализа данных и методов бизнес -аналитики для решения сложных бизнес -задач.
Covered skills:
Test Duration
70 мин
Difficulty Level
Moderate
Questions
Availability
Ready to use
The BI Developer Test helps recruiters and hiring managers identify qualified candidates from a pool of resumes, and helps in taking objective hiring decisions. It reduces the administrative overhead of interviewing too many candidates and saves time by filtering out unqualified candidates at the first step of the hiring process.
The test screens for the following skills that hiring managers look for in candidates:
Traditional assessment tools use trick questions and puzzles for the screening, which creates a lot of frustration among candidates about having to go through irrelevant screening assessments.
The main reason we started Adaface is that traditional pre-employment assessment platforms are not a fair way for companies to evaluate candidates. At Adaface, our mission is to help companies find great candidates by assessing on-the-job skills required for a role.
Why we started AdafaceWe have a very high focus on the quality of questions that test for on-the-job skills. Every question is non-googleable and we have a very high bar for the level of subject matter experts we onboard to create these questions. We have crawlers to check if any of the questions are leaked online. If/ when a question gets leaked, we get an alert. We change the question for you & let you know.
How we design questionsЭто лишь небольшая выборка из нашей библиотеки из более чем более 10000 вопросов. Фактические вопросы по этому поводу BI Developer Test будет не подлежащим гугливым.
| 🧐 Question | |||||
|---|---|---|---|---|---|
Medium Data Filtering | Solve | ||||
Medium Many-to-one error | Solve | ||||
Medium Power Query Functions | Solve | ||||
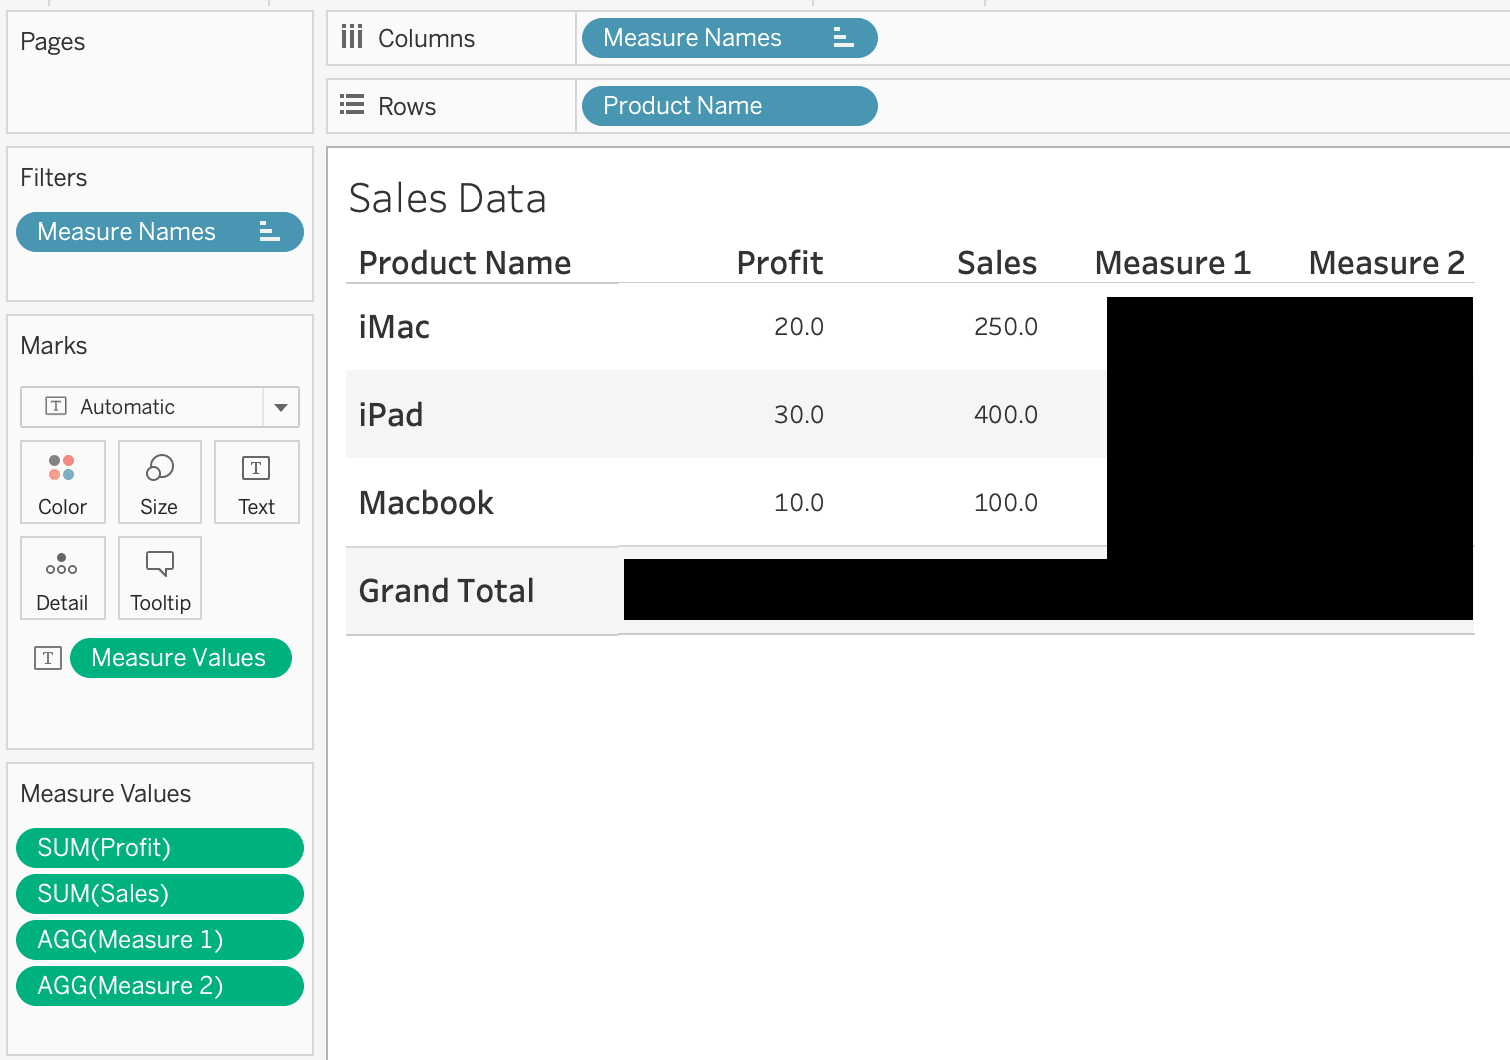
Medium Calculated Properties | Solve | ||||
Medium Change display icon | Solve | ||||
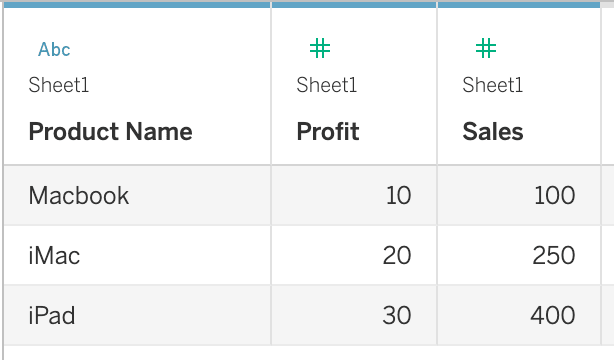
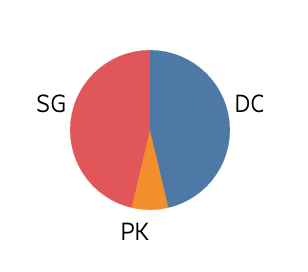
Easy Pie Chart | Solve | ||||
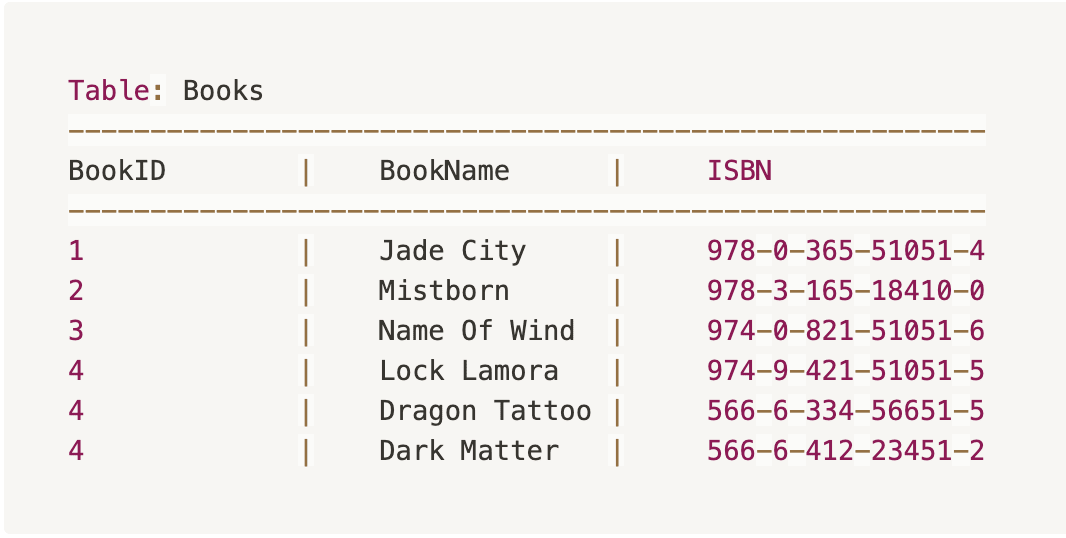
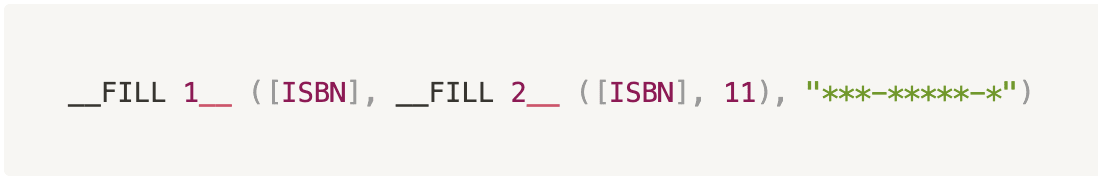
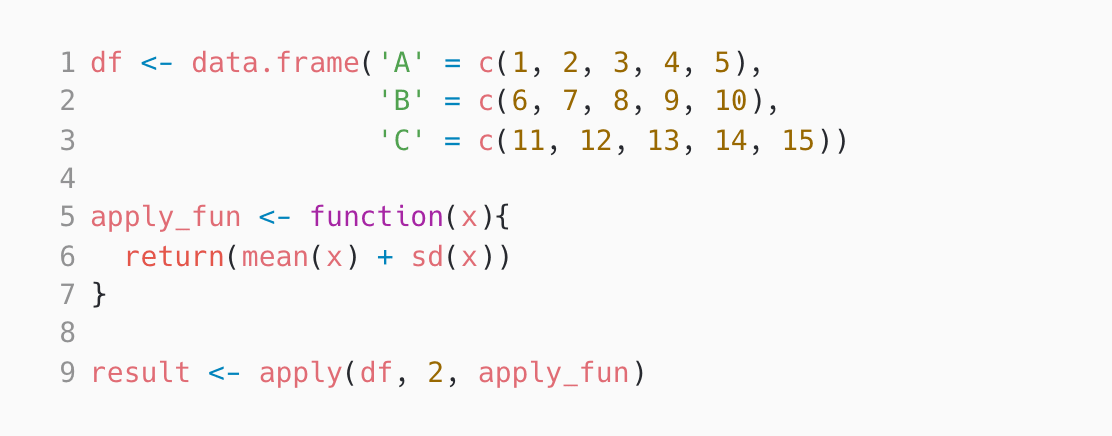
Medium Applying Functions | Solve | ||||
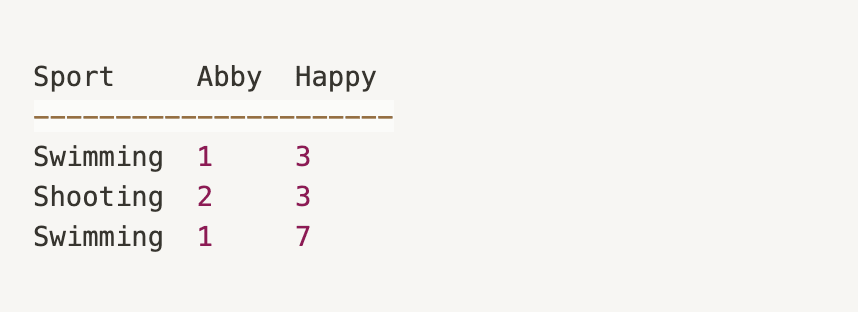
Medium Dataframe Transform | Solve | ||||
Medium Matrix Manipulation | Solve | ||||
Medium ZeroDivisionError and IndexError | Solve | ||||
Medium Session | Solve | ||||
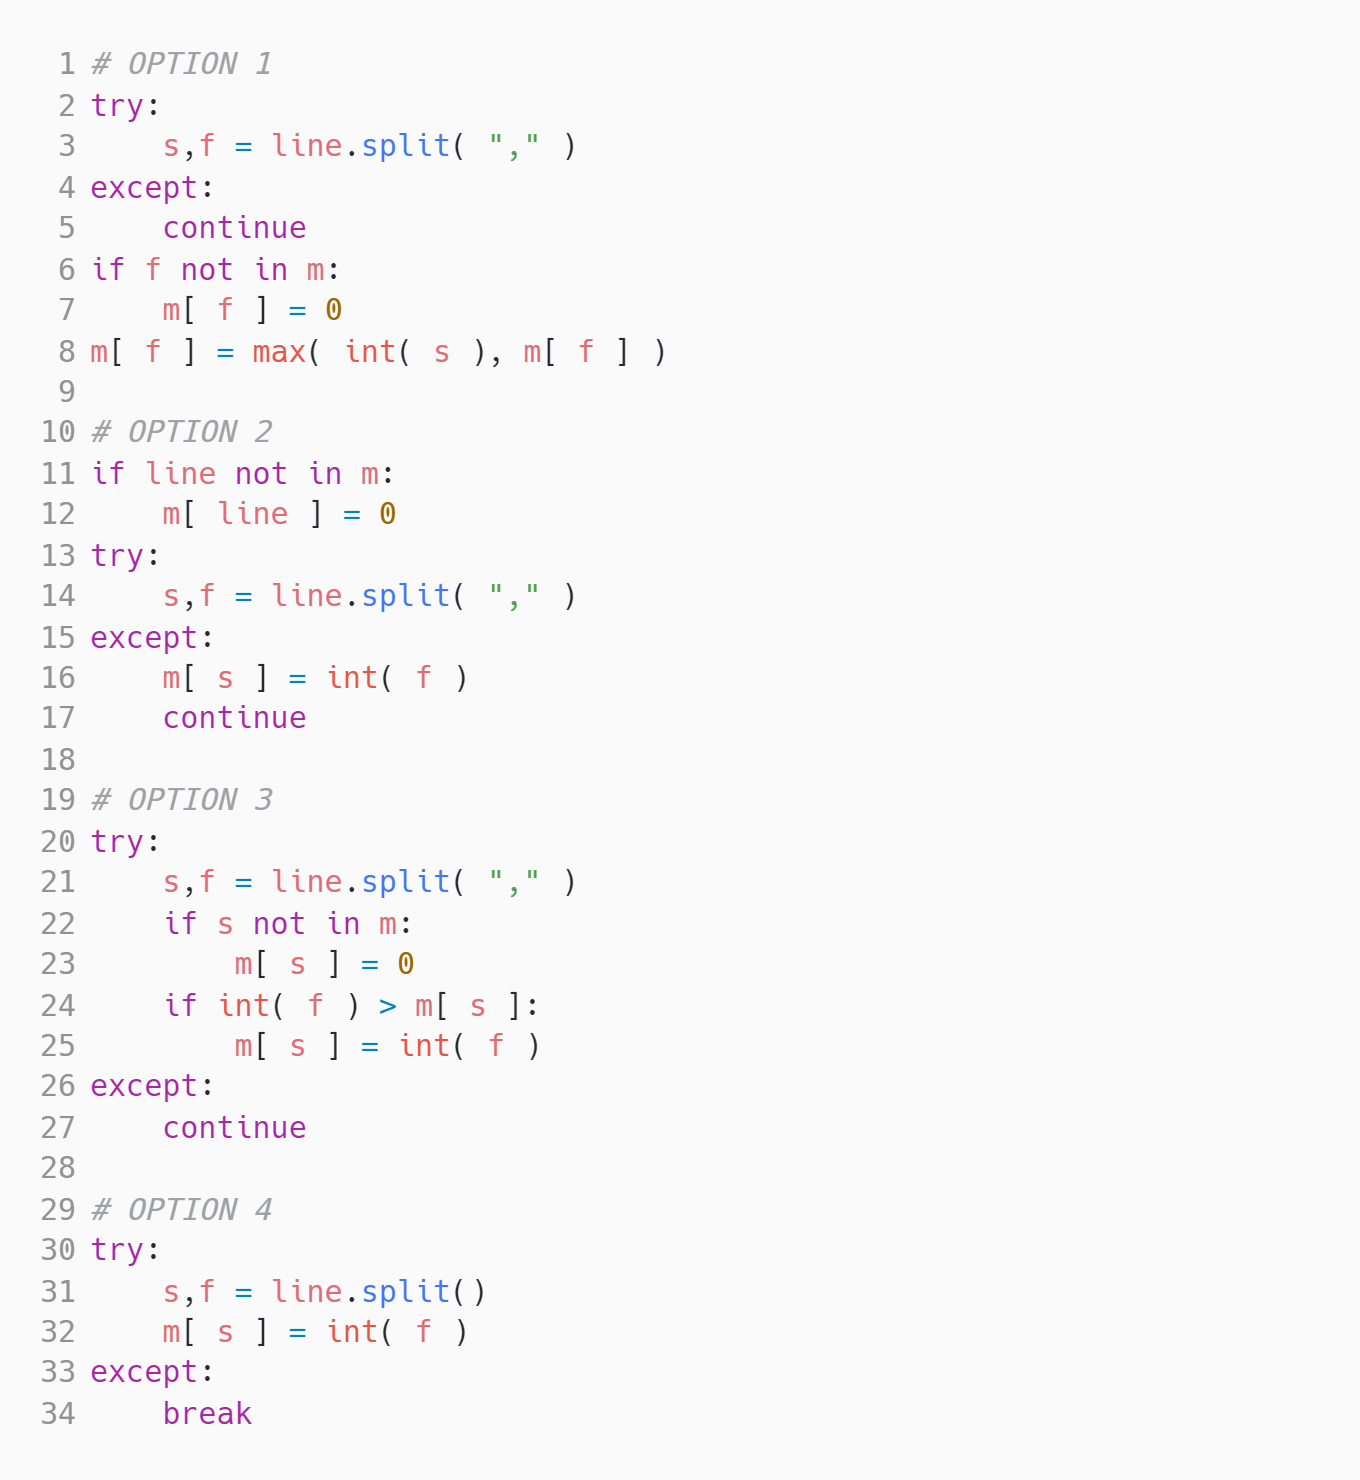
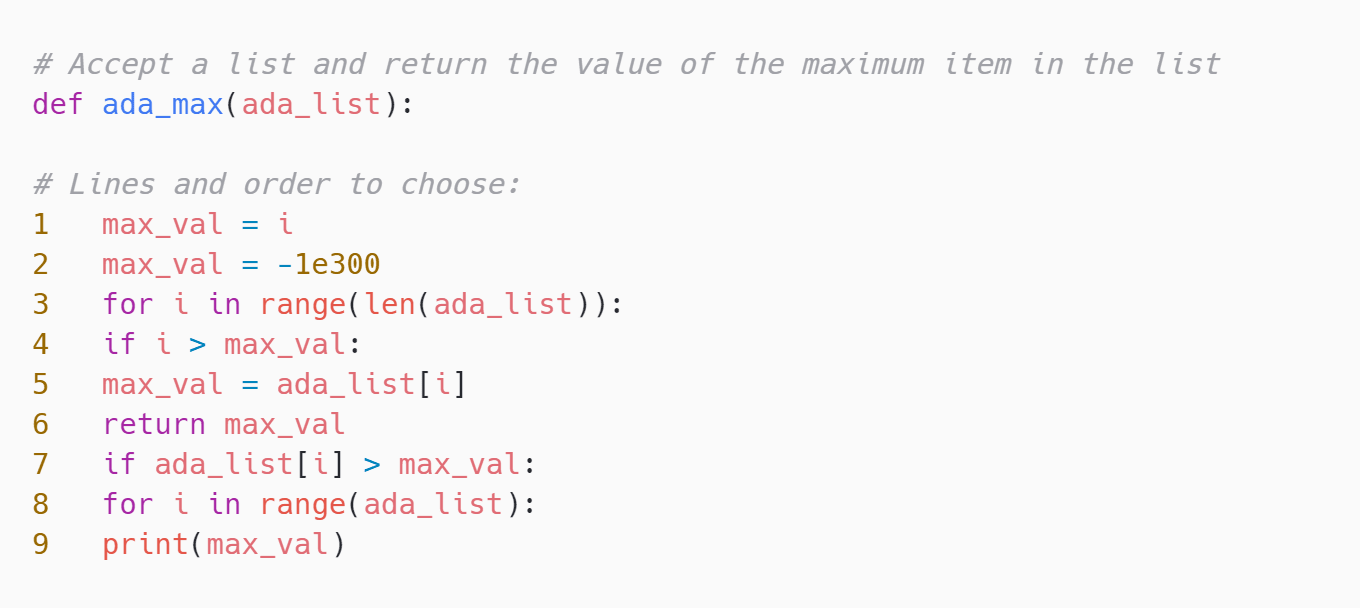
Medium Max Code | Solve | ||||
Medium Recursive Function | Solve | ||||
Medium Stacking problem | Solve | ||||
Medium Multi Select | Solve | ||||
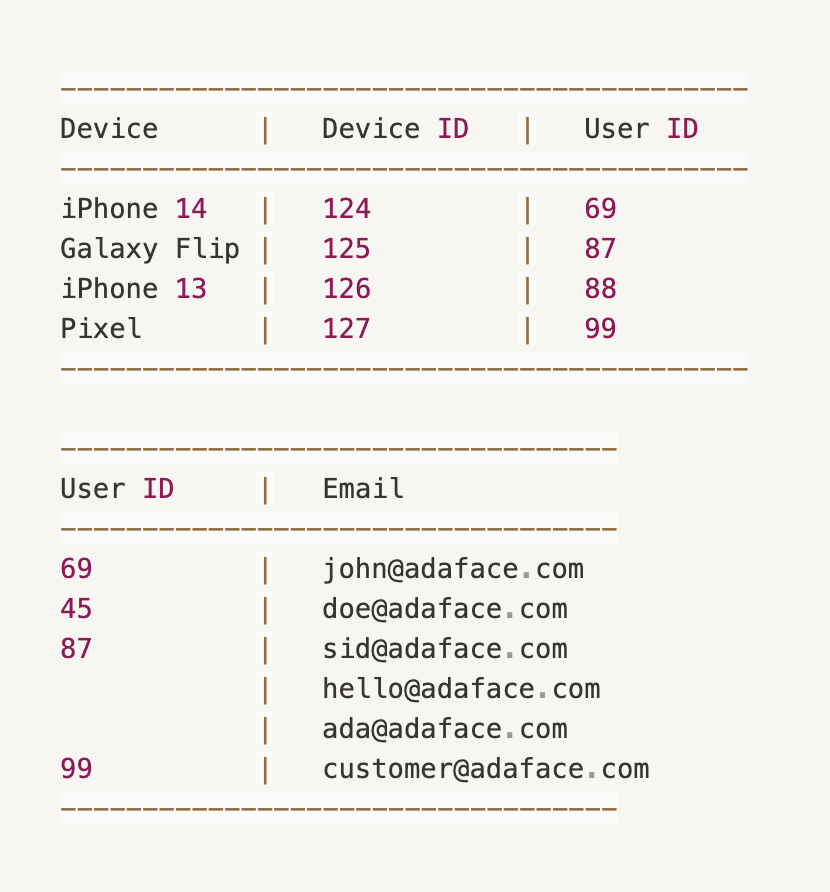
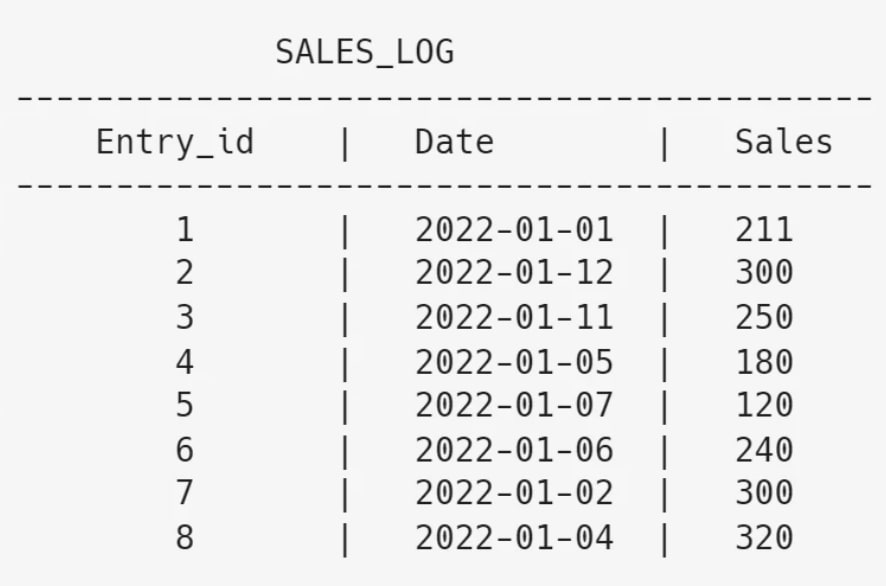
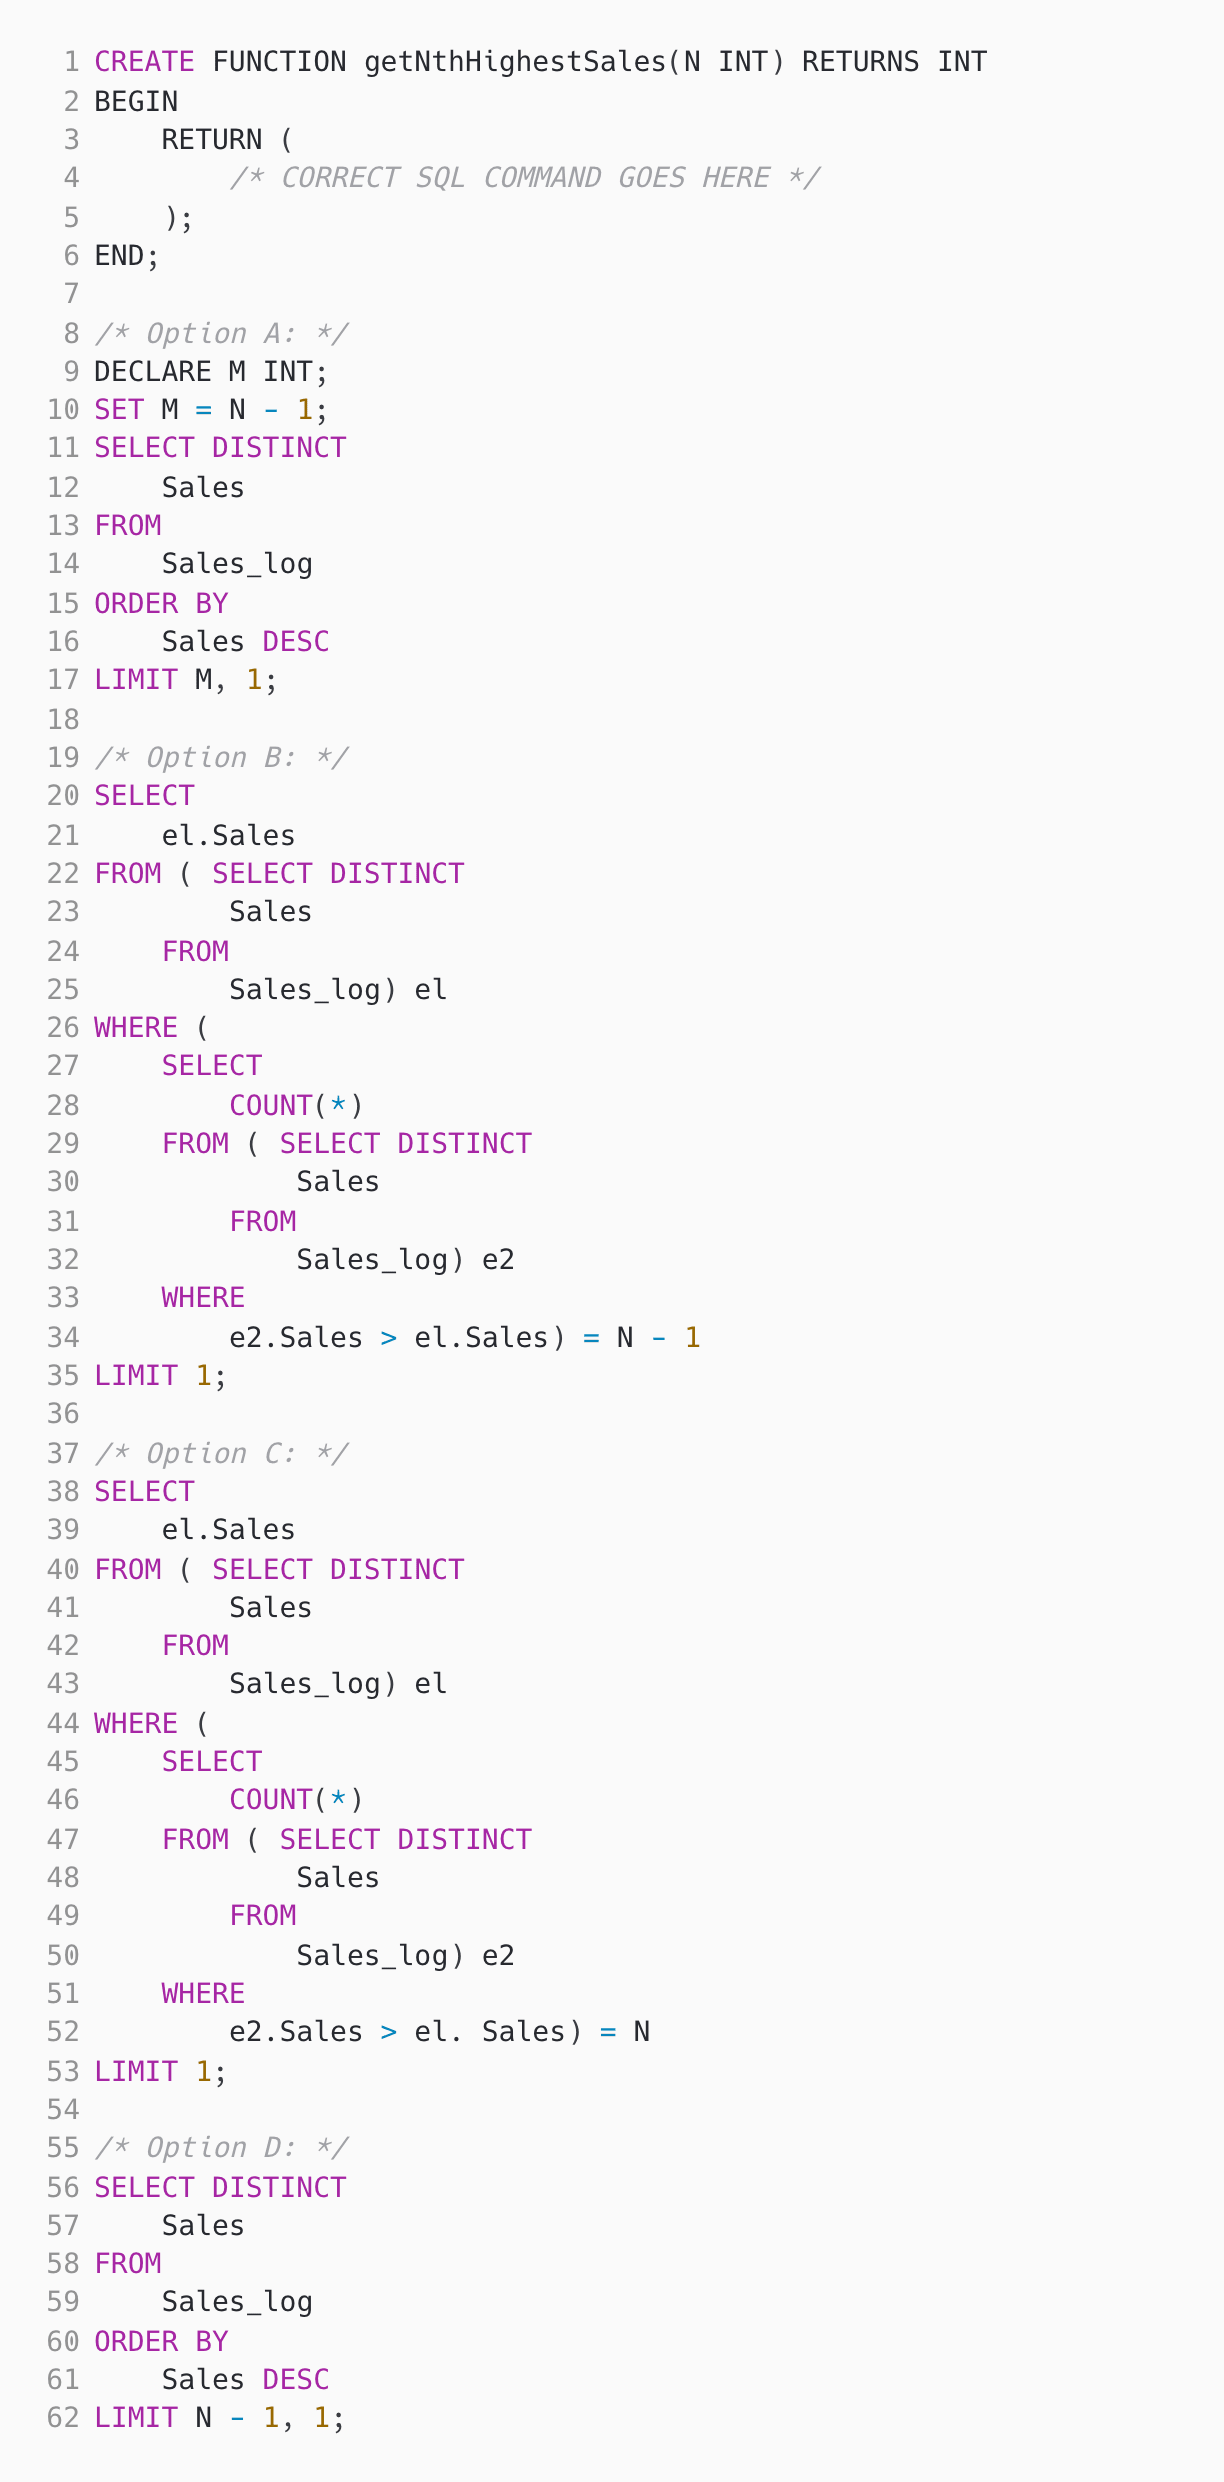
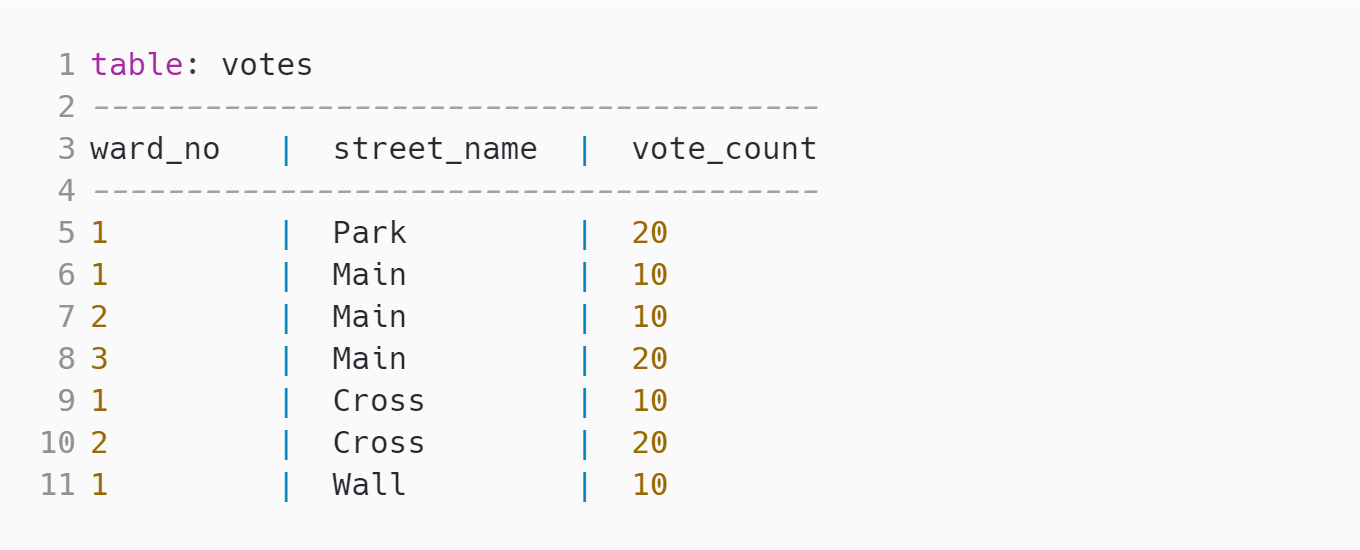
Medium nth highest sales | Solve | ||||
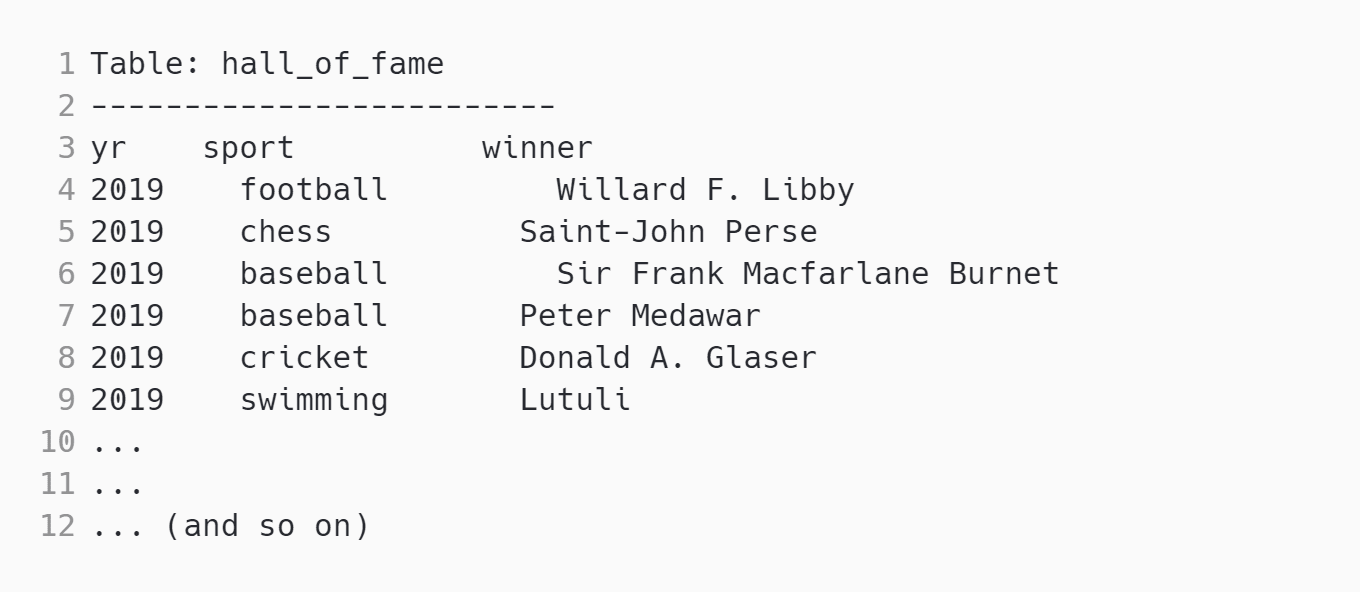
Medium Select & IN | Solve | ||||
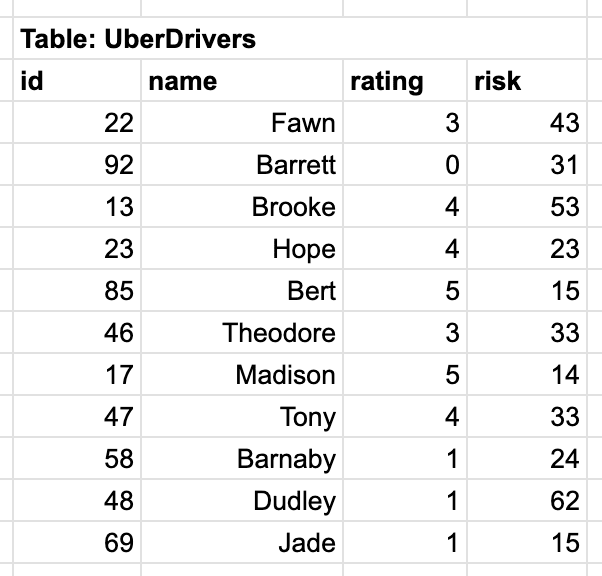
Medium Sorting Ubers | Solve | ||||
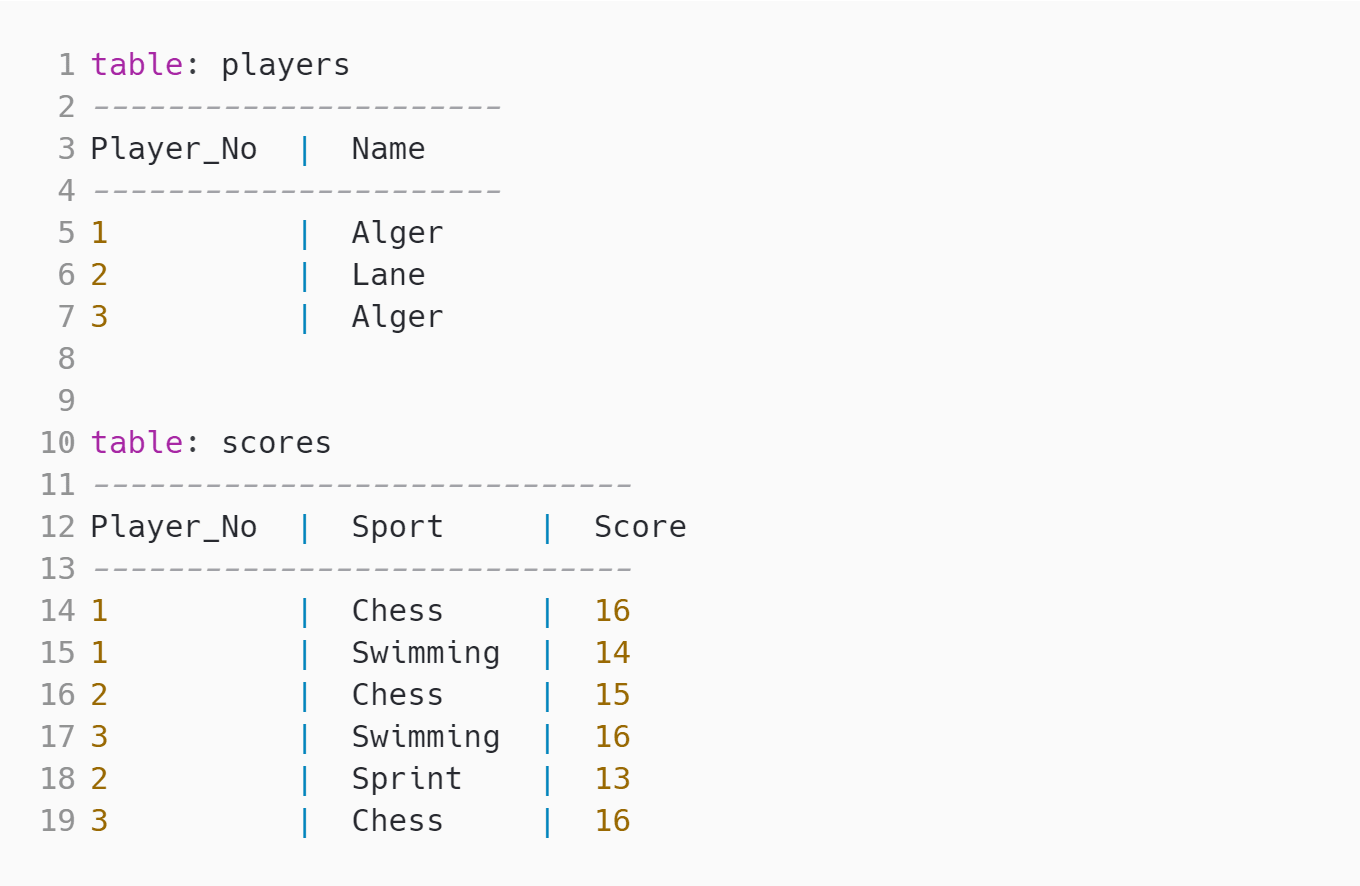
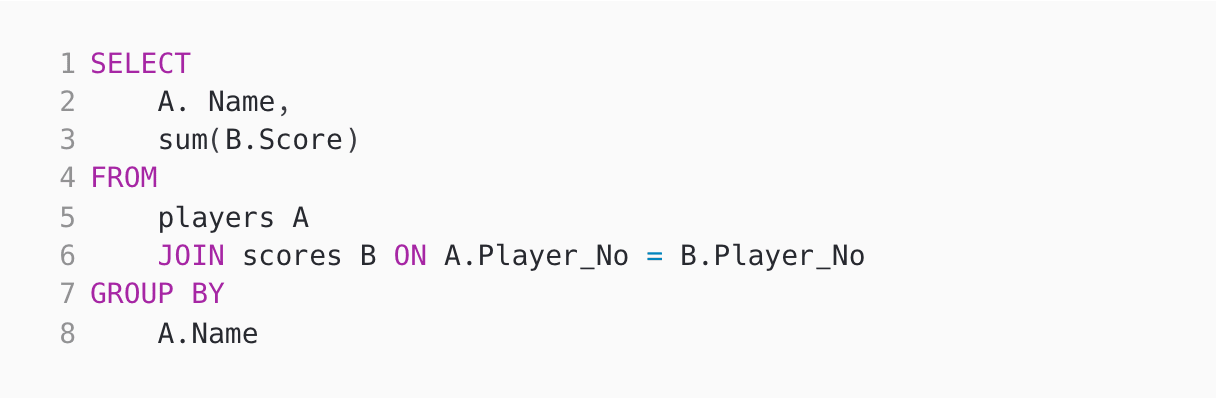
Hard With, AVG & SUM | Solve | ||||
Easy Registration Queue | Solve | ||||
Medium Visitors Count | Solve | ||||
| 🧐 Question | 🔧 Skill | ||
|---|---|---|---|
Medium Data Filtering | 2 mins Power BI | Solve | |
Medium Many-to-one error | 2 mins Power BI | Solve | |
Medium Power Query Functions | 2 mins Power BI | Solve | |
Medium Calculated Properties | 3 mins Tableau | Solve | |
Medium Change display icon | 2 mins Tableau | Solve | |
Easy Pie Chart | 3 mins Tableau | Solve | |
Medium Applying Functions | 3 mins R | Solve | |
Medium Dataframe Transform | 3 mins R | Solve | |
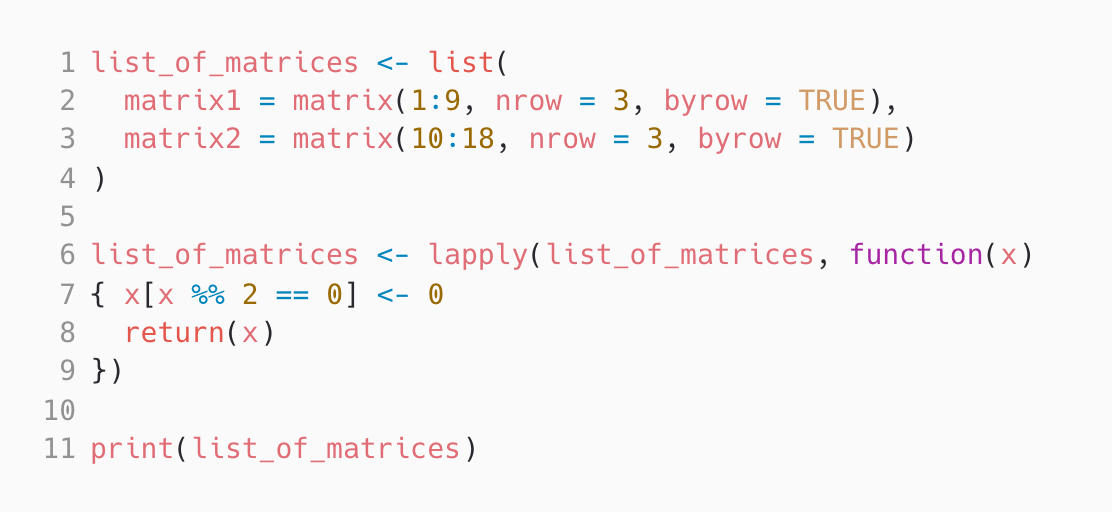
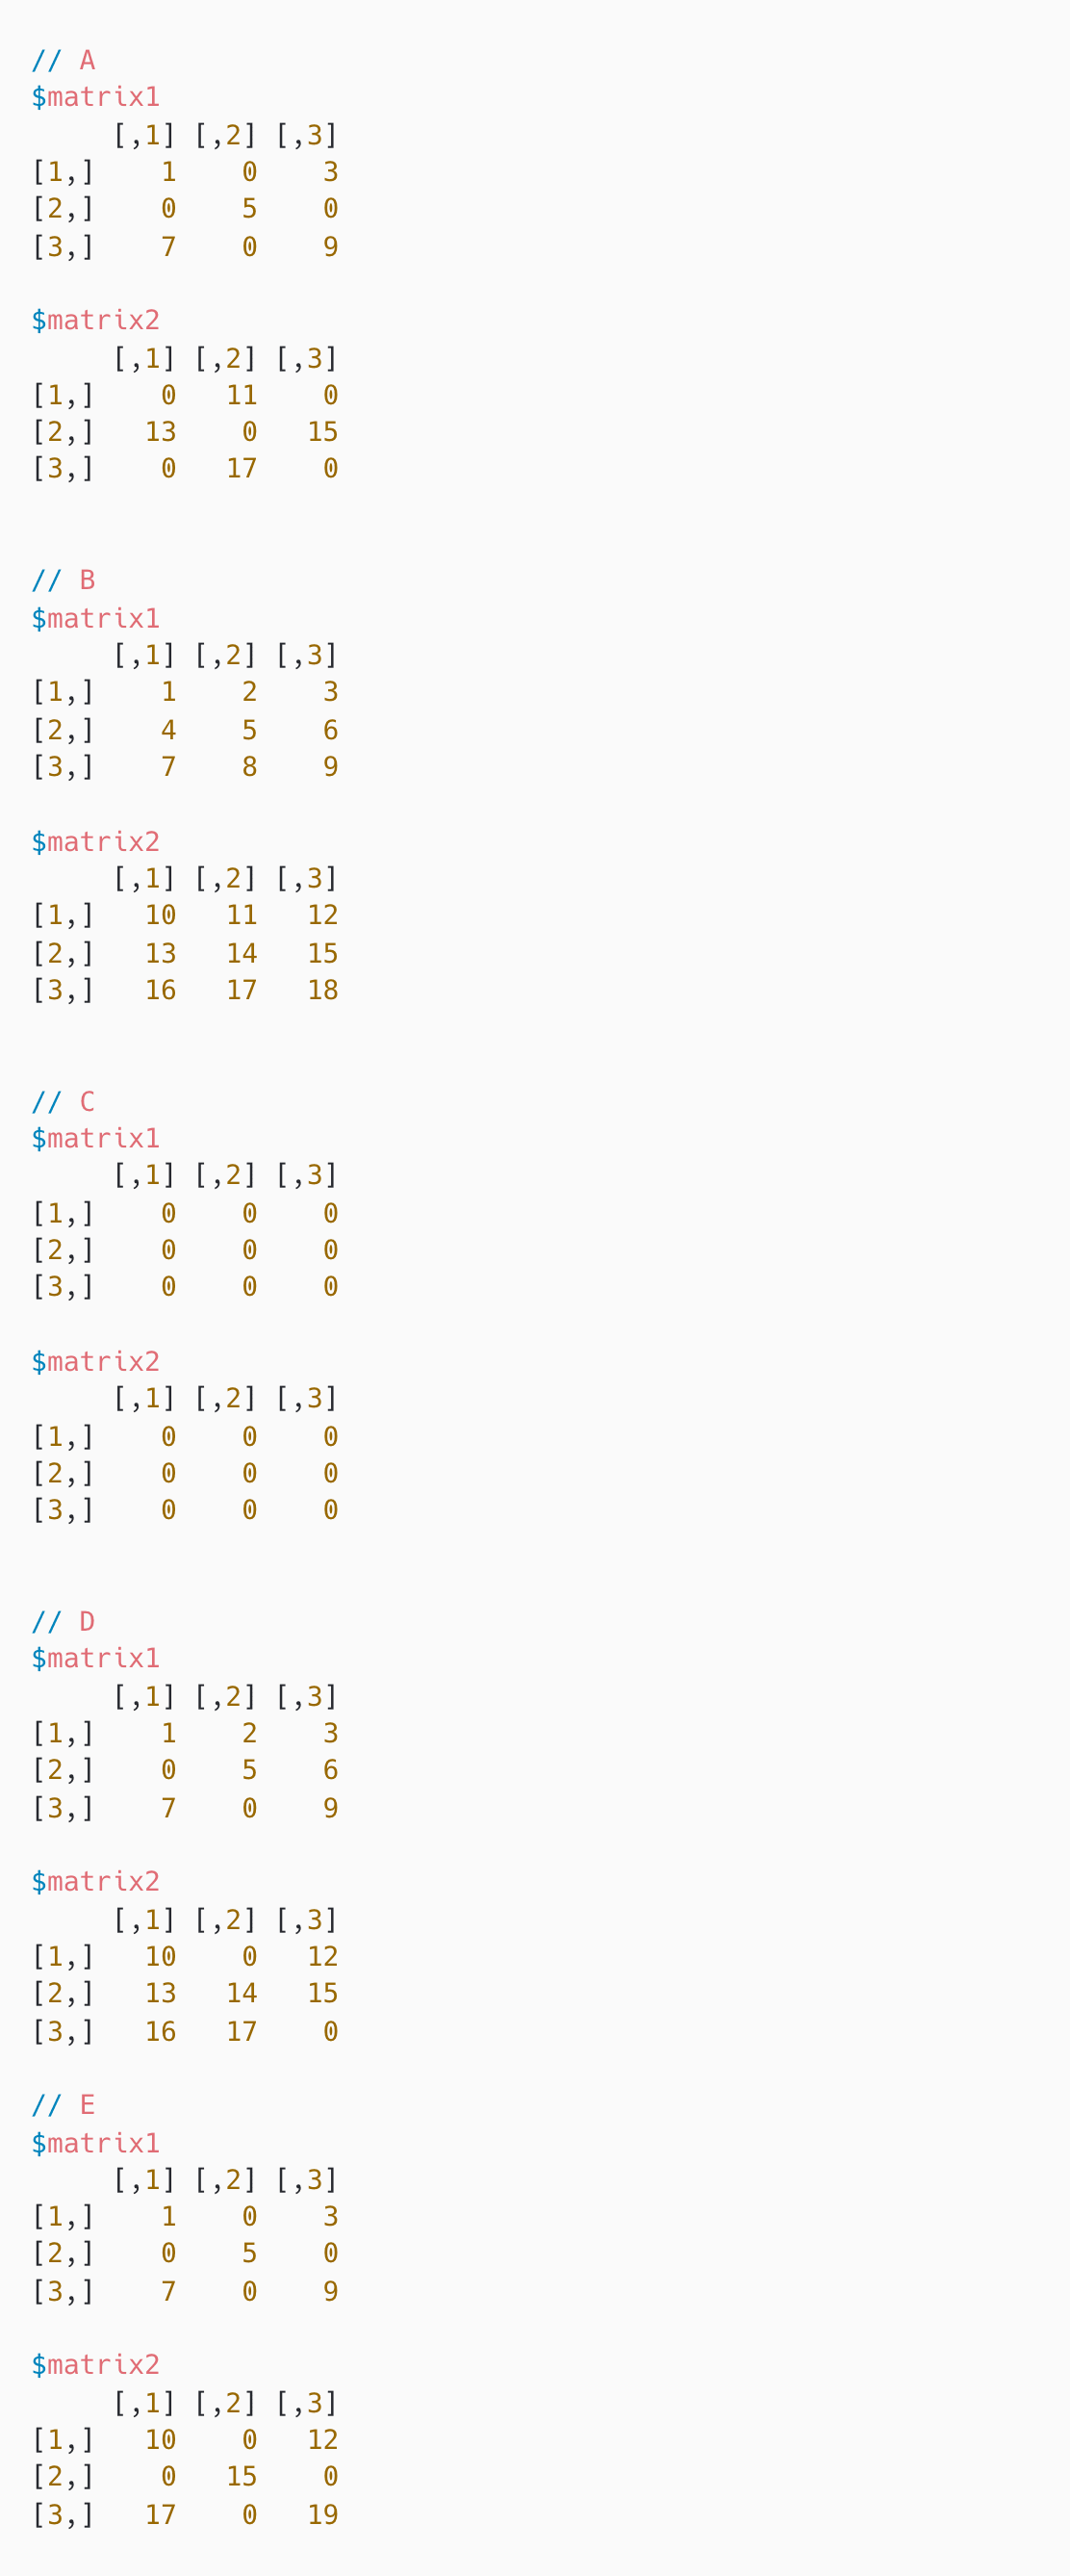
Medium Matrix Manipulation | 3 mins R | Solve | |
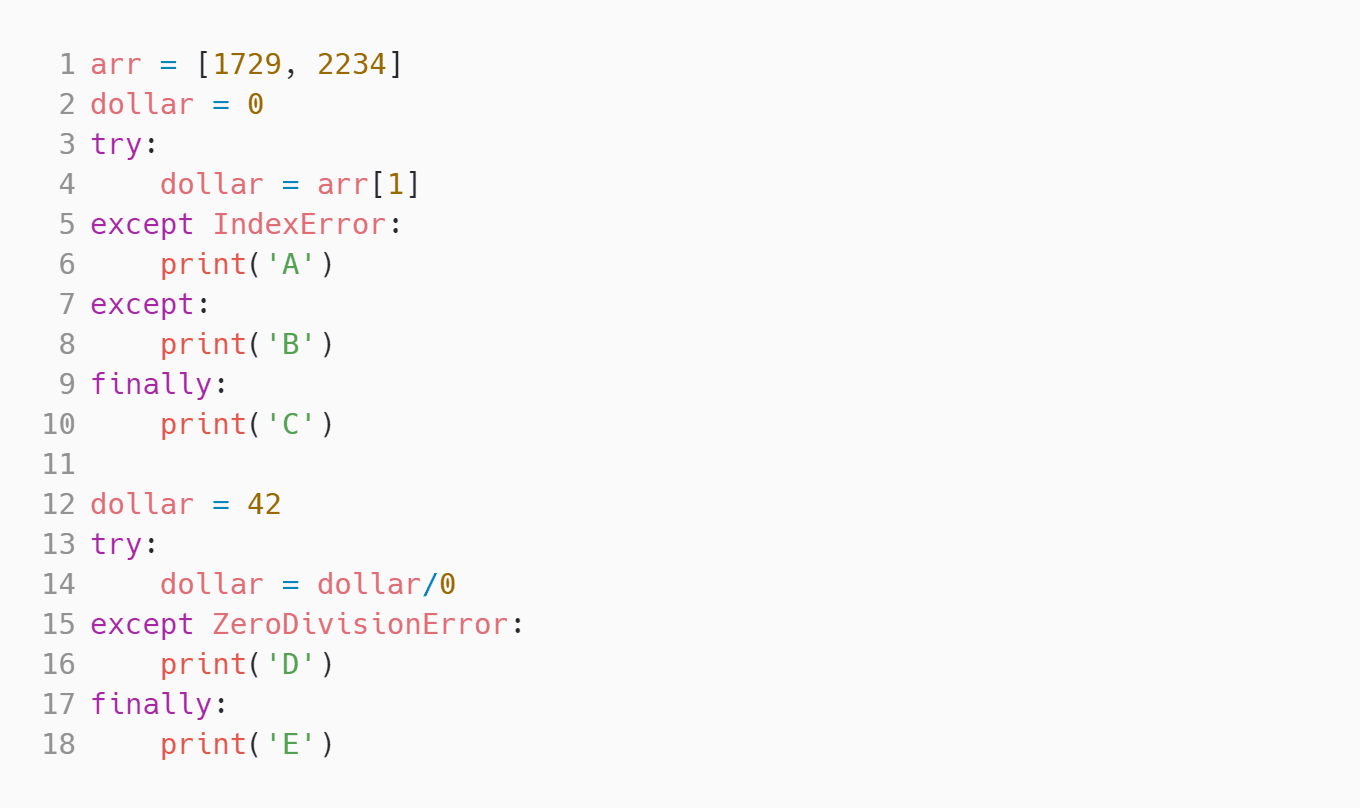
Medium ZeroDivisionError and IndexError | 2 mins Python | Solve | |
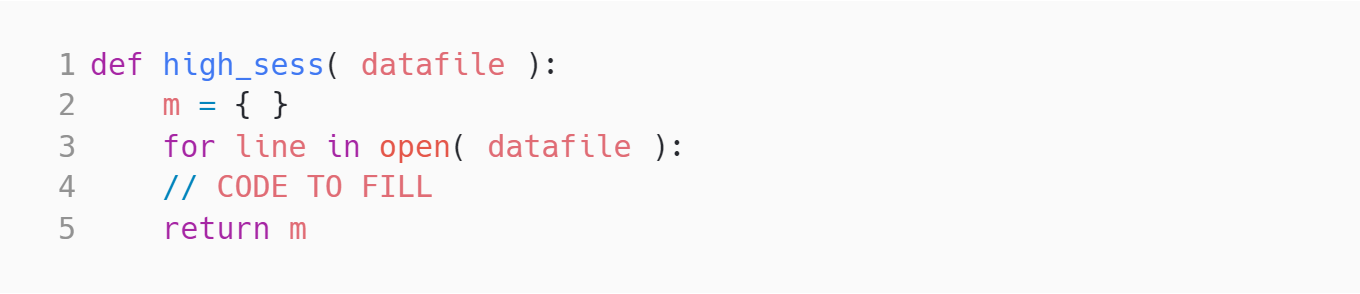
Medium Session | 2 mins Python | Solve | |
Medium Max Code | 2 mins Python | Solve | |
Medium Recursive Function | 3 mins Python | Solve | |
Medium Stacking problem | 4 mins Python | Solve | |
Medium Multi Select | 2 mins SQL | Solve | |
Medium nth highest sales | 3 mins SQL | Solve | |
Medium Select & IN | 3 mins SQL | Solve | |
Medium Sorting Ubers | 3 mins SQL | Solve | |
Hard With, AVG & SUM | 2 mins SQL | Solve | |
Easy Registration Queue | 30 mins Coding | Solve | |
Medium Visitors Count | 30 mins Coding | Solve |
| 🧐 Question | 🔧 Skill | 💪 Difficulty | ⌛ Time | ||
|---|---|---|---|---|---|
Data Filtering | Power BI | Medium | 2 mins | Solve | |
Many-to-one error | Power BI | Medium | 2 mins | Solve | |
Power Query Functions | Power BI | Medium | 2 mins | Solve | |
Calculated Properties | Tableau | Medium | 3 mins | Solve | |
Change display icon | Tableau | Medium | 2 mins | Solve | |
Pie Chart | Tableau | Easy | 3 mins | Solve | |
Applying Functions | R | Medium | 3 mins | Solve | |
Dataframe Transform | R | Medium | 3 mins | Solve | |
Matrix Manipulation | R | Medium | 3 mins | Solve | |
ZeroDivisionError and IndexError | Python | Medium | 2 mins | Solve | |
Session | Python | Medium | 2 mins | Solve | |
Max Code | Python | Medium | 2 mins | Solve | |
Recursive Function | Python | Medium | 3 mins | Solve | |
Stacking problem | Python | Medium | 4 mins | Solve | |
Multi Select | SQL | Medium | 2 mins | Solve | |
nth highest sales | SQL | Medium | 3 mins | Solve | |
Select & IN | SQL | Medium | 3 mins | Solve | |
Sorting Ubers | SQL | Medium | 3 mins | Solve | |
With, AVG & SUM | SQL | Hard | 2 mins | Solve | |
Registration Queue | Coding | Easy | 30 mins | Solve | |
Visitors Count | Coding | Medium | 30 mins | Solve |
С помощью Adaface мы смогли оптимизировать первоначальный процесс отбора более чем на 75 %, высвободив драгоценное время как для менеджеров по найму, так и для нашей команды по привлечению талантов!
Brandon Lee, Глава отдела кадров, Love, Bonito
The most important thing while implementing the pre-employment BI Developer Test in your hiring process is that it is an elimination tool, not a selection tool. In other words: you want to use the test to eliminate the candidates who do poorly on the test, not to select the candidates who come out at the top. While they are super valuable, pre-employment tests do not paint the entire picture of a candidate’s abilities, knowledge, and motivations. Multiple easy questions are more predictive of a candidate's ability than fewer hard questions. Harder questions are often "trick" based questions, which do not provide any meaningful signal about the candidate's skillset.
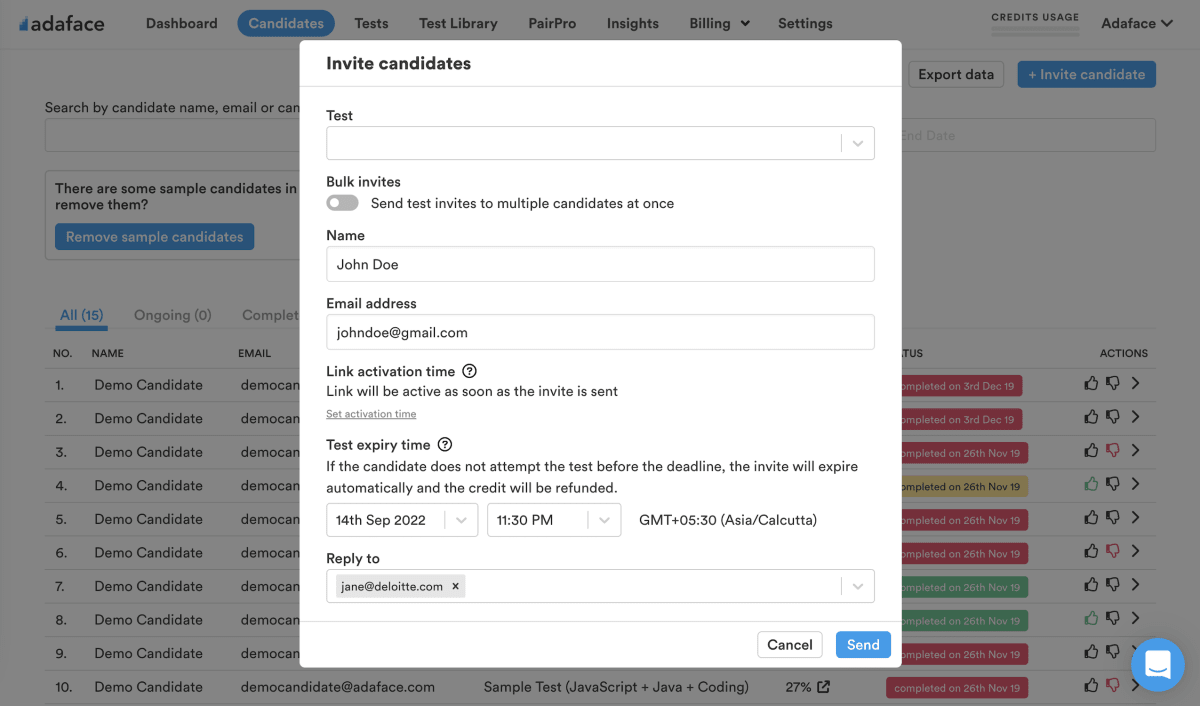
Science behind Adaface testsEmail invites: You can send candidates an email invite to the BI Developer Test from your dashboard by entering their email address.
Public link: You can create a public link for each test that you can share with candidates.
API or integrations: You can invite candidates directly from your ATS by using our pre-built integrations with popular ATS systems or building a custom integration with your in-house ATS.
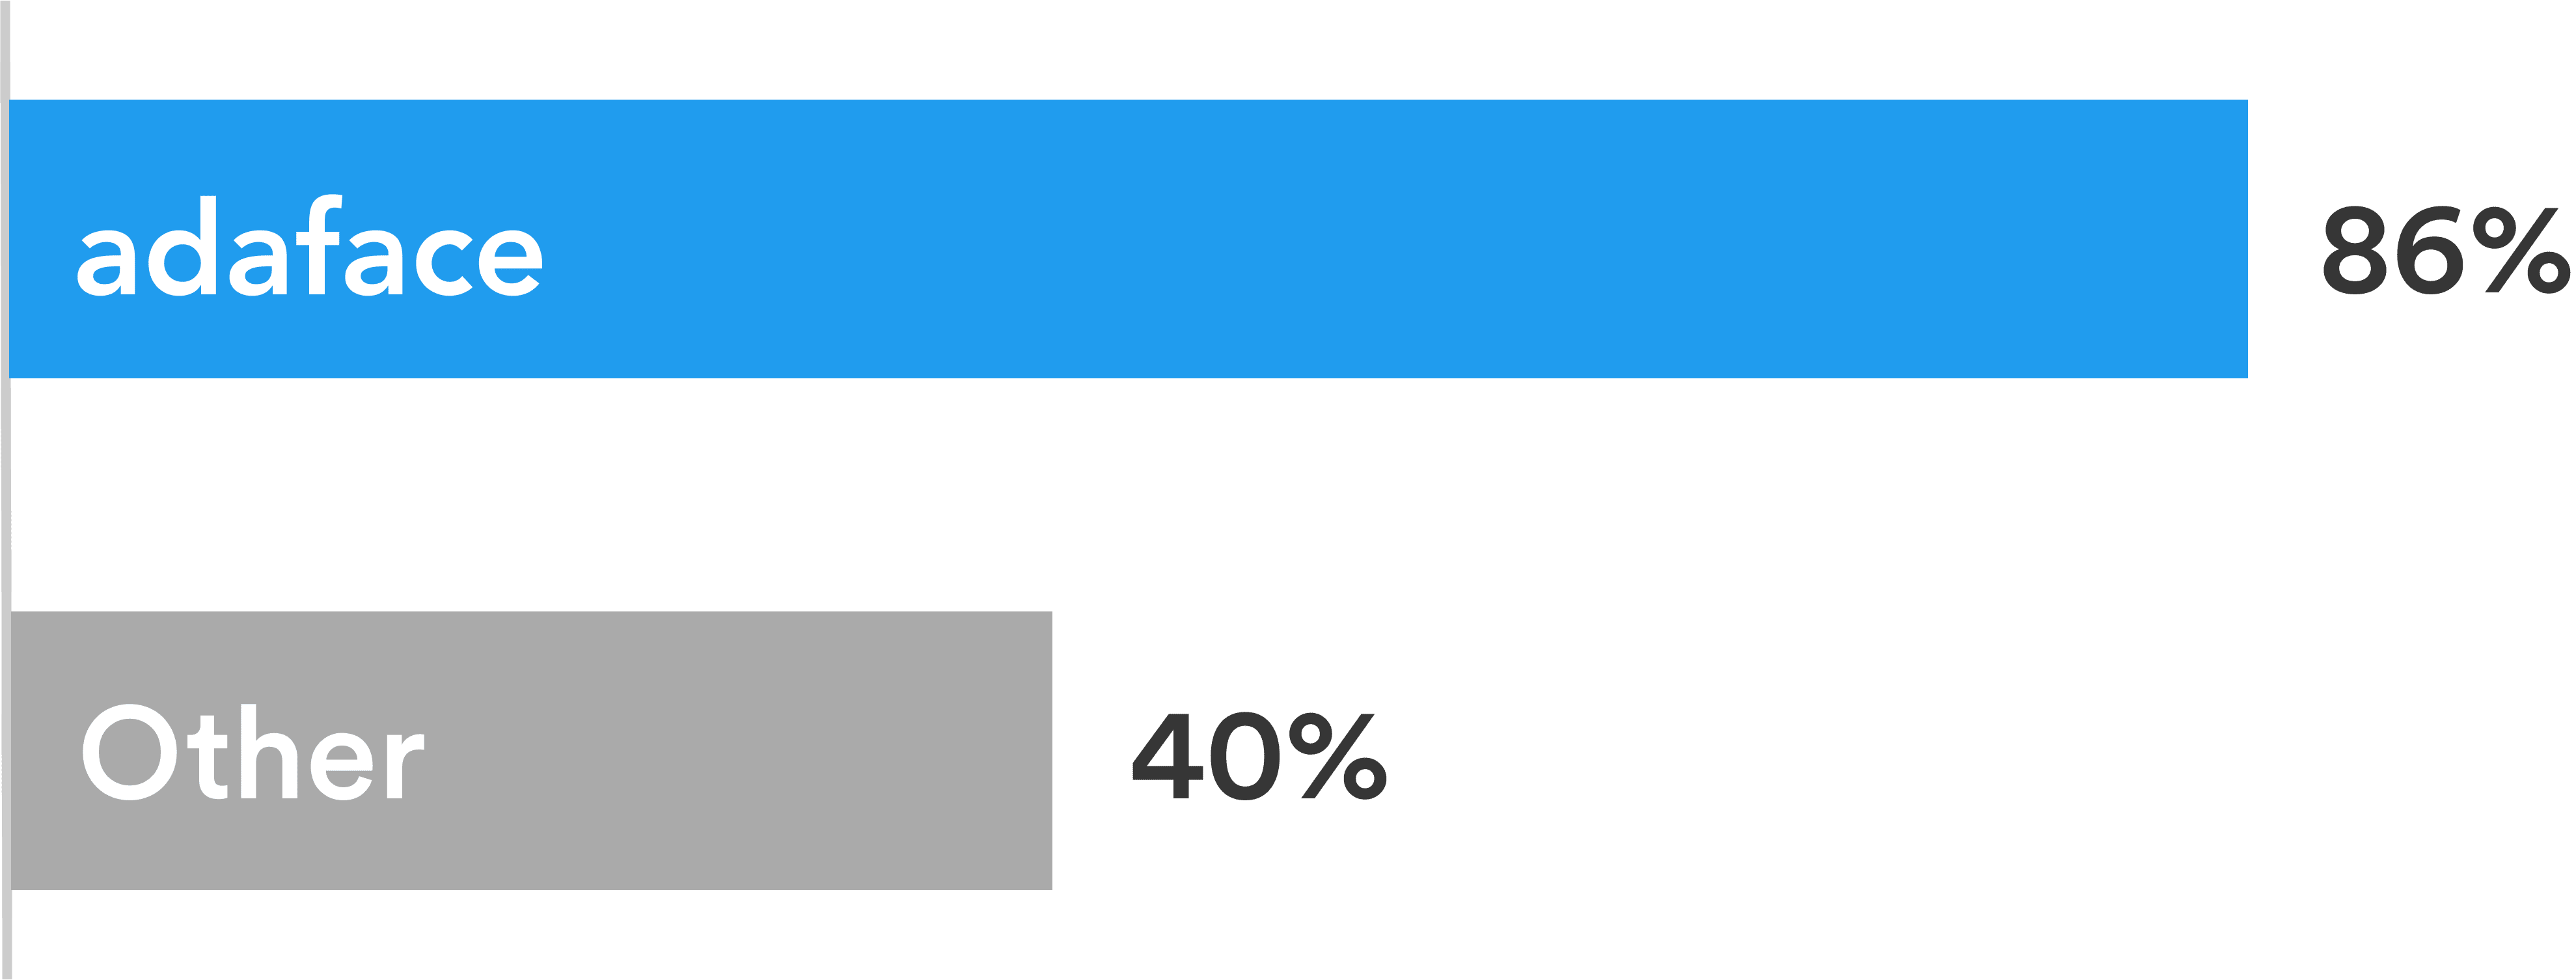
Adaface tests are conversational, low-stress, and take just 25-40 mins to complete.
This is why Adaface has the highest test-completion rate (86%), which is more than 2x better than traditional assessments.
ChatGPT protection
Screen proctoring
Plagiarism detection
Non-googleable questions
User authentication
IP proctoring
Web proctoring
Webcam proctoring
Full screen proctoring
Copy paste protection
Менеджеры по найму чувствовали, что с помощью технических вопросов, которые они задавали во время групповых собеседований, они могли определить, какие кандидаты имеют более высокие баллы, и отличиться от тех, кто не набрал таких же баллов. Они есть очень доволен с качеством кандидатов, включенных в шорт-лист отбора Adaface.
Да, конечно. Пользовательские оценки настроены на основе вашей должности и будут включать вопросы по всем необходимым навыкам, которые вы указываете.
У нас есть следующие функции антихиализации:
Узнайте больше о функциях Proctoring.
Основная вещь, которую нужно помнить, это то, что оценка - это инструмент устранения, а не инструмент отбора. Оценка навыков оптимизирована, чтобы помочь вам устранить кандидатов, которые технически не имеют квалификации для этой роли, она не оптимизирована, чтобы помочь вам найти лучшего кандидата на роль. Таким образом, идеальный способ использования оценки - определить пороговый балл (обычно 55%, мы помогаем вам сравнить) и пригласить всех кандидатов, которые забивают выше порога для следующих раундов интервью.
Каждая оценка Adaface настроена на ваш инструкции/ Идеальный кандидат (наши эксперты по предметам выберут правильные вопросы для вашей оценки из нашей библиотеки из 10000+ вопросов). Эта оценка может быть настроена для любого уровня опыта.
Да, вам намного проще сравнить кандидатов. Варианты для вопросов MCQ и порядок вопросов рандомизированы. У нас есть против Chating/Proctoring. В нашем плане предприятия у нас также есть возможность создать несколько версий одной и той же оценки с вопросами аналогичных уровней сложности.
Нет. К сожалению, в данный момент мы не поддерживаем практические тесты. Тем не менее, вы можете использовать наши примерные вопросы для практики.
Вы можете проверить наши планы ценообразования.
Да, вы можете зарегистрироваться бесплатно и предварительно просмотрите этот тест.
Вот краткое руководство по Как запросить пользовательскую оценку на Adaface.
🌎 Выберите свой язык