Test Duration
70 min
Difficulty Level
Moderate
Questions
- 5 Power bi MCQs
- 5 Żywy obraz MCQs
- 4 R MCQs
- 5 Pyton MCQs
- 5 SQL MCQs
- 1 Pyton Coding Question
Availability
Ready to use
About the test:
Test programisty Business Intelligence wykorzystuje oparte na scenariuszach pytania wielokrotnego wyboru, aby ocenić wiedzę i umiejętności kandydata związane z modelowaniem danych i procesami ETL, hurtowaniem danych i eksplorowaniem danych, raportowaniem i wizualizacją BI, analizy danych i modelowania predykcyjnego oraz zarządzania projektami BI. Kandydaci są również oceniani na podstawie ich zdolności do korzystania z narzędzi i technologii BI, takich jak SQL Server, Power BI, Tableau i inne powiązane narzędzia oraz ich biegłość w stosowaniu technik analizy danych i inteligencji biznesowej w celu rozwiązania złożonych problemów biznesowych.
Covered skills:
Test Duration
70 min
Difficulty Level
Moderate
Questions
Availability
Ready to use
The Test dla programisty BI helps recruiters and hiring managers identify qualified candidates from a pool of resumes, and helps in taking objective hiring decisions. It reduces the administrative overhead of interviewing too many candidates and saves time by filtering out unqualified candidates at the first step of the hiring process.
The test screens for the following skills that hiring managers look for in candidates:
Traditional assessment tools use trick questions and puzzles for the screening, which creates a lot of frustration among candidates about having to go through irrelevant screening assessments.
The main reason we started Adaface is that traditional pre-employment assessment platforms are not a fair way for companies to evaluate candidates. At Adaface, our mission is to help companies find great candidates by assessing on-the-job skills required for a role.
Why we started AdafaceWe have a very high focus on the quality of questions that test for on-the-job skills. Every question is non-googleable and we have a very high bar for the level of subject matter experts we onboard to create these questions. We have crawlers to check if any of the questions are leaked online. If/ when a question gets leaked, we get an alert. We change the question for you & let you know.
How we design questionsTo tylko niewielka próbka z naszej biblioteki ponad 10 000 pytań. Rzeczywiste pytania dotyczące tego Test dla programisty BI będzie nieobowiązany.
| 🧐 Question | |||||
|---|---|---|---|---|---|
Medium Data Filtering | Solve | ||||
Medium Many-to-one error | Solve | ||||
Medium Power Query Functions | Solve | ||||
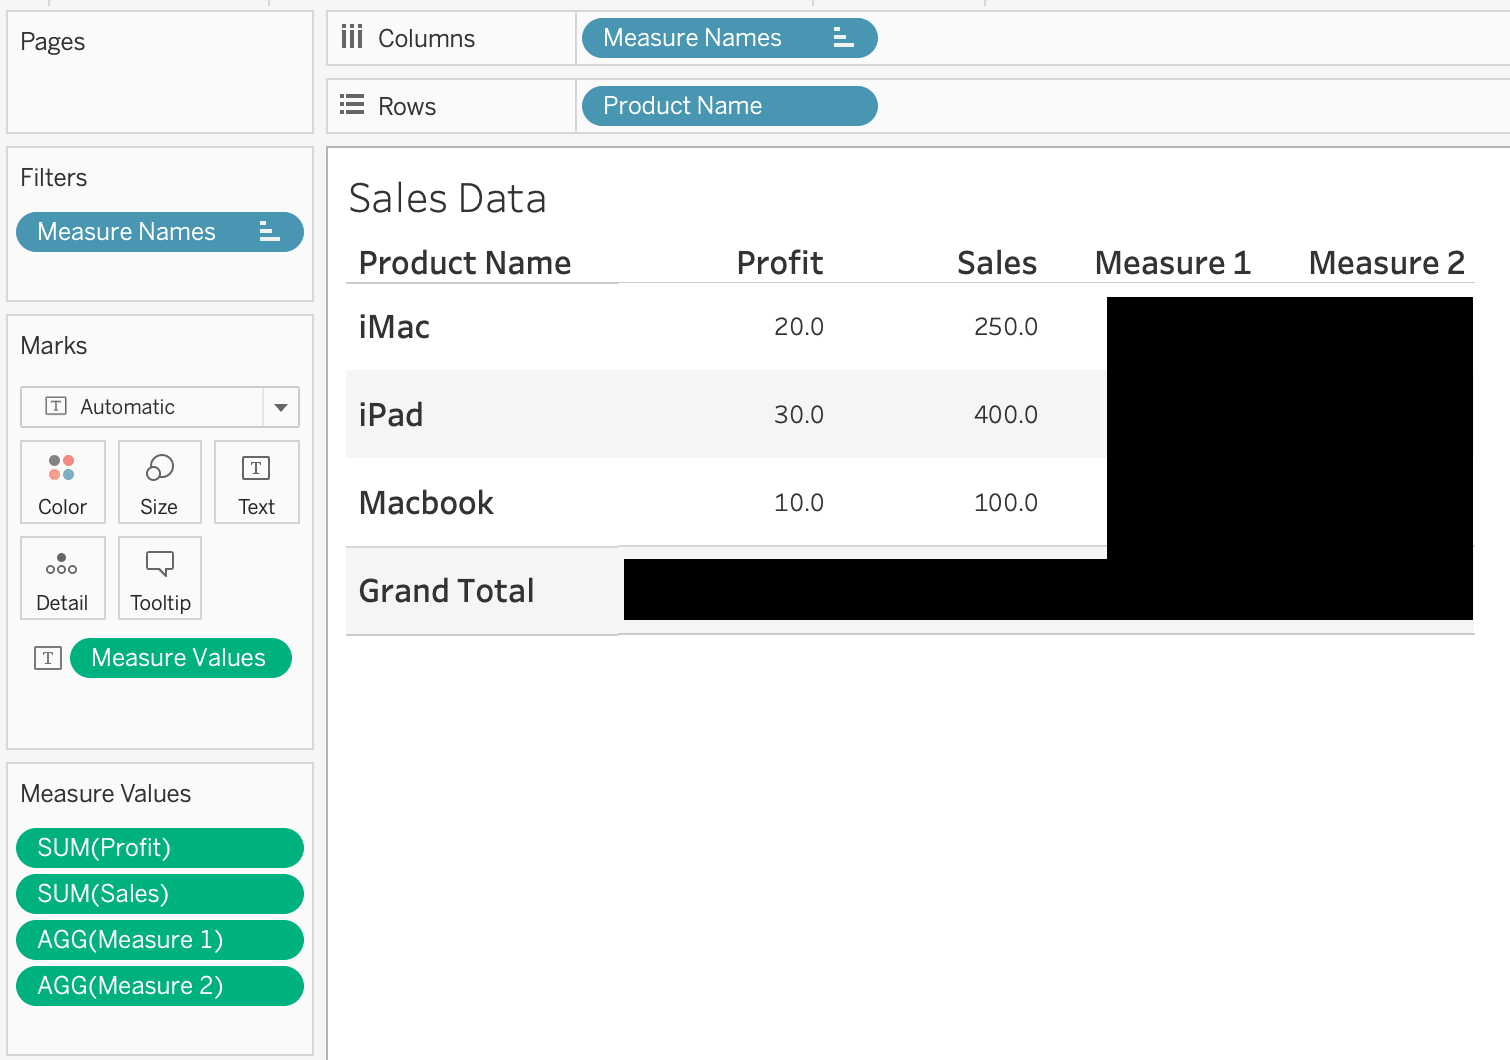
Medium Calculated Properties | Solve | ||||
Medium Change display icon | Solve | ||||
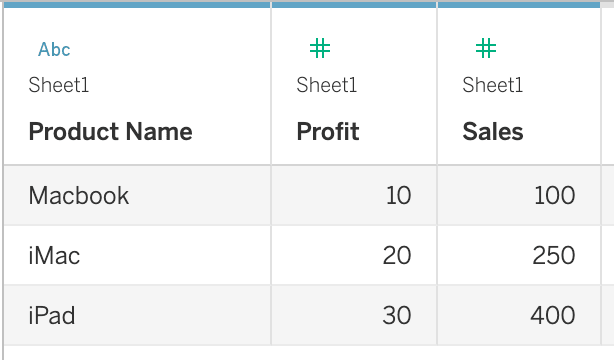
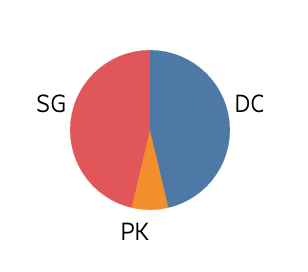
Easy Pie Chart | Solve | ||||
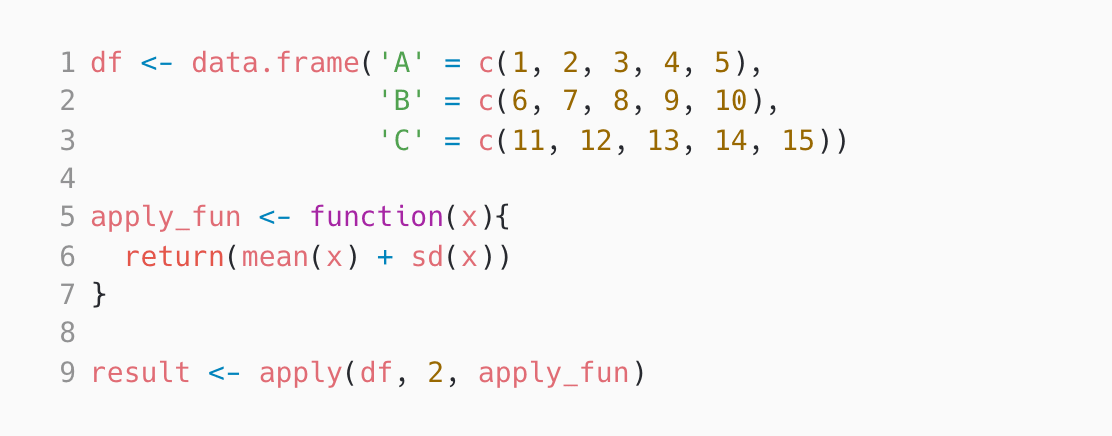
Medium Applying Functions | Solve | ||||
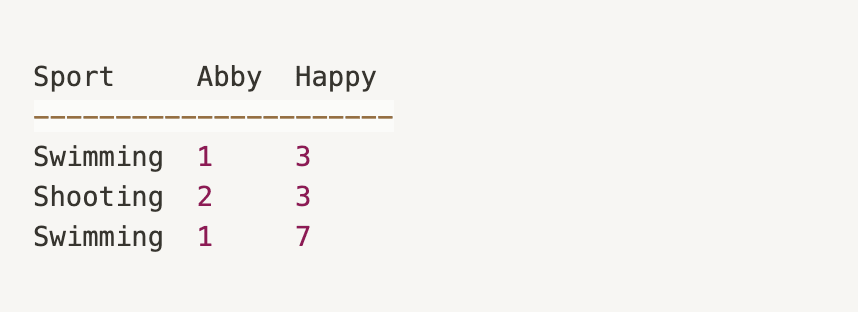
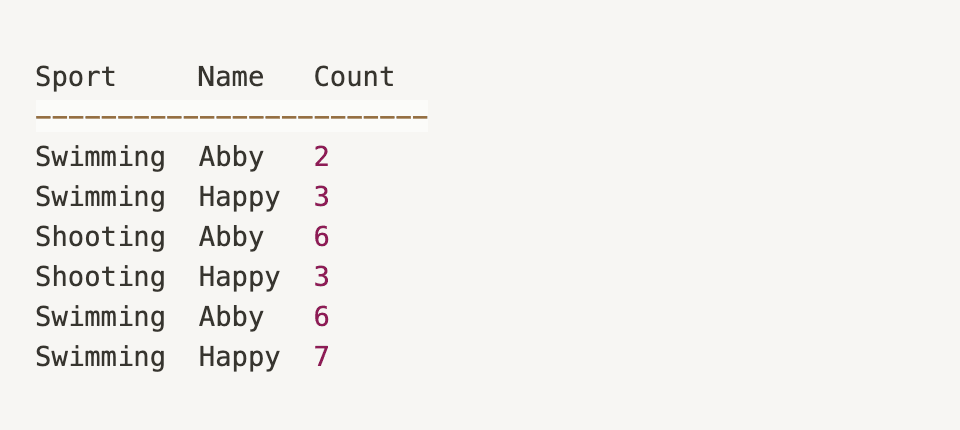
Medium Dataframe Transform | Solve | ||||
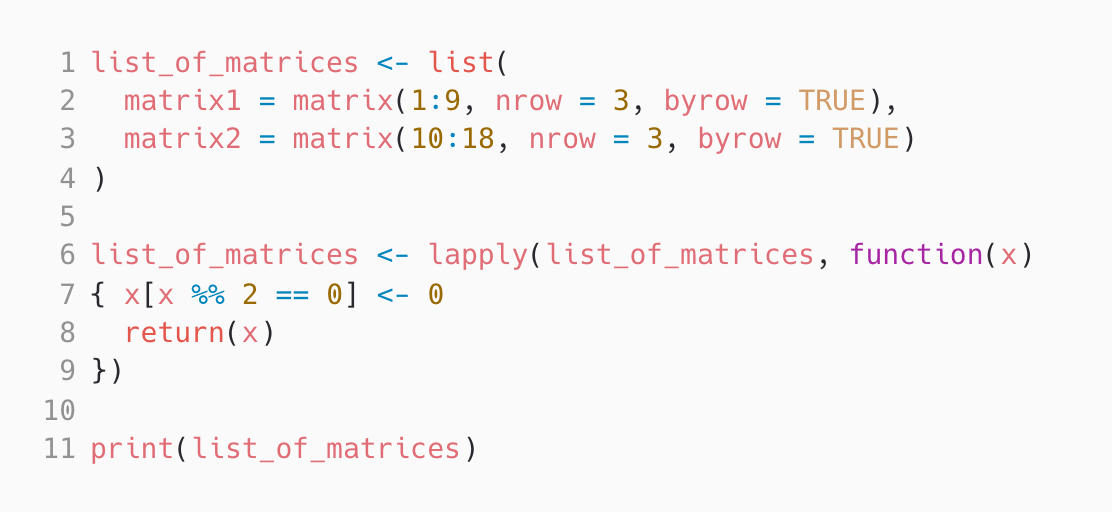
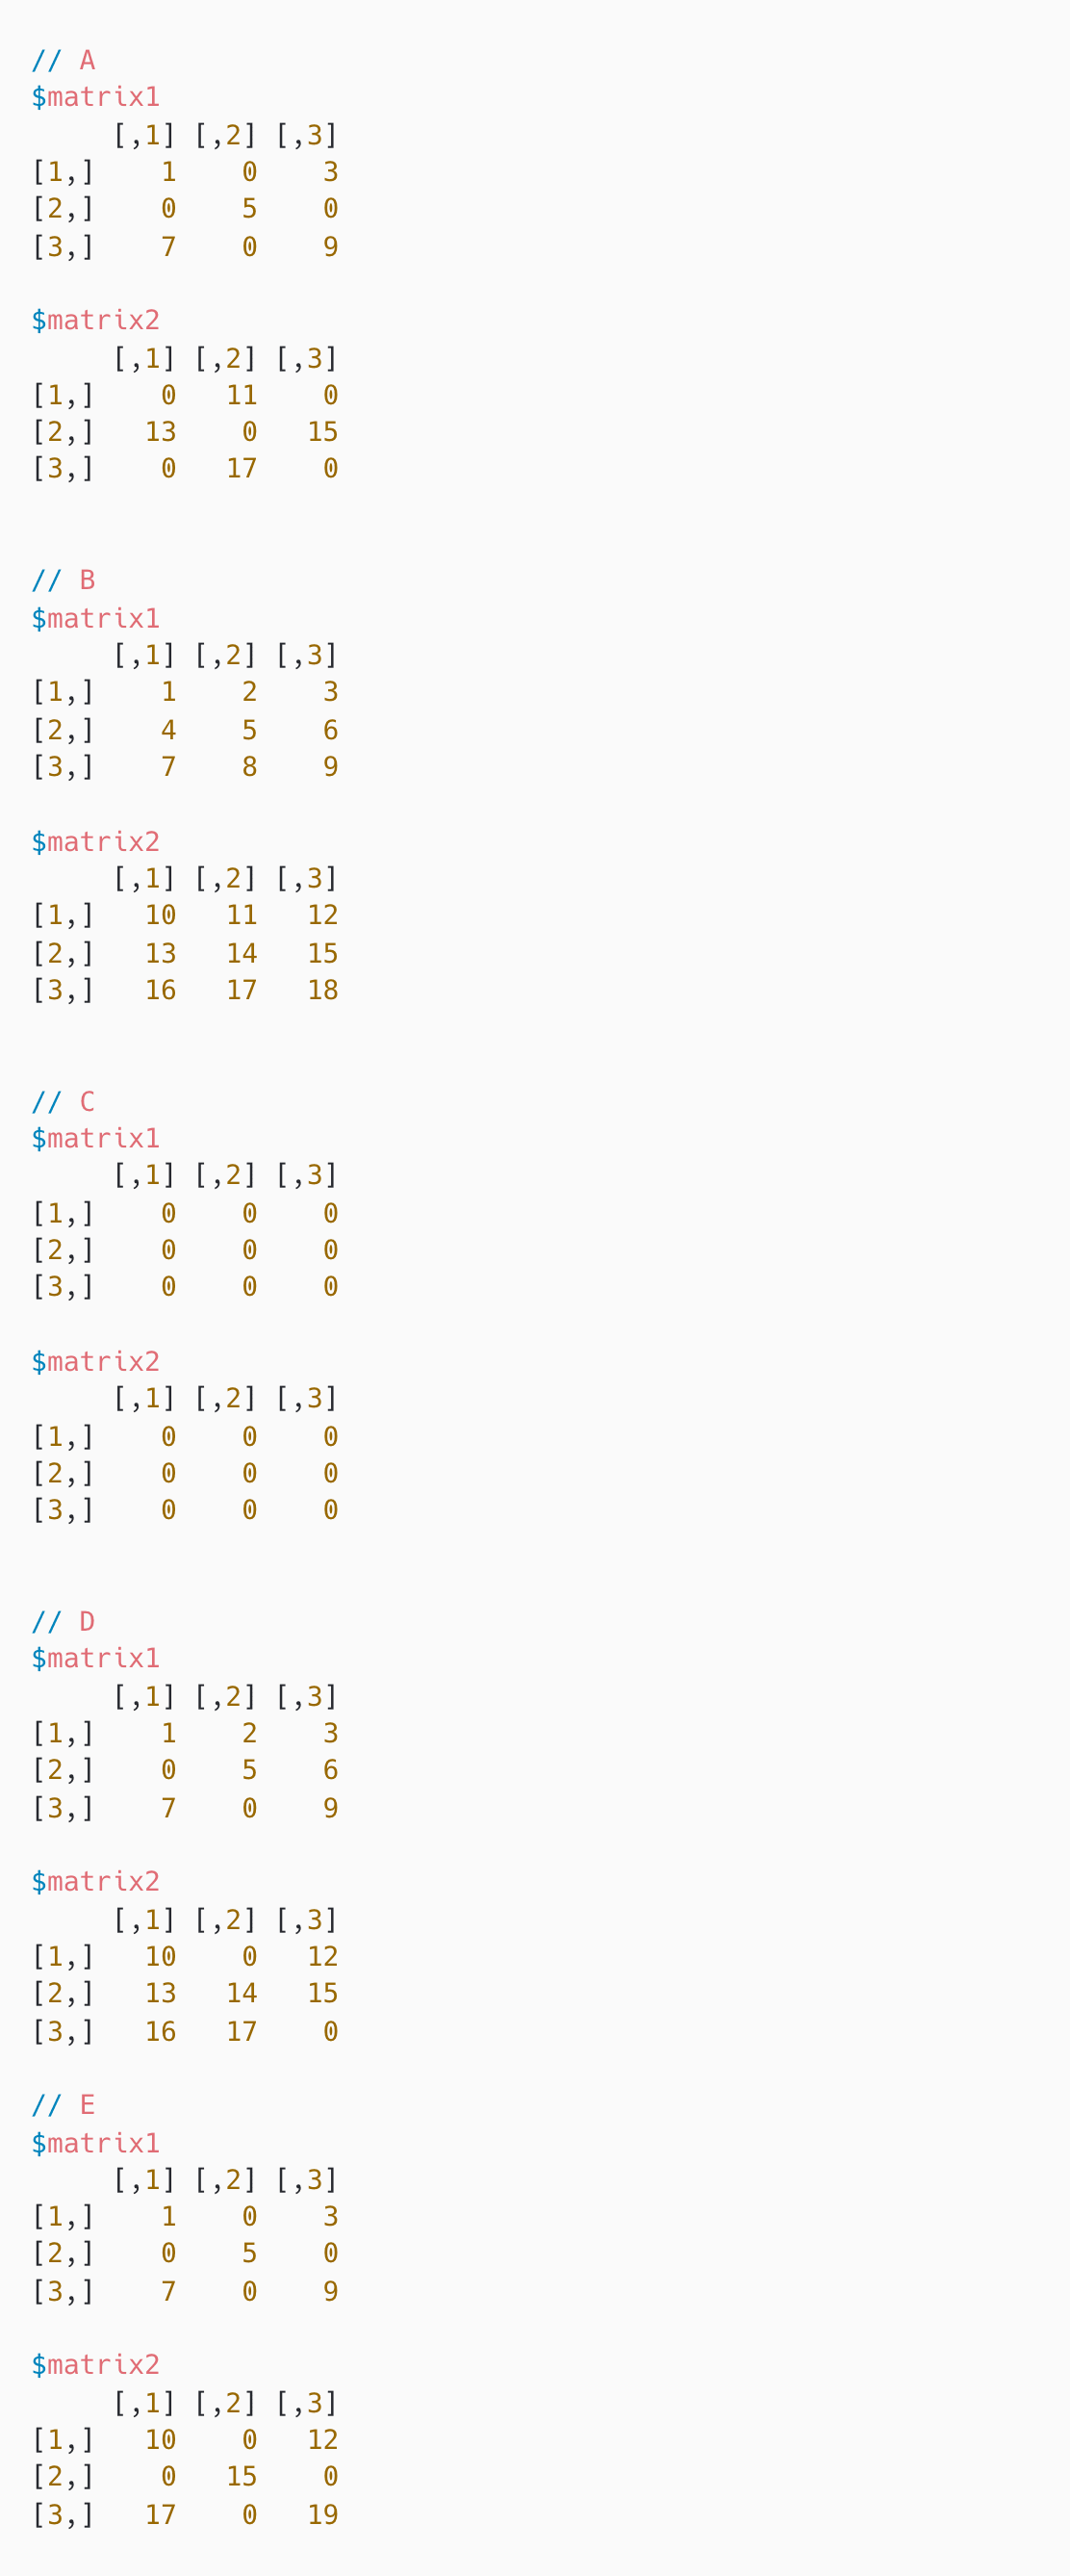
Medium Matrix Manipulation | Solve | ||||
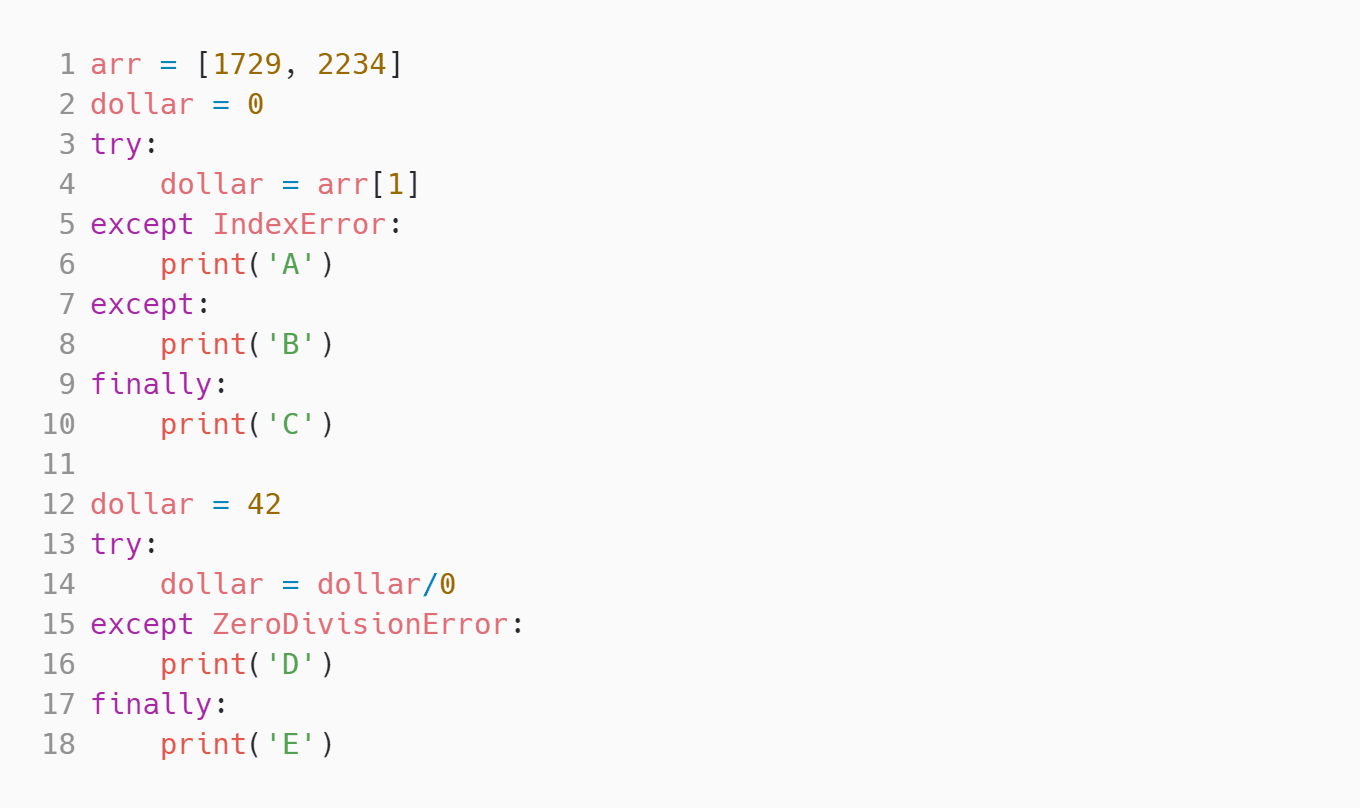
Medium ZeroDivisionError and IndexError | Solve | ||||
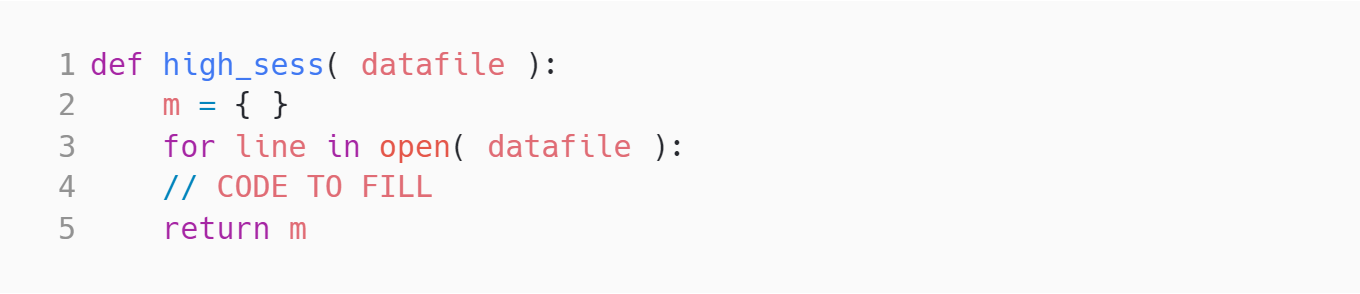
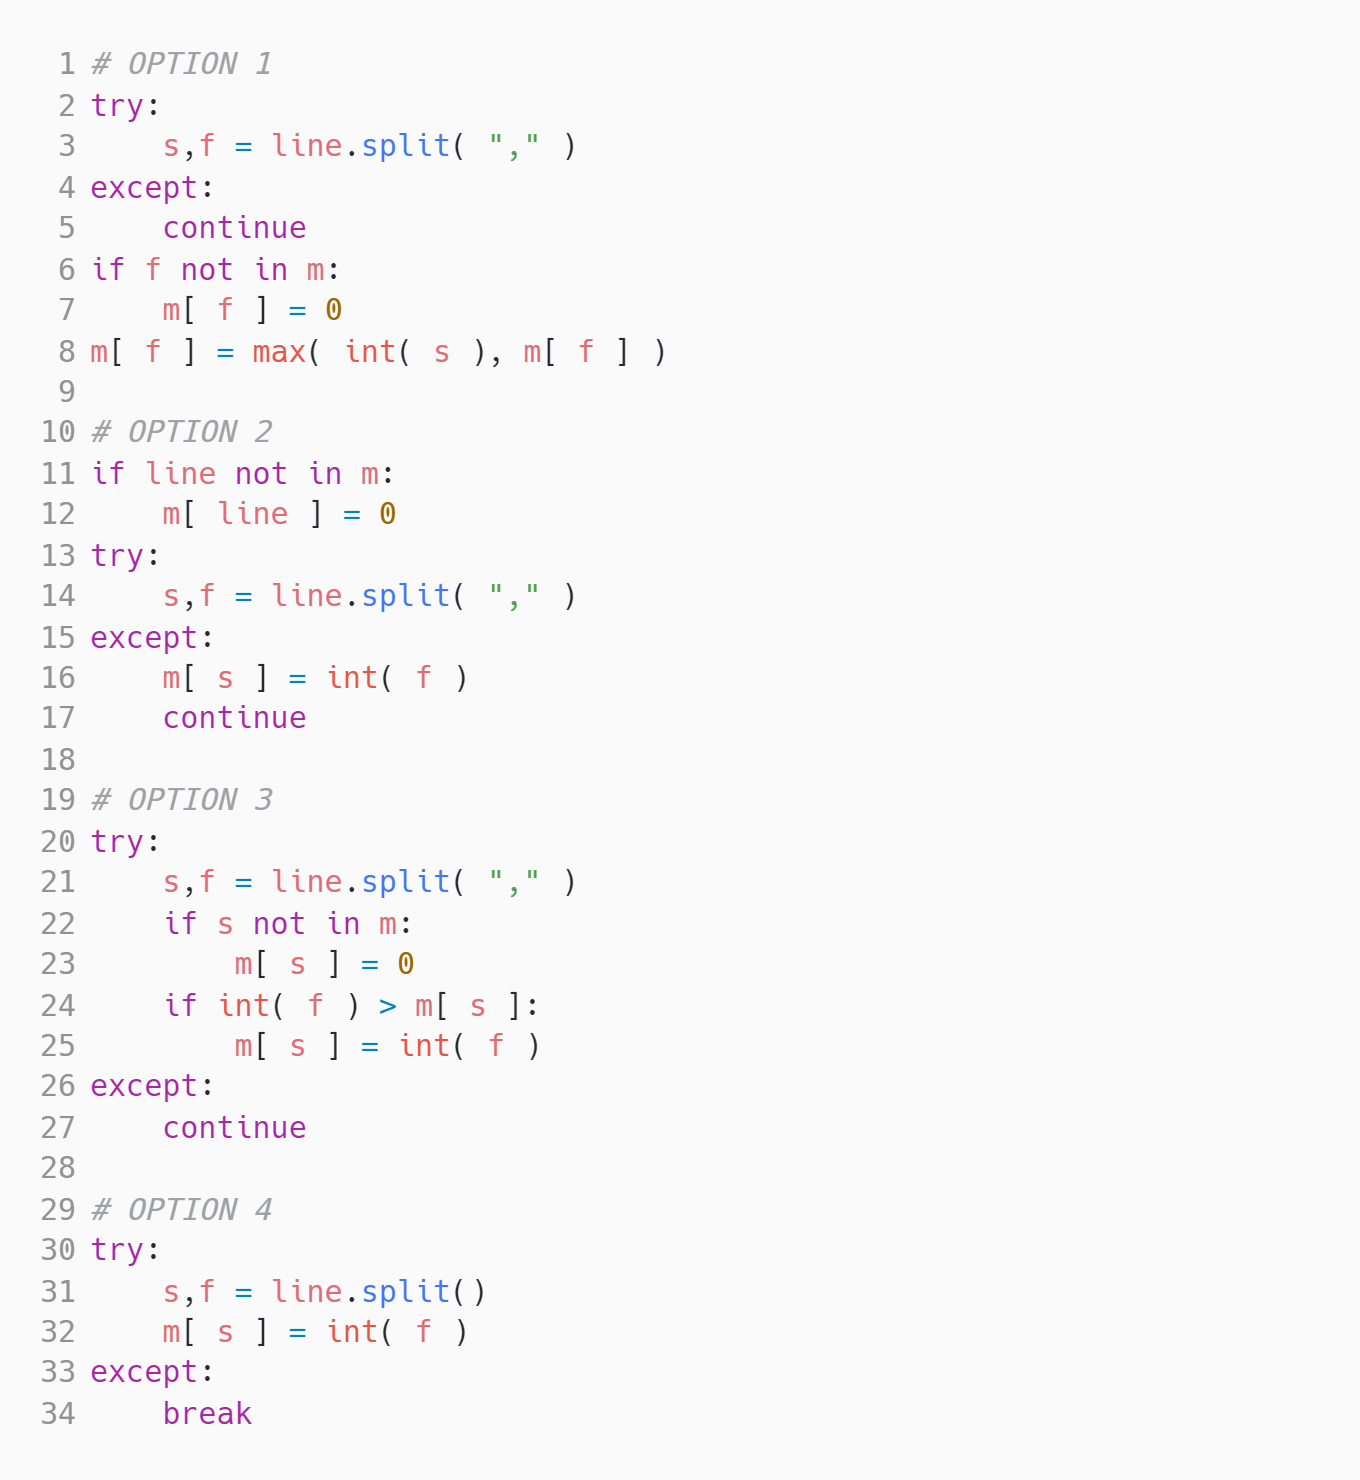
Medium Session | Solve | ||||
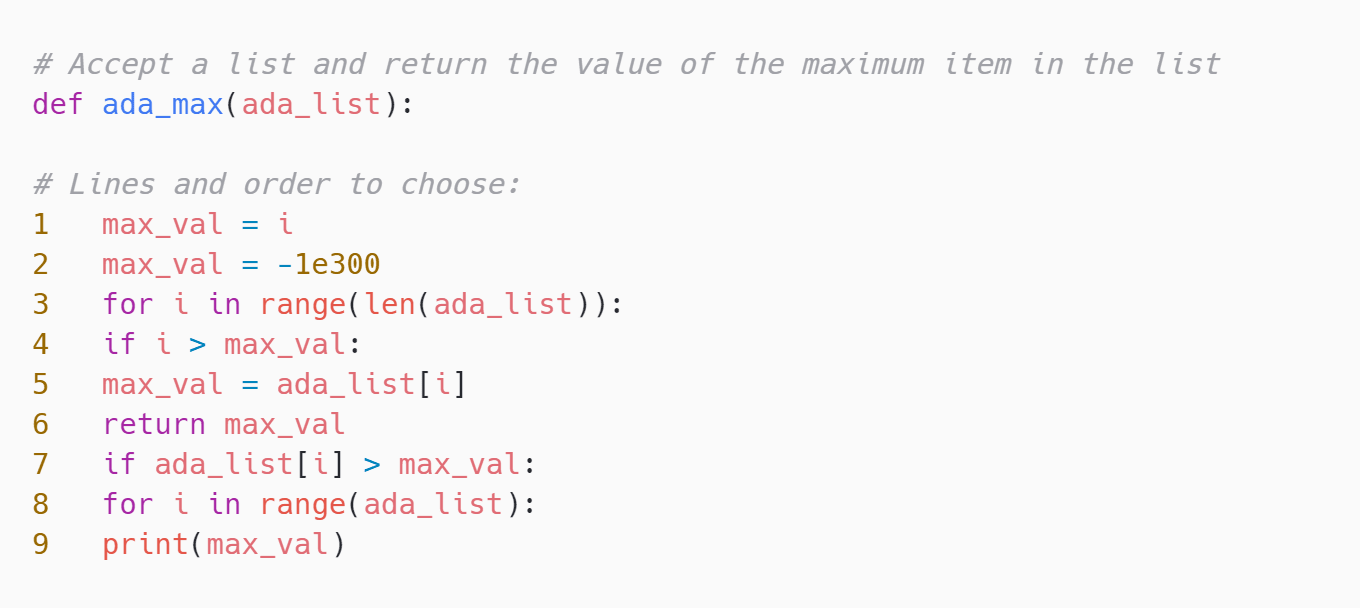
Medium Max Code | Solve | ||||
Medium Recursive Function | Solve | ||||
Medium Stacking problem | Solve | ||||
Medium Multi Select | Solve | ||||
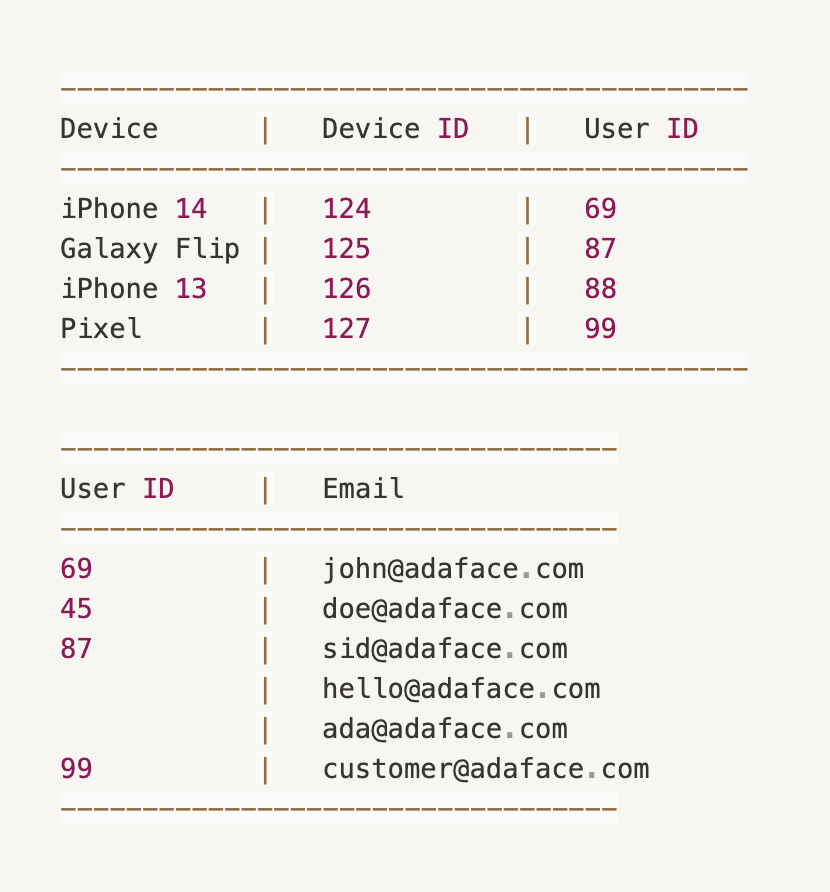
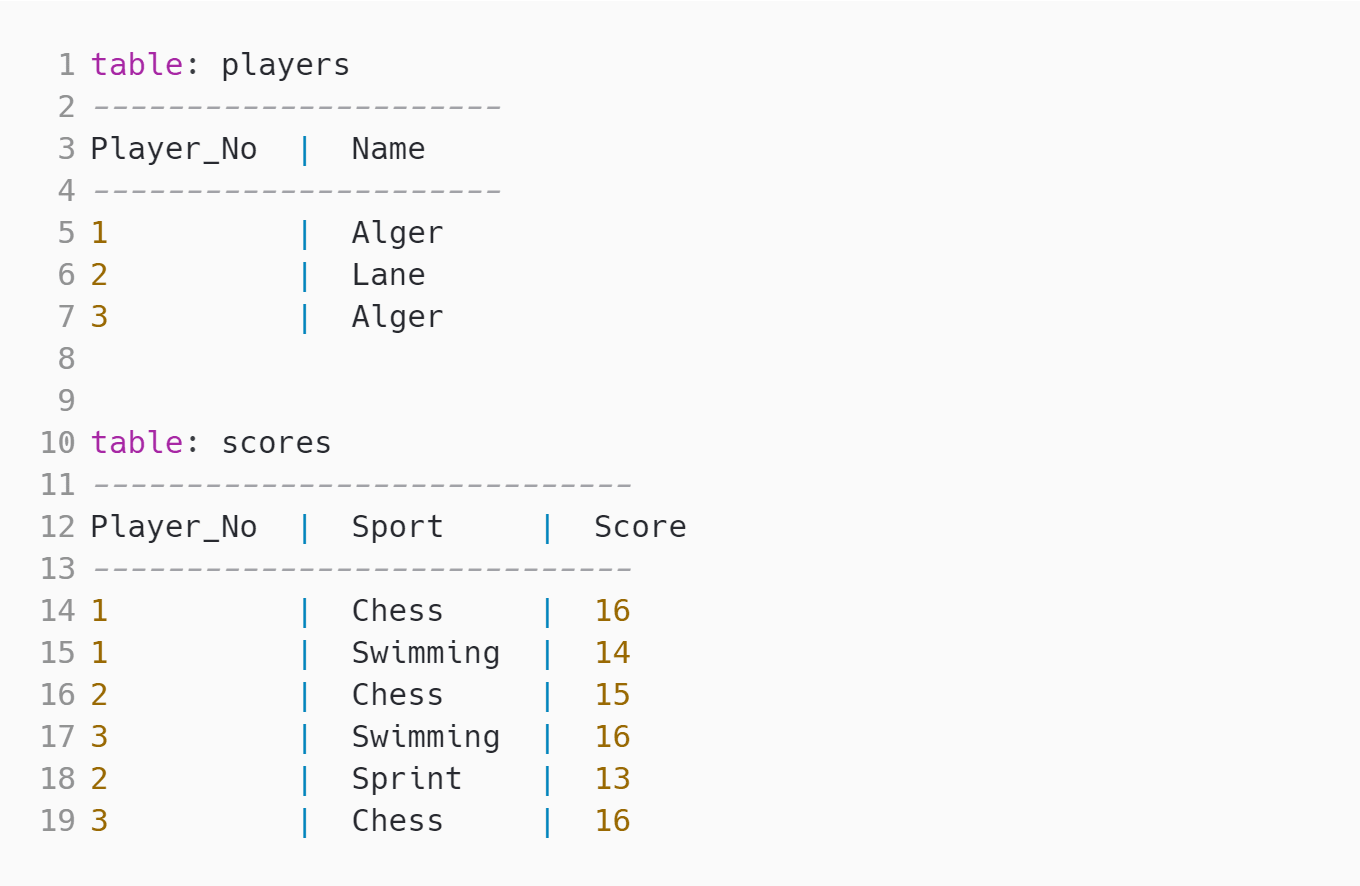
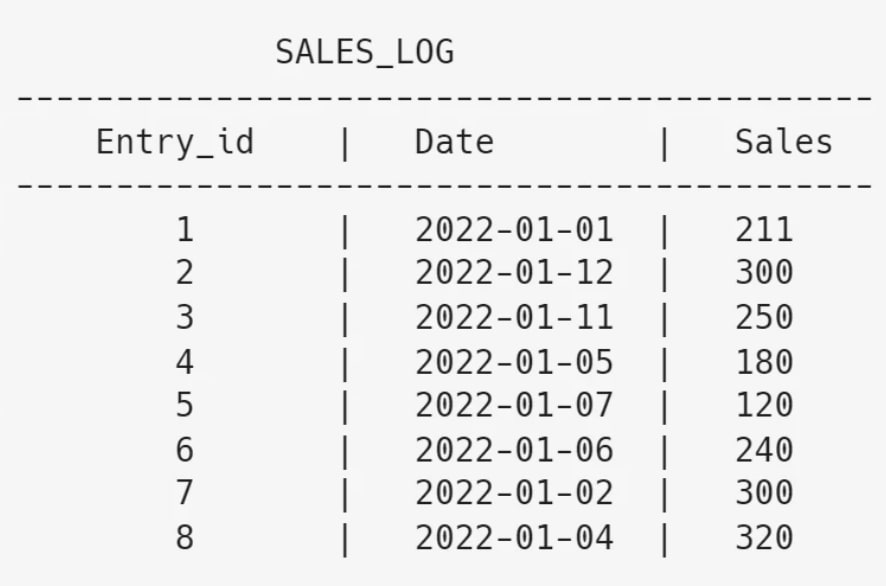
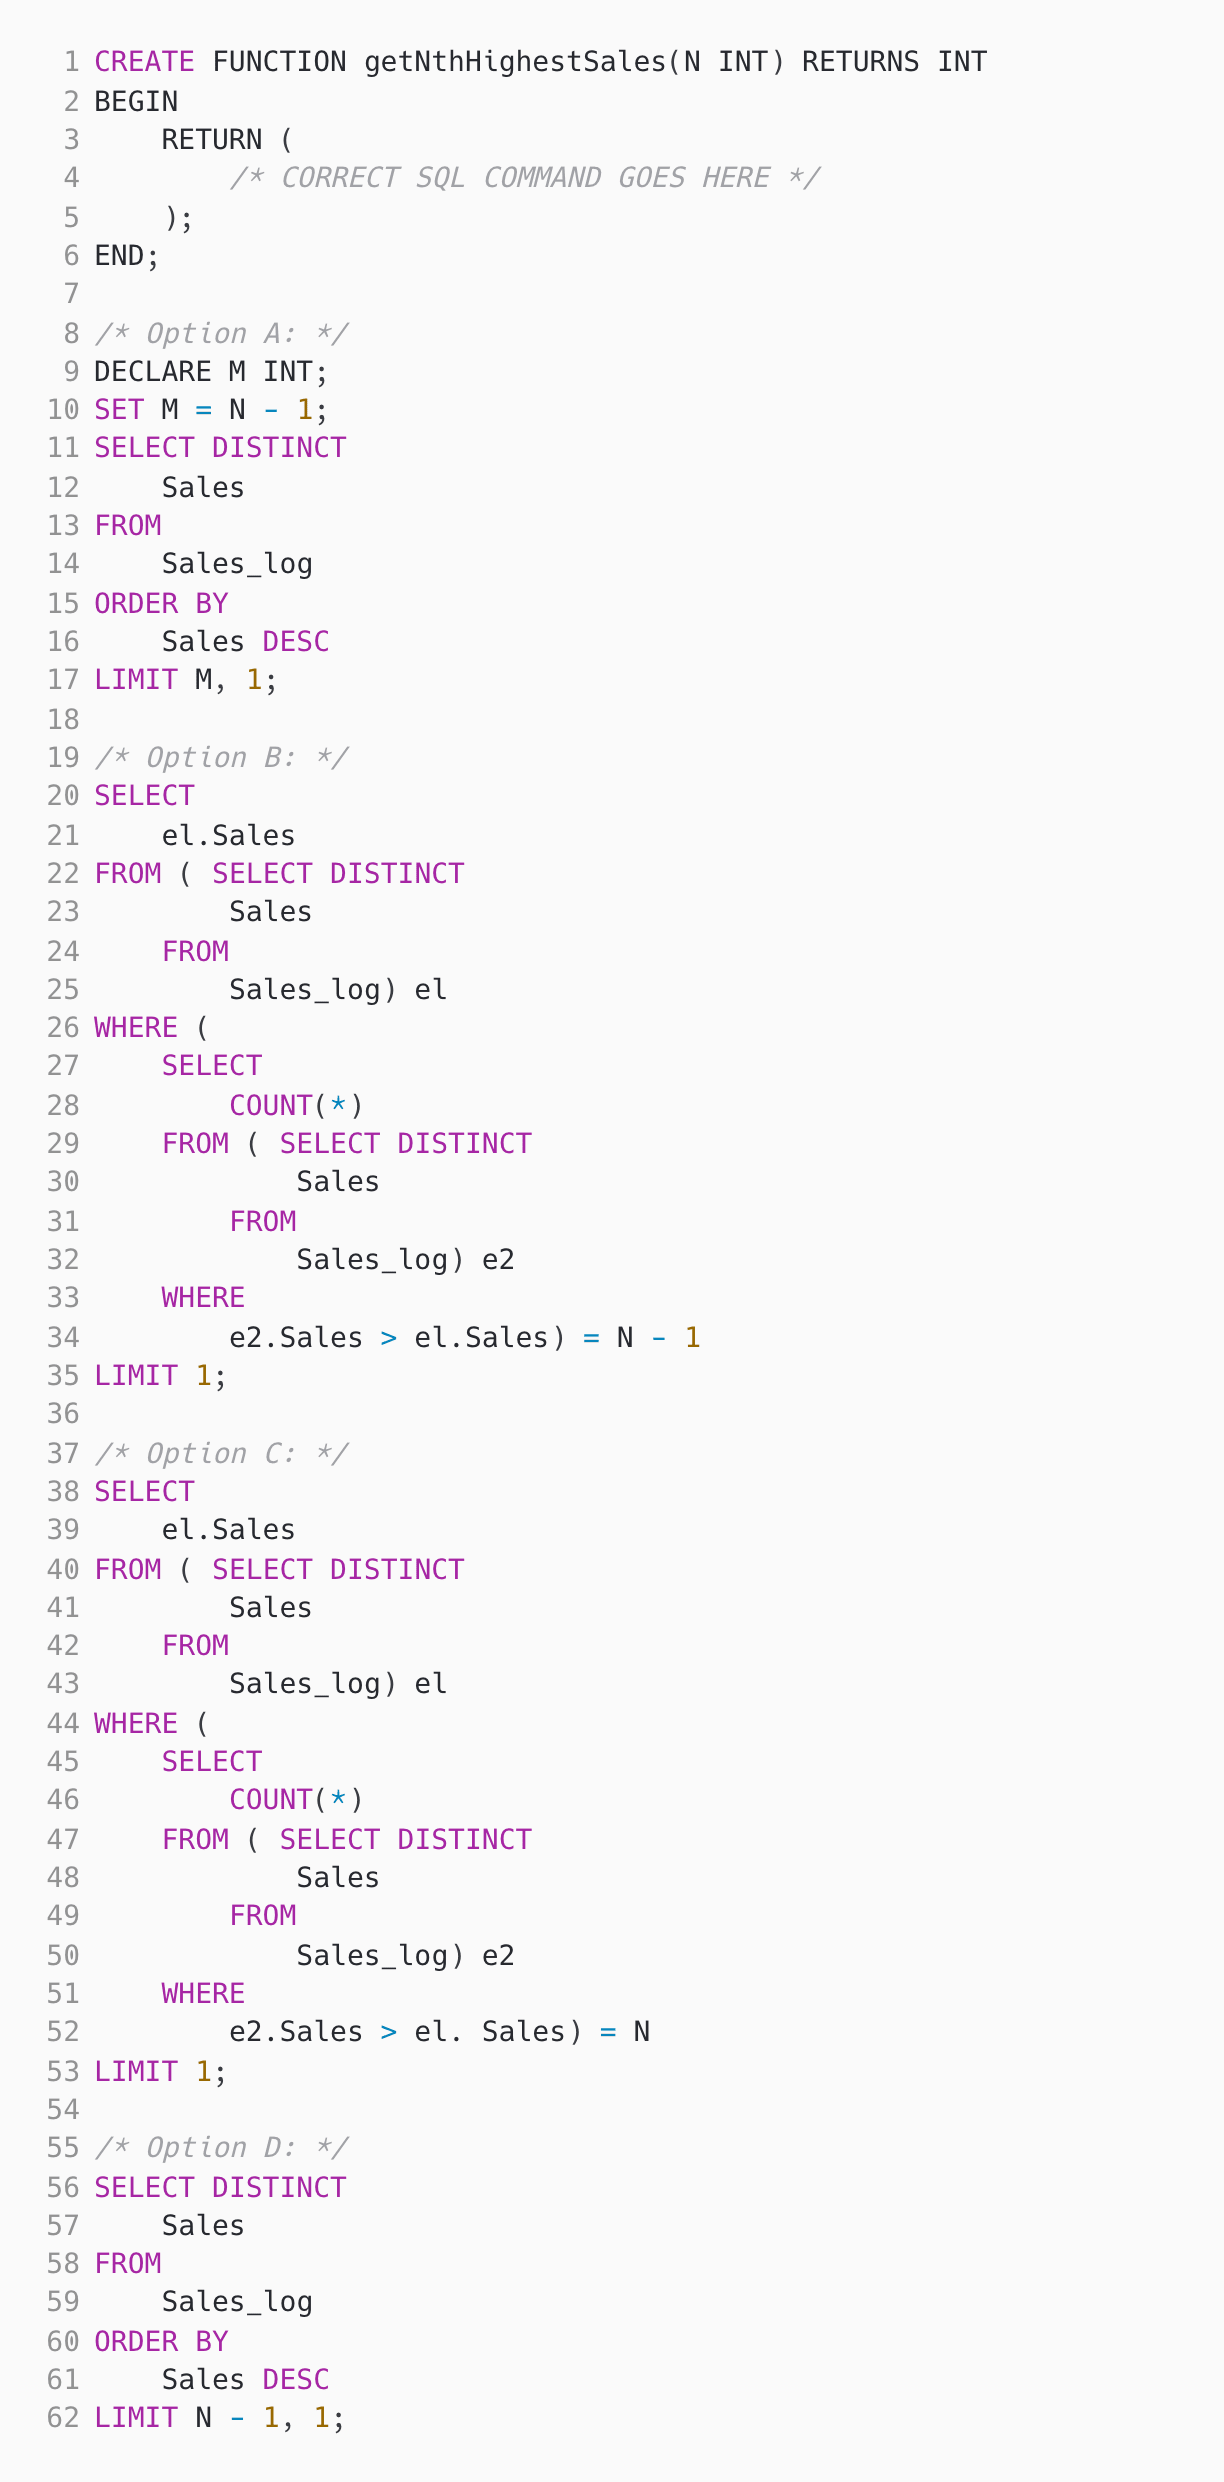
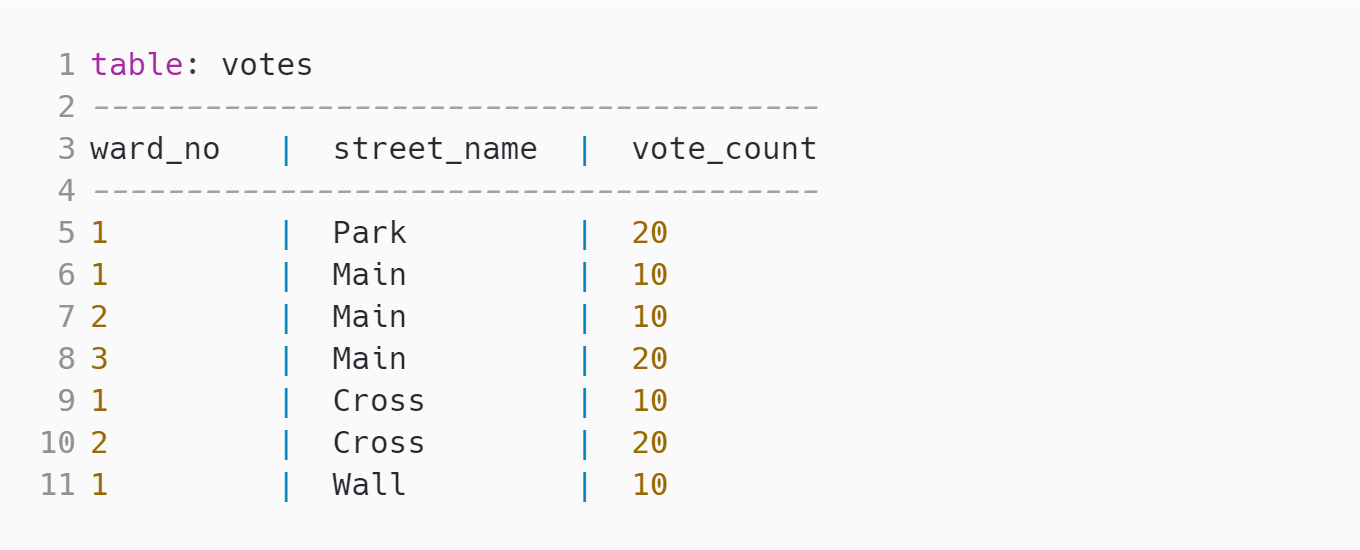
Medium nth highest sales | Solve | ||||
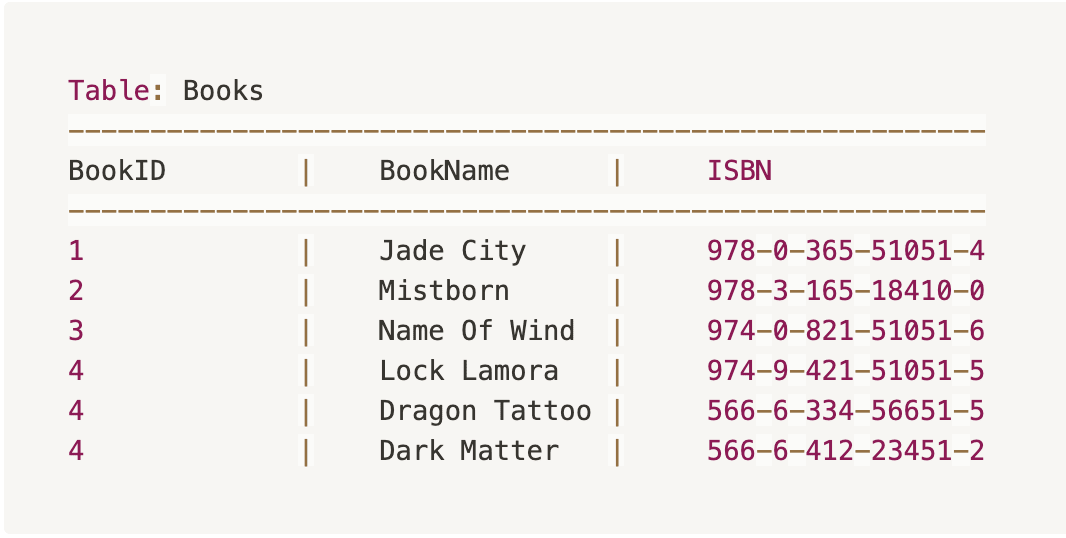
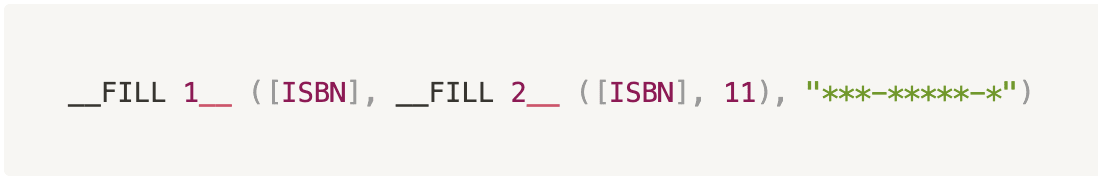
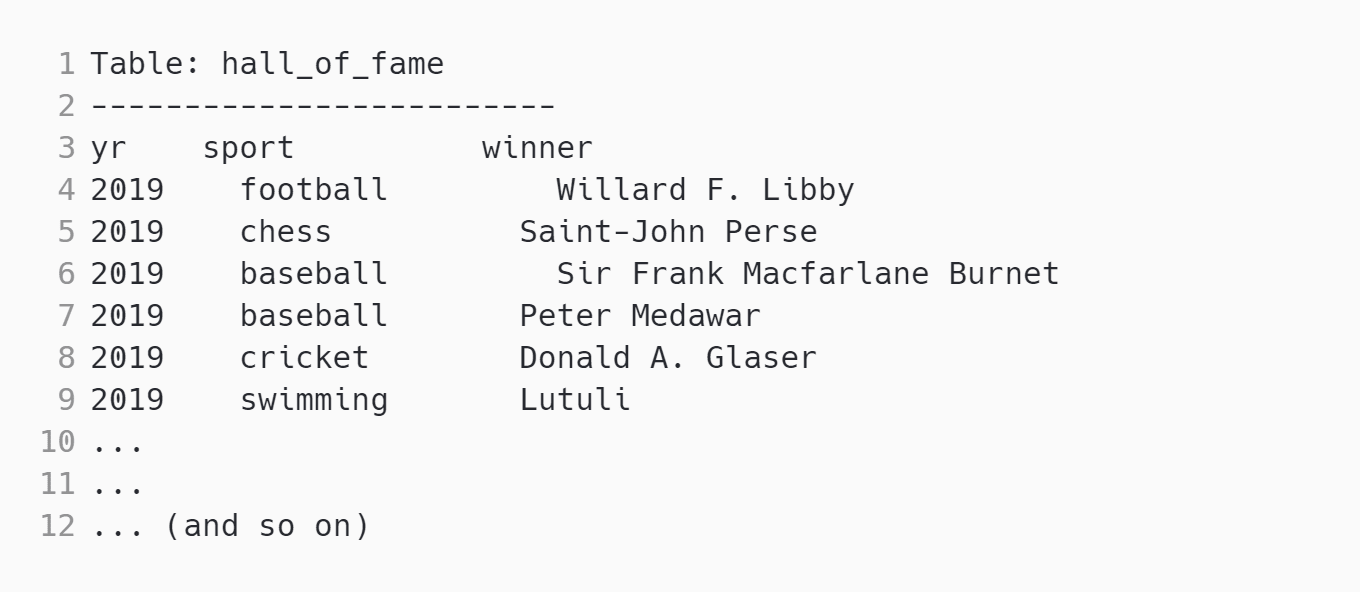
Medium Select & IN | Solve | ||||
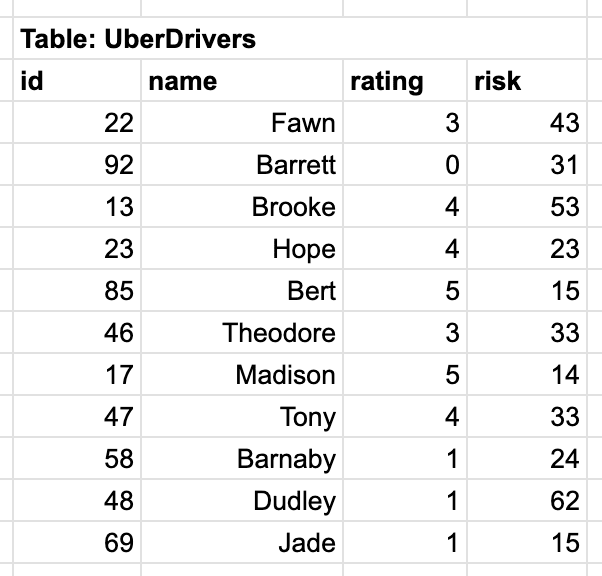
Medium Sorting Ubers | Solve | ||||
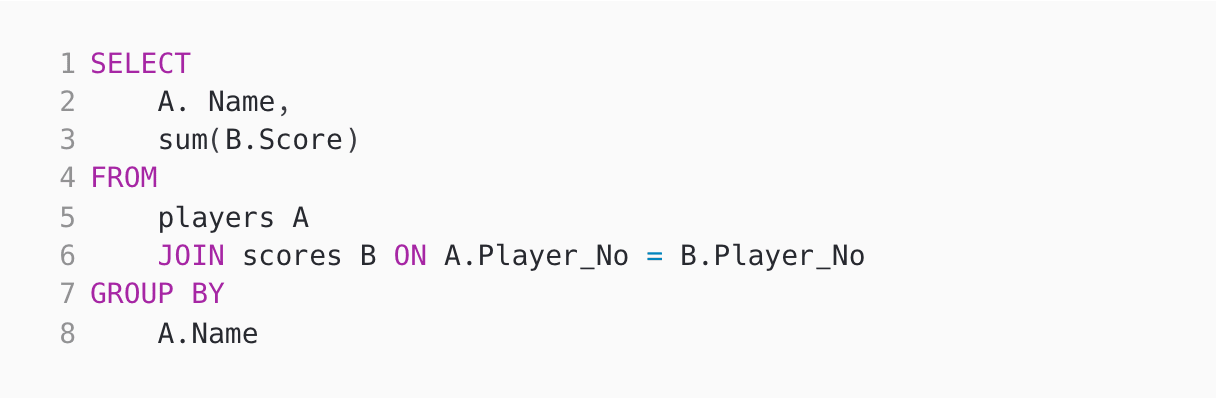
Hard With, AVG & SUM | Solve | ||||
Easy Registration Queue | Solve | ||||
Medium Visitors Count | Solve | ||||
| 🧐 Question | 🔧 Skill | ||
|---|---|---|---|
Medium Data Filtering | 2 mins Power BI | Solve | |
Medium Many-to-one error | 2 mins Power BI | Solve | |
Medium Power Query Functions | 2 mins Power BI | Solve | |
Medium Calculated Properties | 3 mins Tableau | Solve | |
Medium Change display icon | 2 mins Tableau | Solve | |
Easy Pie Chart | 3 mins Tableau | Solve | |
Medium Applying Functions | 3 mins R | Solve | |
Medium Dataframe Transform | 3 mins R | Solve | |
Medium Matrix Manipulation | 3 mins R | Solve | |
Medium ZeroDivisionError and IndexError | 2 mins Python | Solve | |
Medium Session | 2 mins Python | Solve | |
Medium Max Code | 2 mins Python | Solve | |
Medium Recursive Function | 3 mins Python | Solve | |
Medium Stacking problem | 4 mins Python | Solve | |
Medium Multi Select | 2 mins SQL | Solve | |
Medium nth highest sales | 3 mins SQL | Solve | |
Medium Select & IN | 3 mins SQL | Solve | |
Medium Sorting Ubers | 3 mins SQL | Solve | |
Hard With, AVG & SUM | 2 mins SQL | Solve | |
Easy Registration Queue | 30 mins Coding | Solve | |
Medium Visitors Count | 30 mins Coding | Solve |
| 🧐 Question | 🔧 Skill | 💪 Difficulty | ⌛ Time | ||
|---|---|---|---|---|---|
Data Filtering | Power BI | Medium | 2 mins | Solve | |
Many-to-one error | Power BI | Medium | 2 mins | Solve | |
Power Query Functions | Power BI | Medium | 2 mins | Solve | |
Calculated Properties | Tableau | Medium | 3 mins | Solve | |
Change display icon | Tableau | Medium | 2 mins | Solve | |
Pie Chart | Tableau | Easy | 3 mins | Solve | |
Applying Functions | R | Medium | 3 mins | Solve | |
Dataframe Transform | R | Medium | 3 mins | Solve | |
Matrix Manipulation | R | Medium | 3 mins | Solve | |
ZeroDivisionError and IndexError | Python | Medium | 2 mins | Solve | |
Session | Python | Medium | 2 mins | Solve | |
Max Code | Python | Medium | 2 mins | Solve | |
Recursive Function | Python | Medium | 3 mins | Solve | |
Stacking problem | Python | Medium | 4 mins | Solve | |
Multi Select | SQL | Medium | 2 mins | Solve | |
nth highest sales | SQL | Medium | 3 mins | Solve | |
Select & IN | SQL | Medium | 3 mins | Solve | |
Sorting Ubers | SQL | Medium | 3 mins | Solve | |
With, AVG & SUM | SQL | Hard | 2 mins | Solve | |
Registration Queue | Coding | Easy | 30 mins | Solve | |
Visitors Count | Coding | Medium | 30 mins | Solve |
Dzięki Adaface udało nam się zoptymalizować nasz proces wstępnej selekcji o ponad 75%, oszczędzając cenny czas zarówno menedżerom ds. rekrutacji, jak i naszemu zespołowi ds. pozyskiwania talentów!
Brandon Lee, Głowa Ludu, Love, Bonito
The most important thing while implementing the pre-employment Test dla programisty BI in your hiring process is that it is an elimination tool, not a selection tool. In other words: you want to use the test to eliminate the candidates who do poorly on the test, not to select the candidates who come out at the top. While they are super valuable, pre-employment tests do not paint the entire picture of a candidate’s abilities, knowledge, and motivations. Multiple easy questions are more predictive of a candidate's ability than fewer hard questions. Harder questions are often "trick" based questions, which do not provide any meaningful signal about the candidate's skillset.
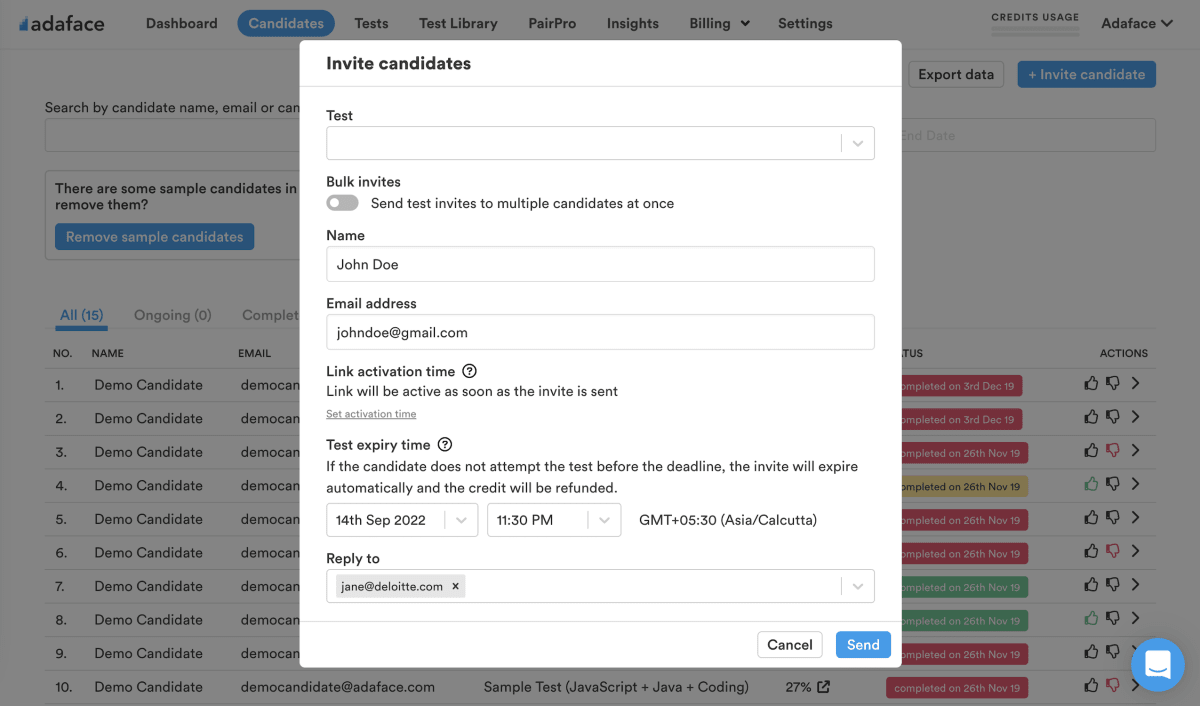
Science behind Adaface testsEmail invites: You can send candidates an email invite to the Test dla programisty BI from your dashboard by entering their email address.
Public link: You can create a public link for each test that you can share with candidates.
API or integrations: You can invite candidates directly from your ATS by using our pre-built integrations with popular ATS systems or building a custom integration with your in-house ATS.
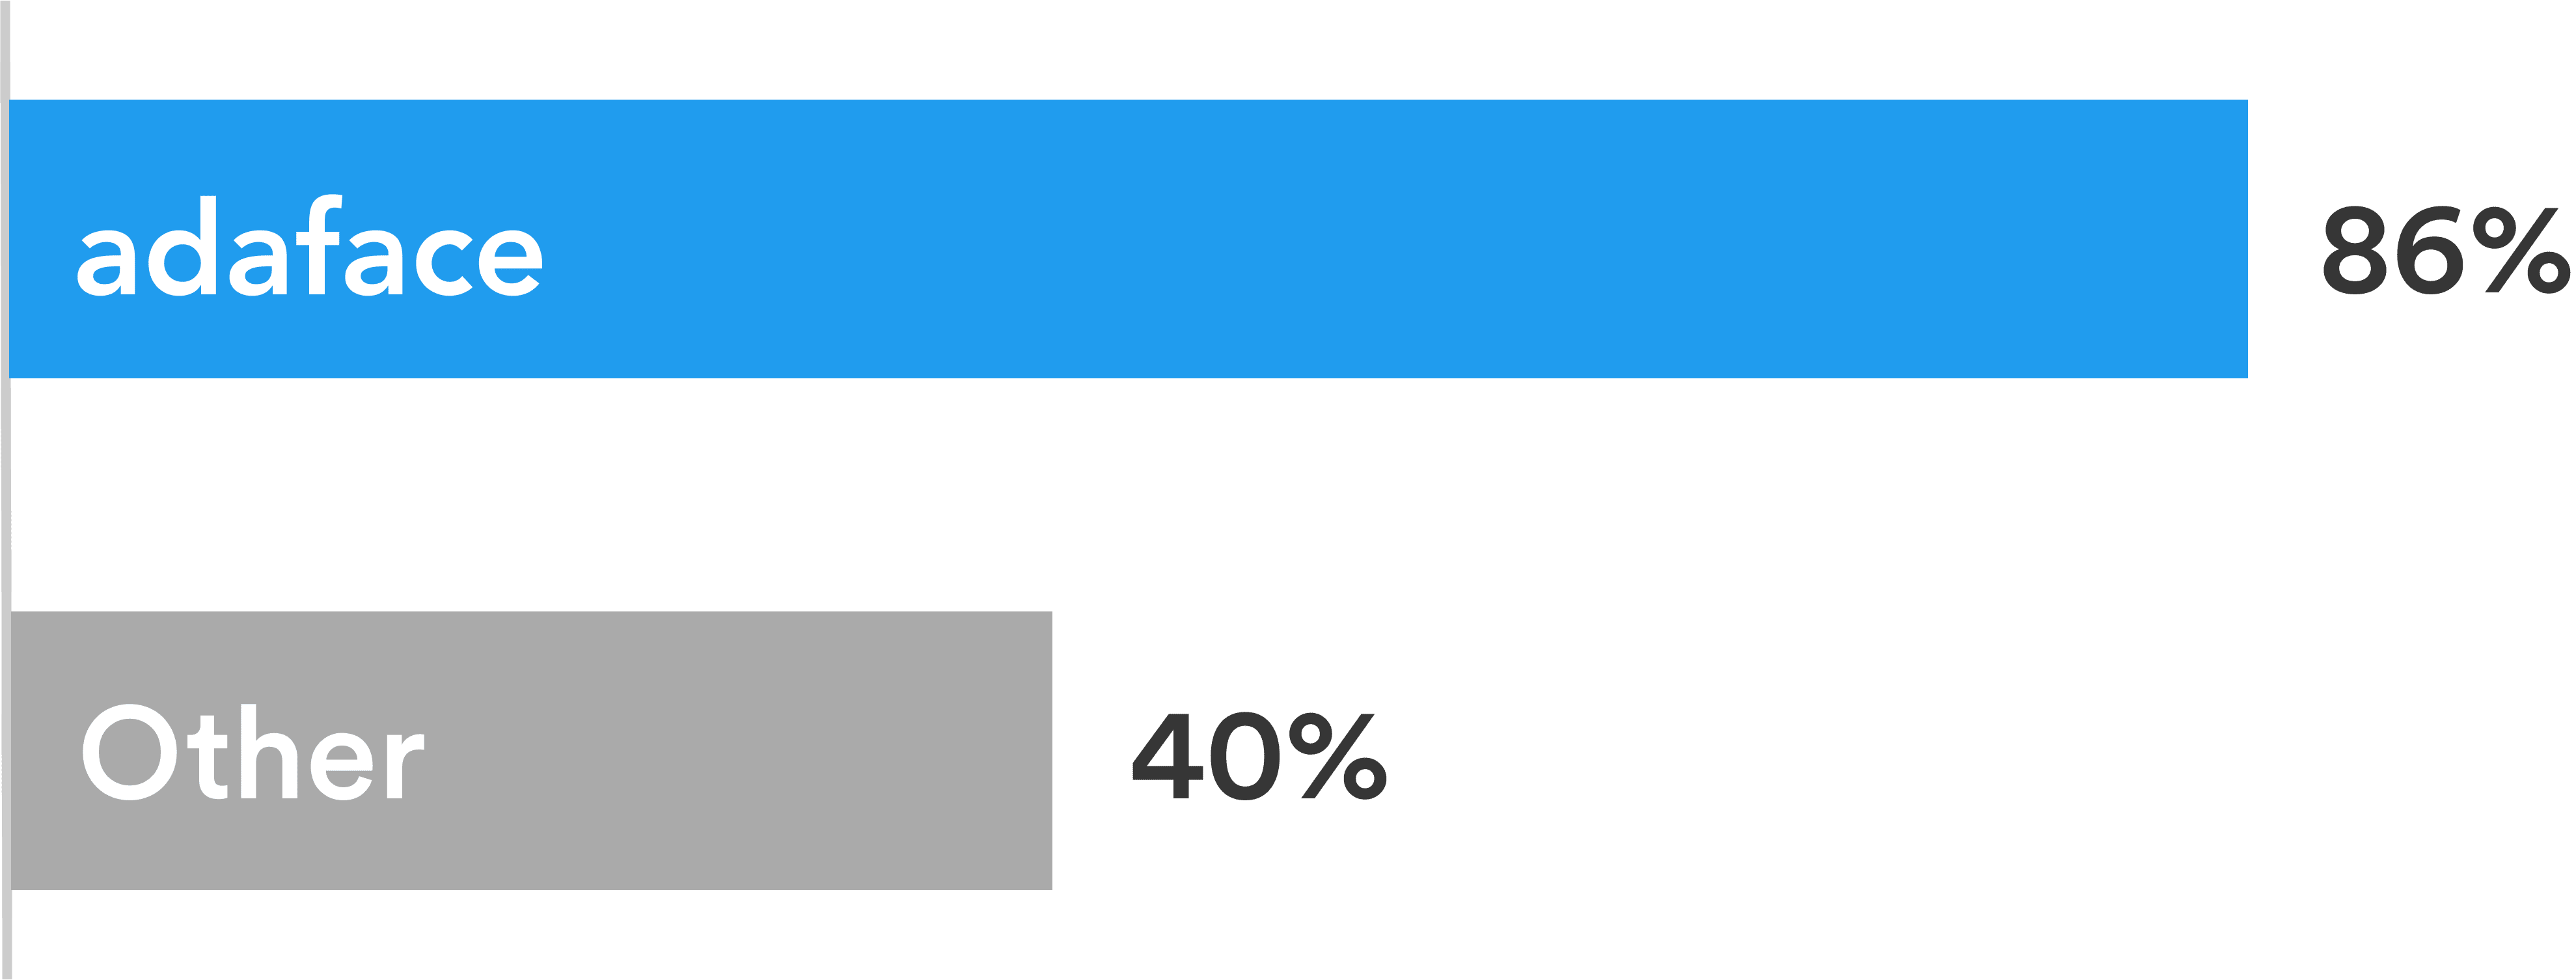
Adaface tests are conversational, low-stress, and take just 25-40 mins to complete.
This is why Adaface has the highest test-completion rate (86%), which is more than 2x better than traditional assessments.
ChatGPT protection
Screen proctoring
Plagiarism detection
Non-googleable questions
User authentication
IP proctoring
Web proctoring
Webcam proctoring
Full screen proctoring
Copy paste protection
Menedżerowie ds. rekrutacji mieli poczucie, że dzięki technicznym pytaniom, które zadawali podczas rozmów panelowych, byli w stanie stwierdzić, którzy kandydaci uzyskali lepsze wyniki, i odróżnić się od tych, którzy również nie uzyskali takich punktów. Oni są bardzo zadowolony z jakością kandydatów wybranych do selekcji Adaface.
Tak, absolutnie. Oceny niestandardowe są konfigurowane na podstawie opisu stanowiska i będą zawierać pytania dotyczące wszystkich określonych umiejętności, które określasz.
Mamy następujące funkcje anty-cheatingowe:
Przeczytaj więcej o funkcjach Proctoring.
Najważniejsze, o czym należy pamiętać, jest to, że ocena jest narzędziem eliminacyjnym, a nie narzędziem wyboru. Ocena umiejętności jest zoptymalizowana, aby pomóc Ci wyeliminować kandydatów, którzy nie są technicznie zakwalifikowani do roli, nie jest zoptymalizowana, aby pomóc Ci znaleźć najlepszego kandydata do tej roli. Dlatego idealnym sposobem na wykorzystanie oceny jest podjęcie decyzji o wyniku progowym (zwykle 55%, pomagamy Ci porównać) i zaprosić wszystkich kandydatów, którzy wyniki powyżej progu na następne rundy wywiadu.
Każda ocena Adaface jest dostosowana do opisu stanowiska/ idealnego kandydującego osobowości (nasi eksperci przedmiotu będą podejmować właściwe pytania dotyczące oceny z naszej biblioteki ponad 10000 pytań). Ocenę tę można dostosować do dowolnego poziomu doświadczenia.
Tak, znacznie ułatwia porównanie kandydatów. Opcje pytań MCQ i kolejność pytań są losowe. Mamy funkcje anty-cheating/proctoring. W naszym planie korporacyjnym mamy również możliwość tworzenia wielu wersji tej samej oceny z pytaniami o podobnych poziomach trudności.
Nie. Niestety, w tej chwili nie wspieramy testów ćwiczeń. Możesz jednak użyć naszych przykładowych pytań do ćwiczeń.
Możesz sprawdzić nasze Plany cenowe.
Tak, możesz zarejestrować się za darmo i podgląd tego testu.
Oto szybki przewodnik dotyczący jak poprosić o ocenę niestandardową na Adaface.
🌎 Wybierz swój język