Test Duration
70 min
Difficulty Level
Moderate
Questions
- 5 Power BI MCQs
- 5 Tableau MCQs
- 4 R MCQs
- 5 Python MCQs
- 5 Sql MCQs
- 1 Python Coding Question
Availability
Ready to use
About the test:
De Business Intelligence Developer Test gebruikt scenario-gebaseerde meerkeuzevragen om de kennis en vaardigheden van een kandidaat te evalueren met betrekking tot datamodellering en ETL-processen, datawarehousing en datamining, BI-rapportage en visualisatie, data-analyse en voorspellende modellering en BI-projectmanagement. Kandidaten worden ook geëvalueerd op hun vermogen om BI -tools en technologieën te gebruiken, zoals SQL Server, Power BI, Tableau en andere gerelateerde tools, en hun vaardigheid bij het toepassen van gegevensanalyse en business intelligence -technieken om complexe zakelijke problemen op te lossen.
Covered skills:
Test Duration
70 min
Difficulty Level
Moderate
Questions
Availability
Ready to use
The BI -ontwikkelaarstest helps recruiters and hiring managers identify qualified candidates from a pool of resumes, and helps in taking objective hiring decisions. It reduces the administrative overhead of interviewing too many candidates and saves time by filtering out unqualified candidates at the first step of the hiring process.
The test screens for the following skills that hiring managers look for in candidates:
Traditional assessment tools use trick questions and puzzles for the screening, which creates a lot of frustration among candidates about having to go through irrelevant screening assessments.
The main reason we started Adaface is that traditional pre-employment assessment platforms are not a fair way for companies to evaluate candidates. At Adaface, our mission is to help companies find great candidates by assessing on-the-job skills required for a role.
Why we started AdafaceWe have a very high focus on the quality of questions that test for on-the-job skills. Every question is non-googleable and we have a very high bar for the level of subject matter experts we onboard to create these questions. We have crawlers to check if any of the questions are leaked online. If/ when a question gets leaked, we get an alert. We change the question for you & let you know.
How we design questionsDit zijn slechts een klein monster uit onze bibliotheek met meer dan 10.000 vragen. De werkelijke vragen hierover BI -ontwikkelaarstest zal niet-googelbaar zijn.
| 🧐 Question | |||||
|---|---|---|---|---|---|
Medium Data Filtering | Solve | ||||
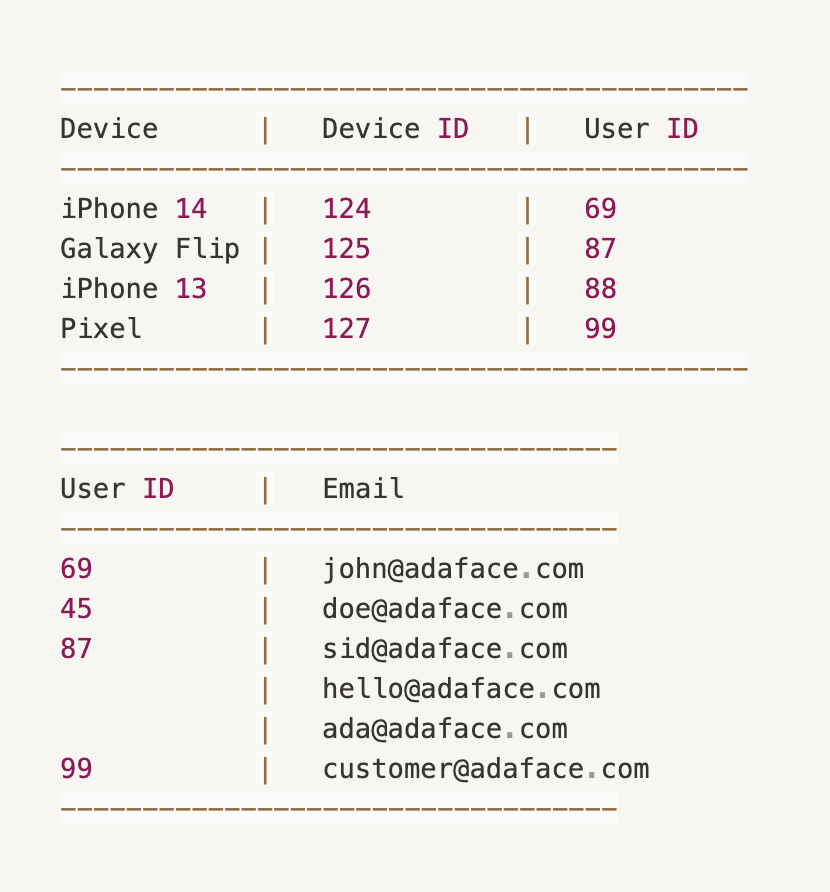
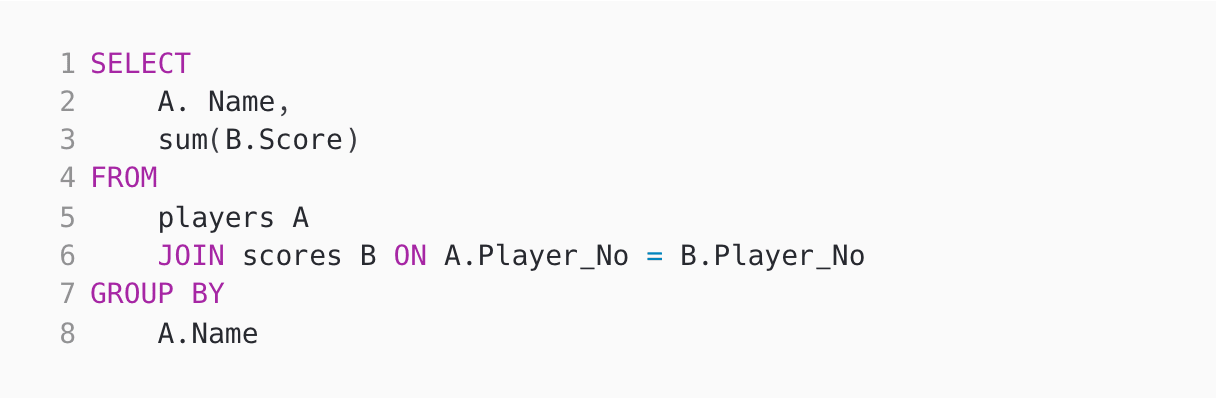
Medium Many-to-one error | Solve | ||||
Medium Power Query Functions | Solve | ||||
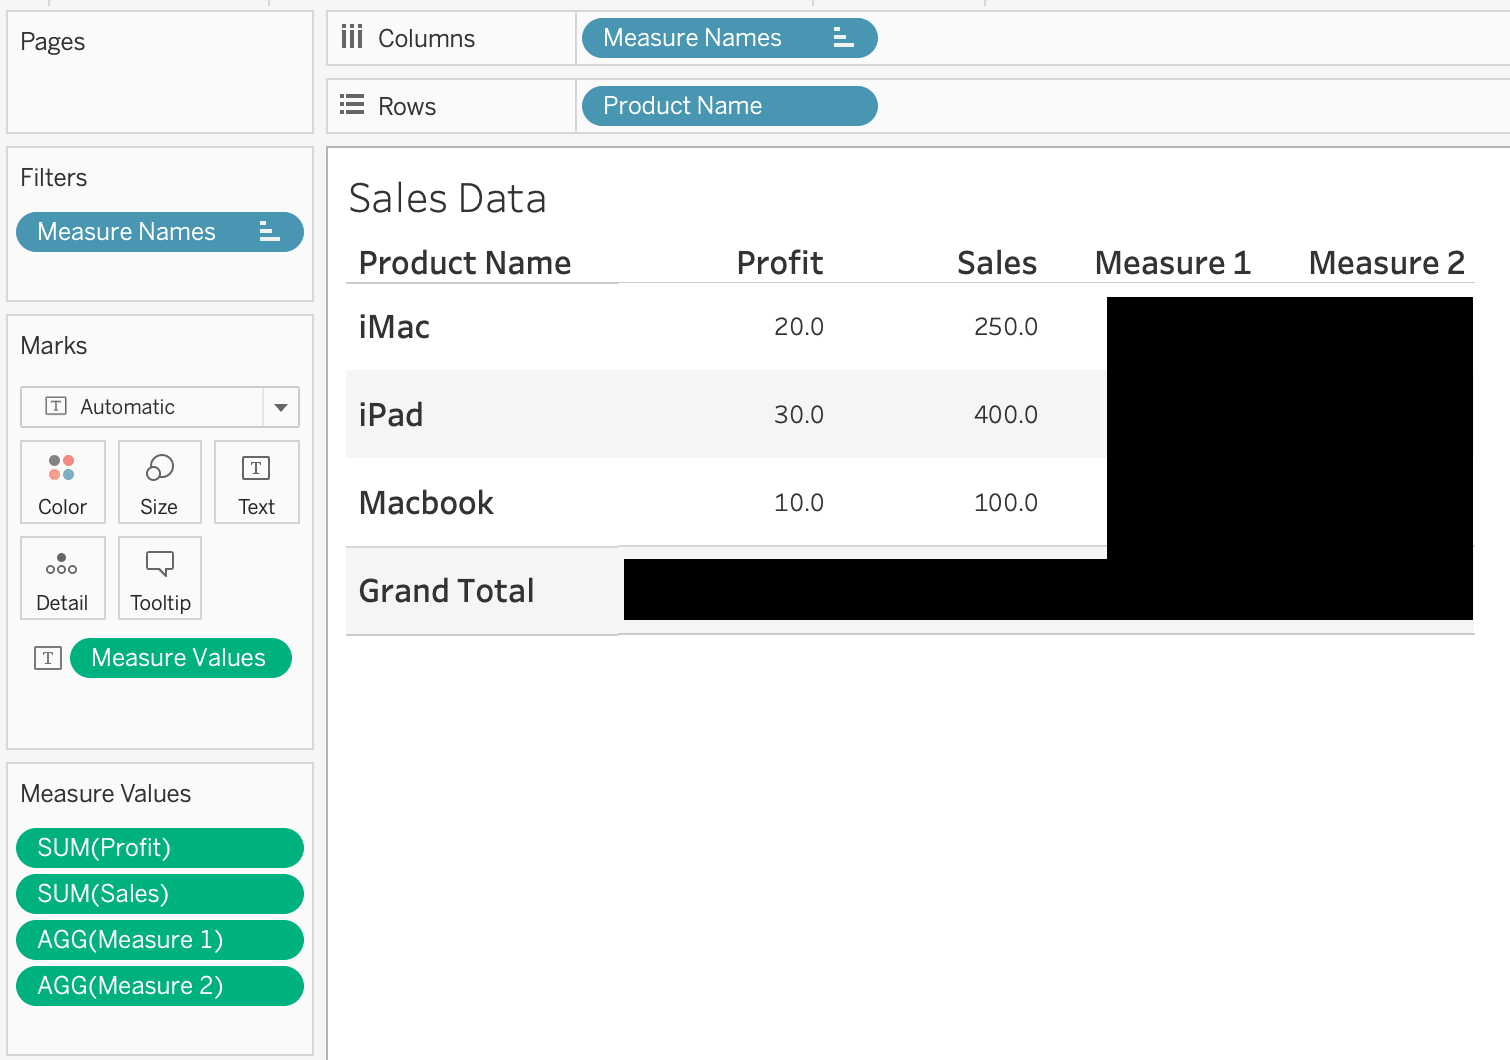
Medium Calculated Properties | Solve | ||||
Medium Change display icon | Solve | ||||
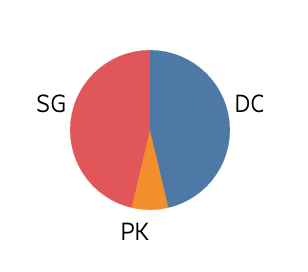
Easy Pie Chart | Solve | ||||
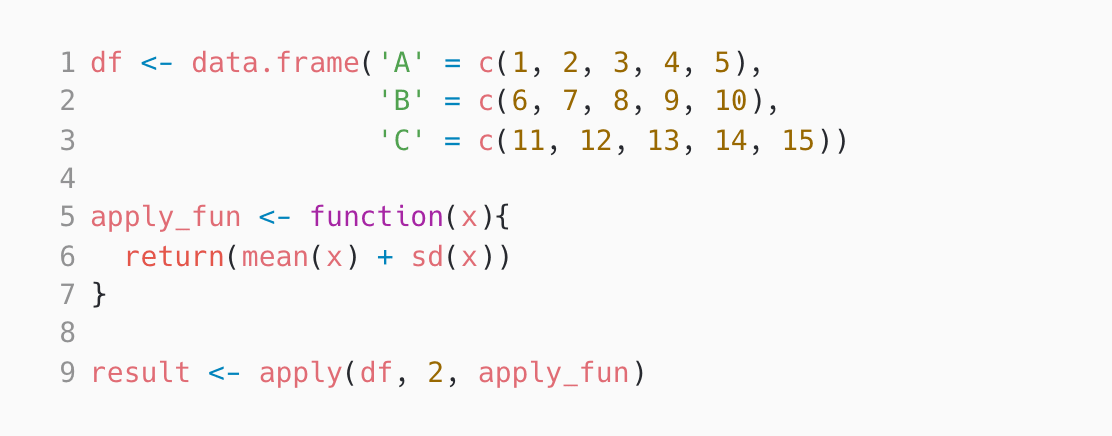
Medium Applying Functions | Solve | ||||
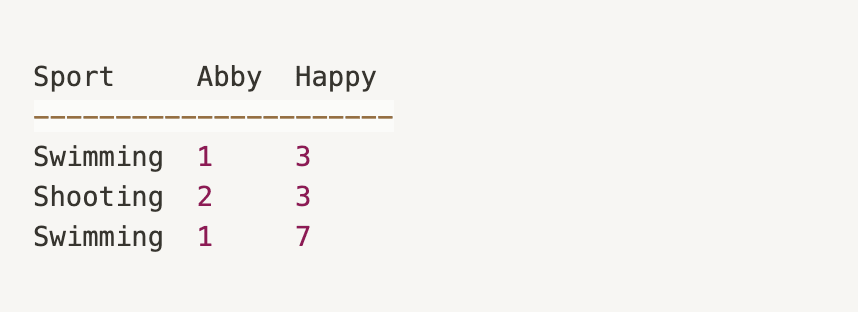
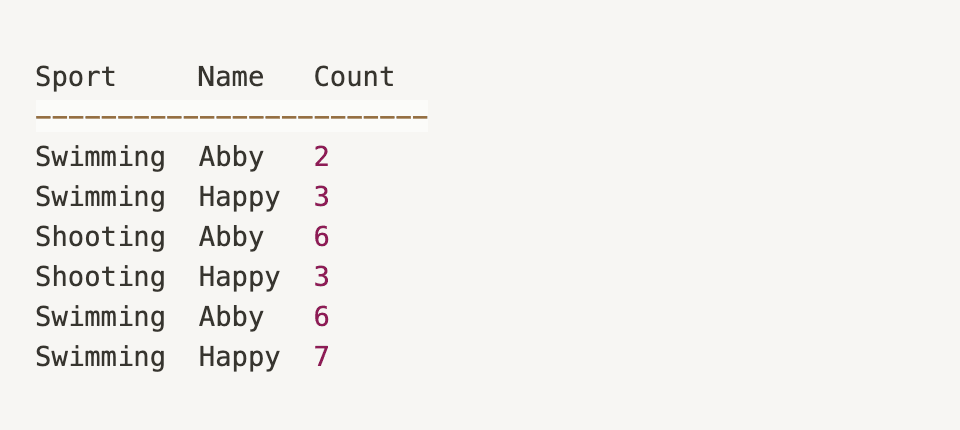
Medium Dataframe Transform | Solve | ||||
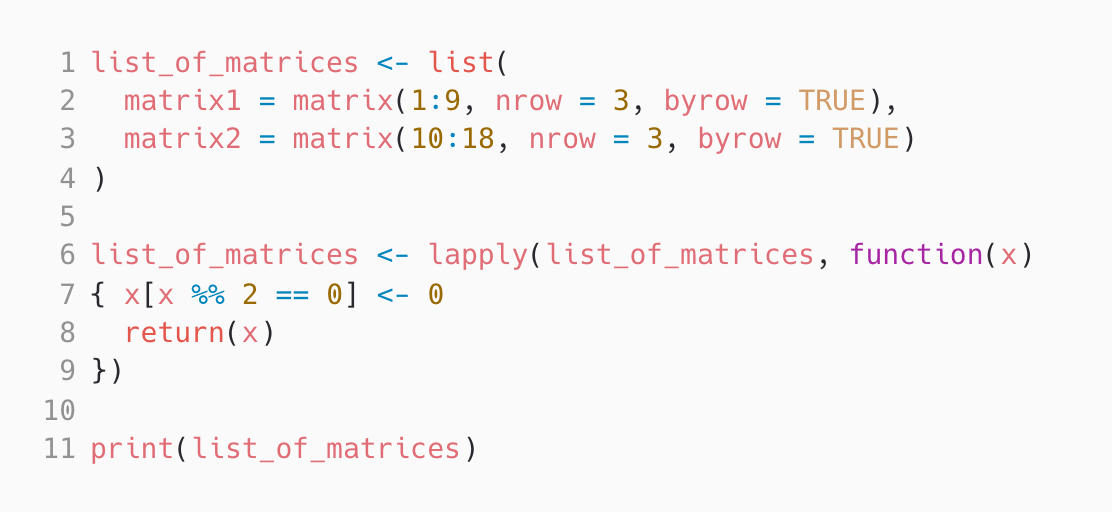
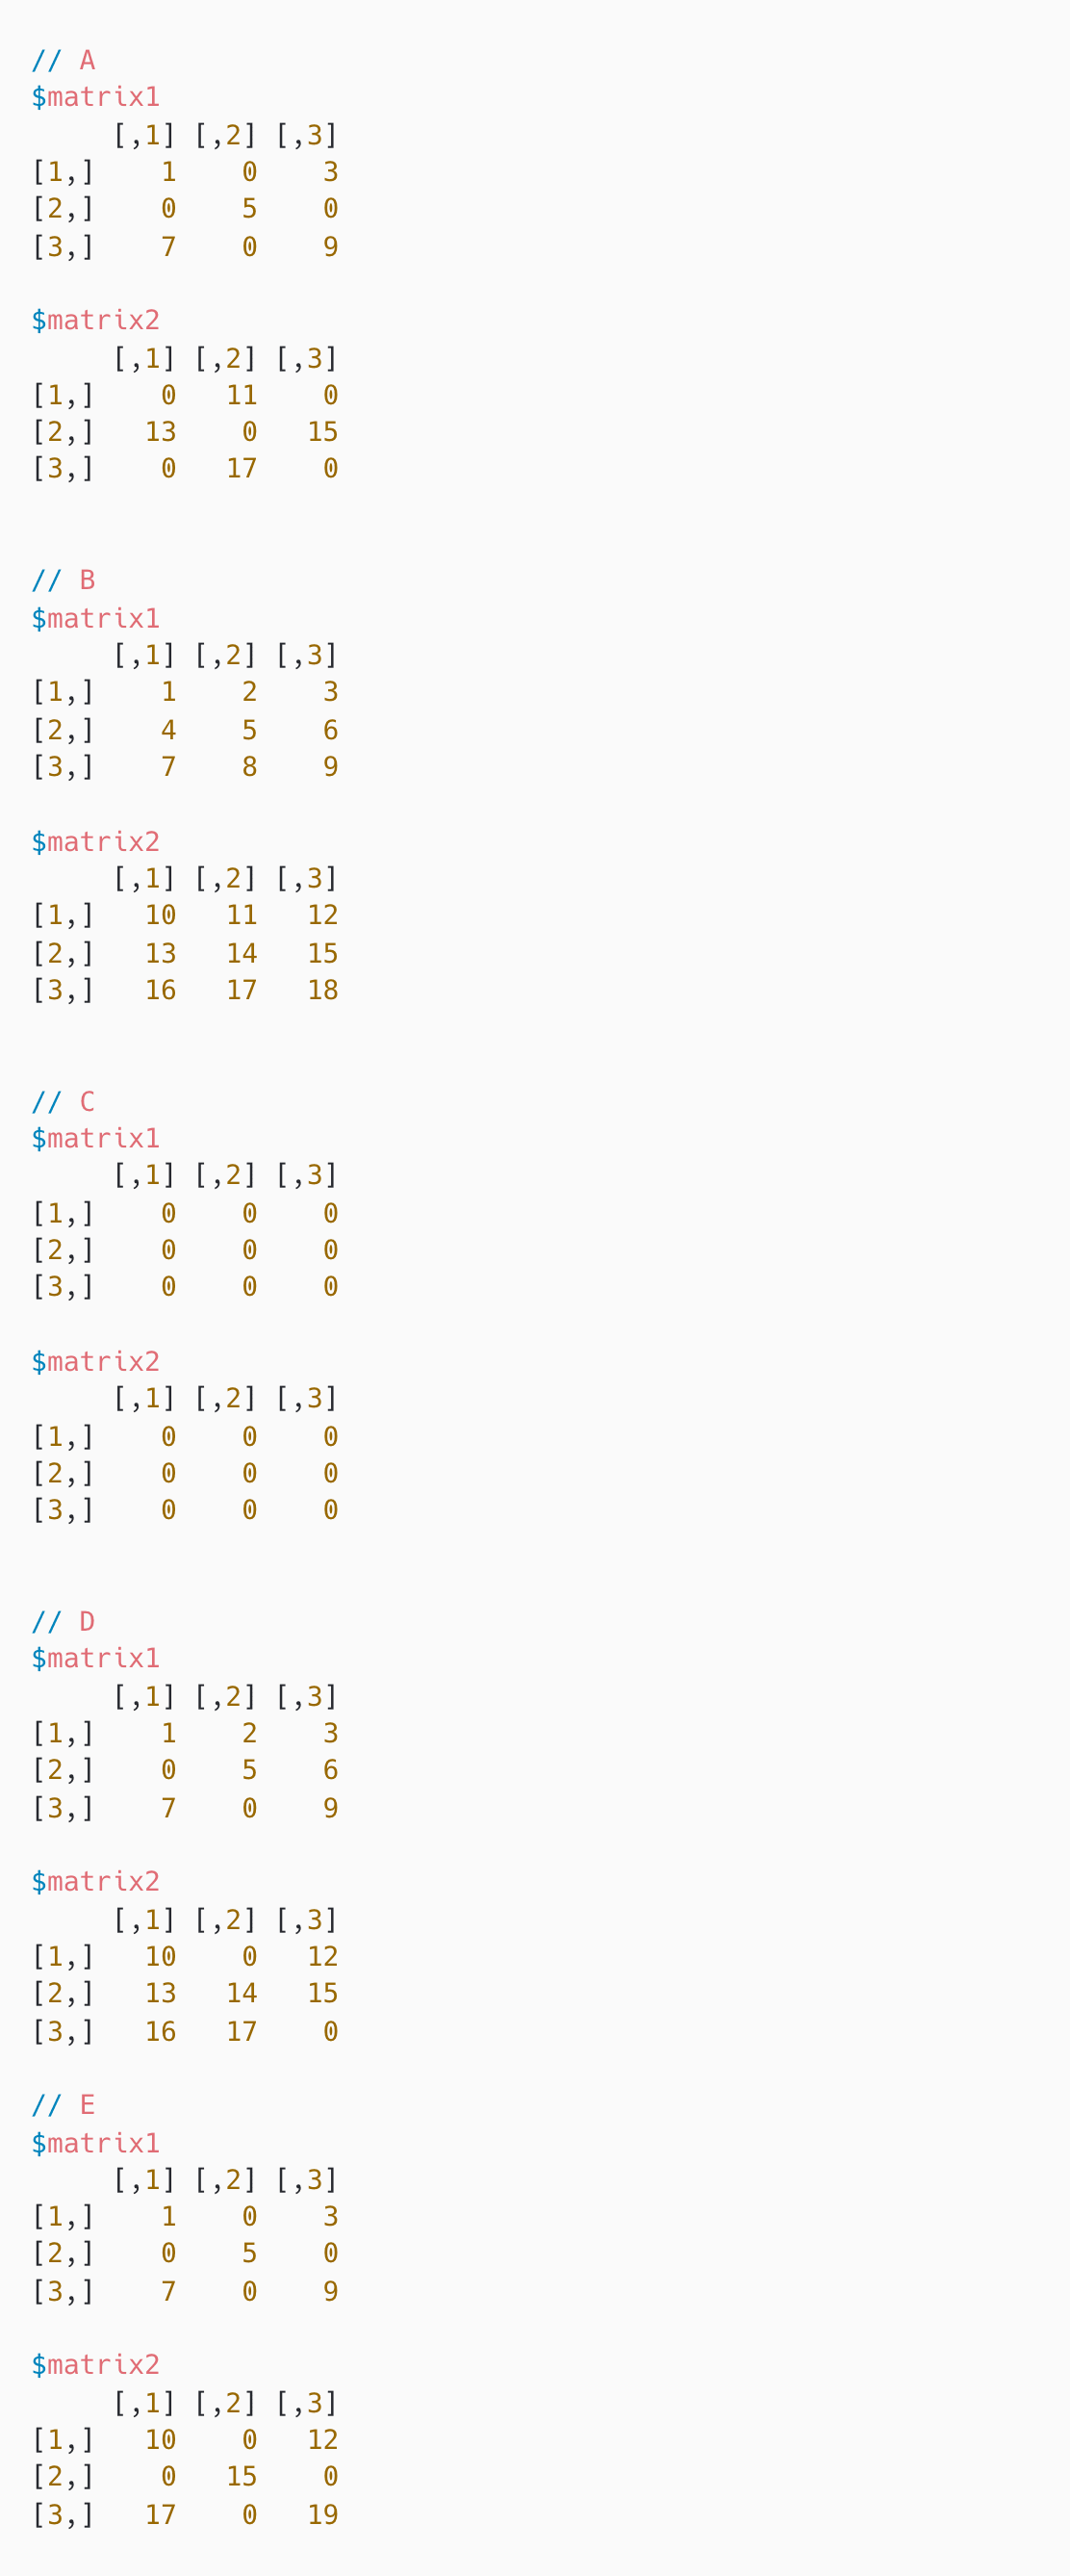
Medium Matrix Manipulation | Solve | ||||
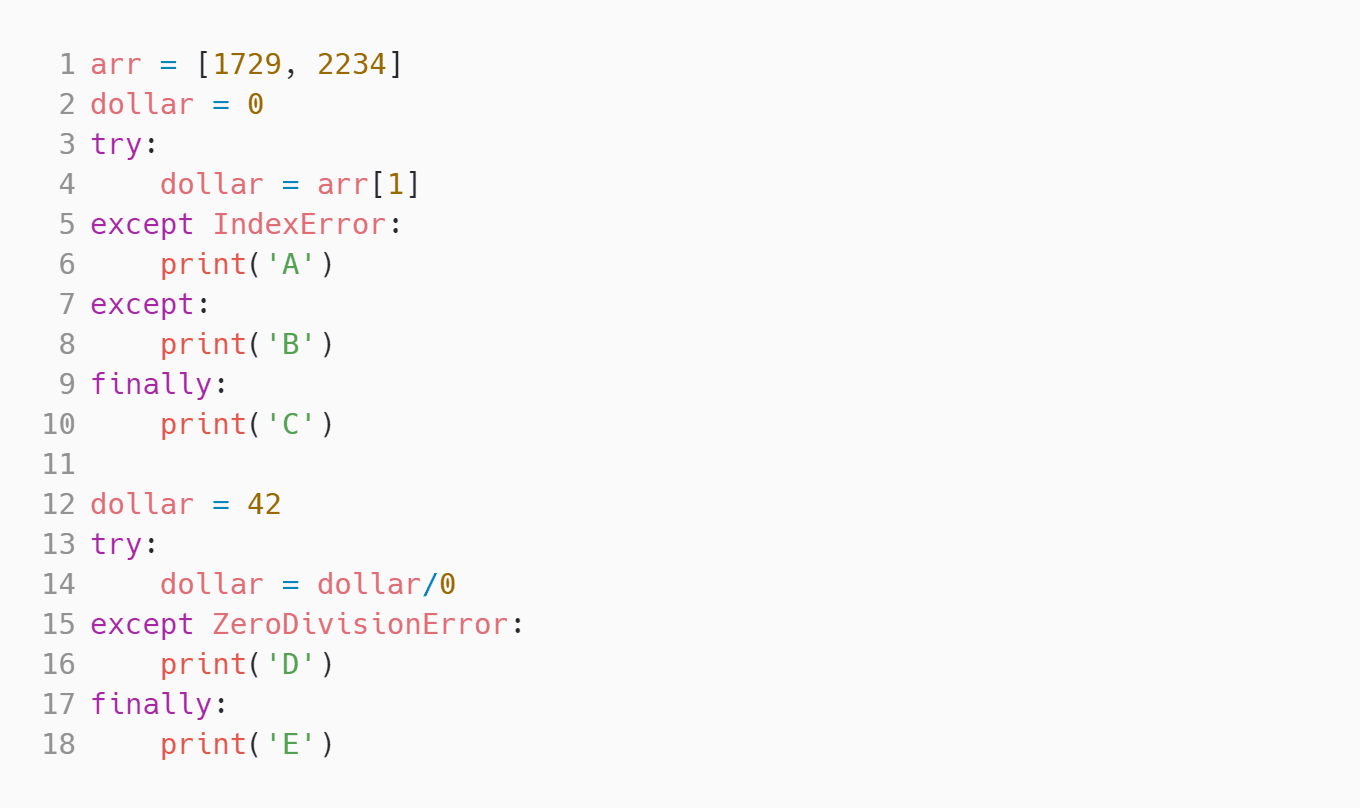
Medium ZeroDivisionError and IndexError | Solve | ||||
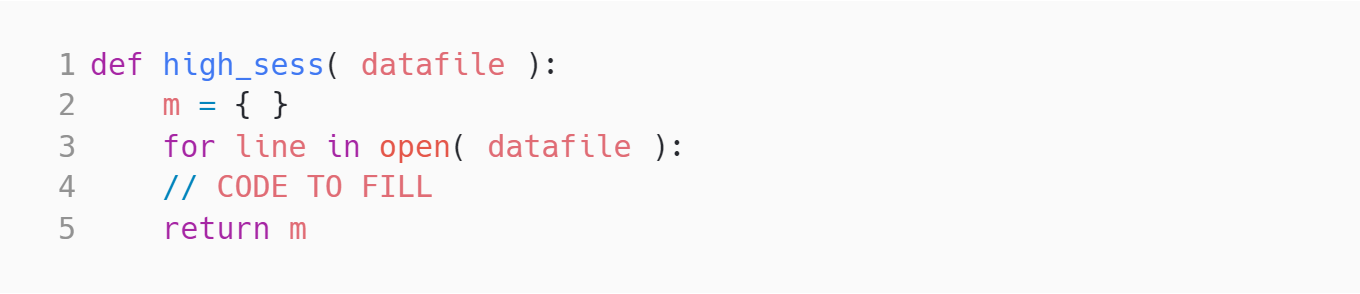
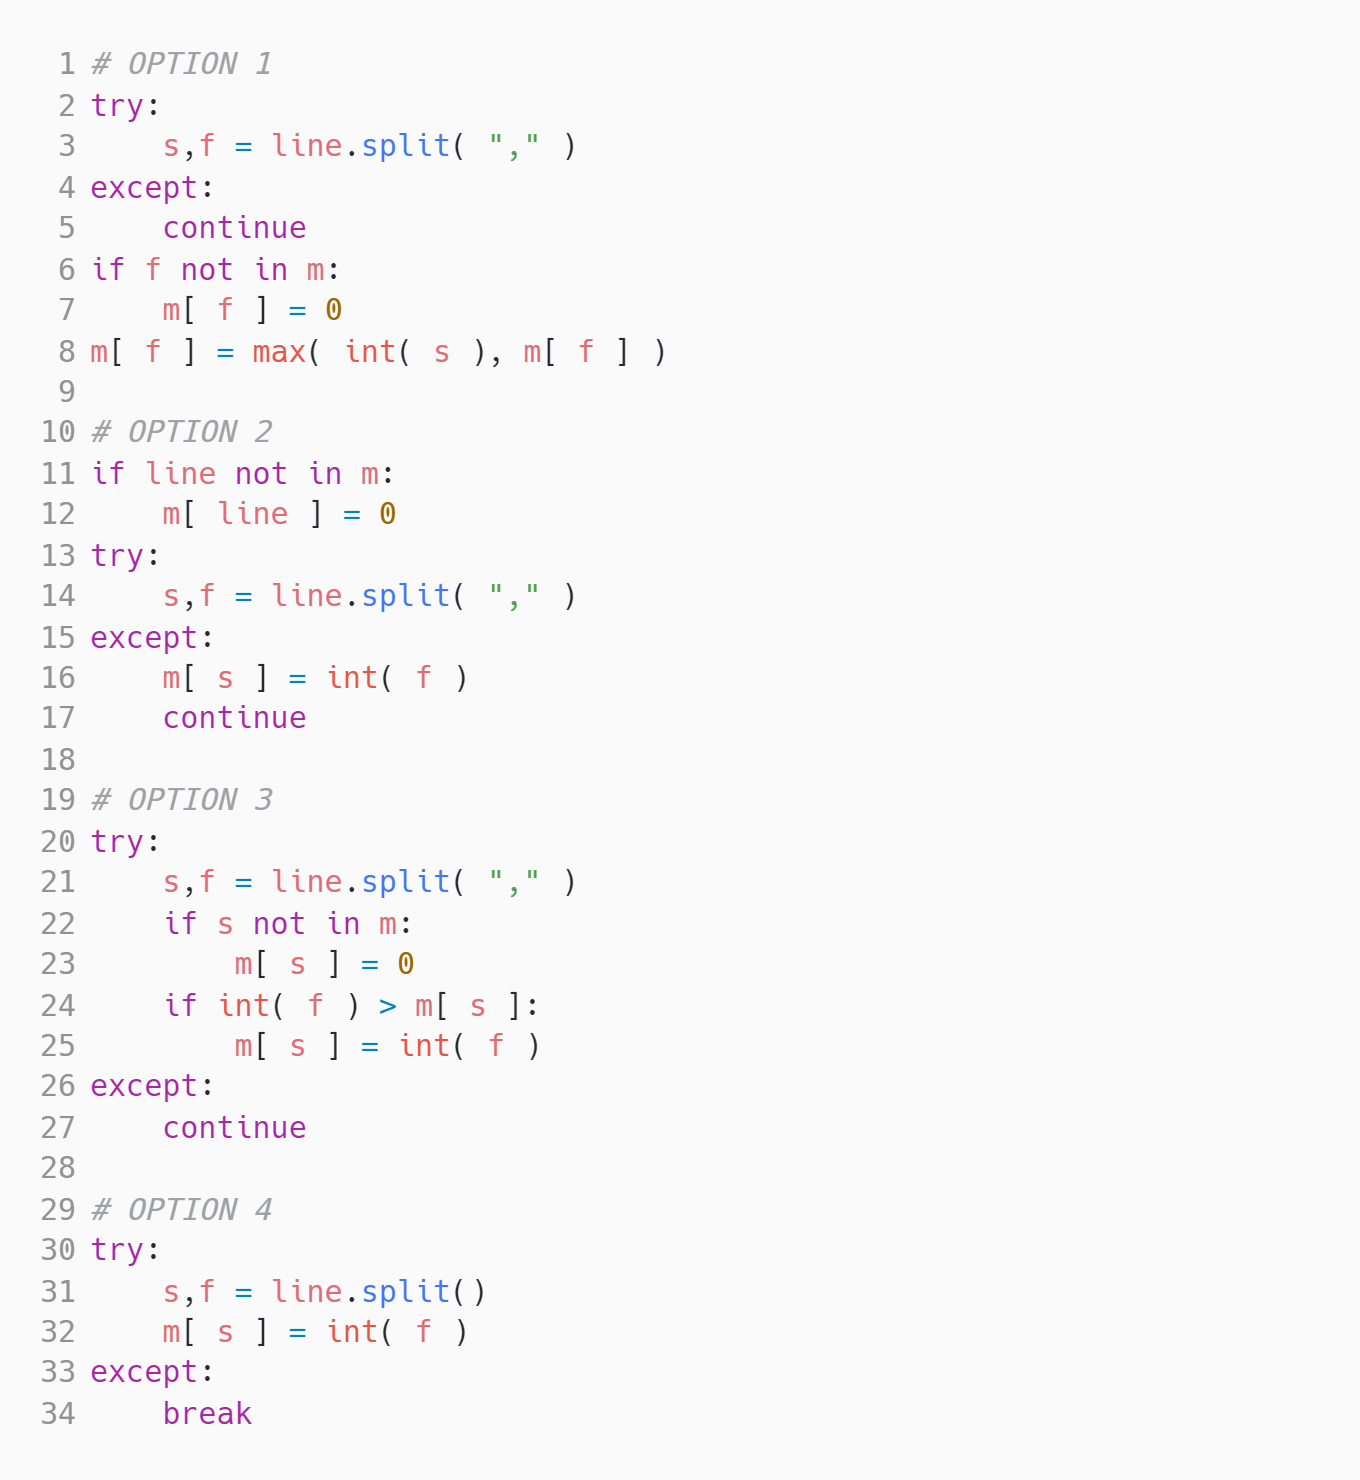
Medium Session | Solve | ||||
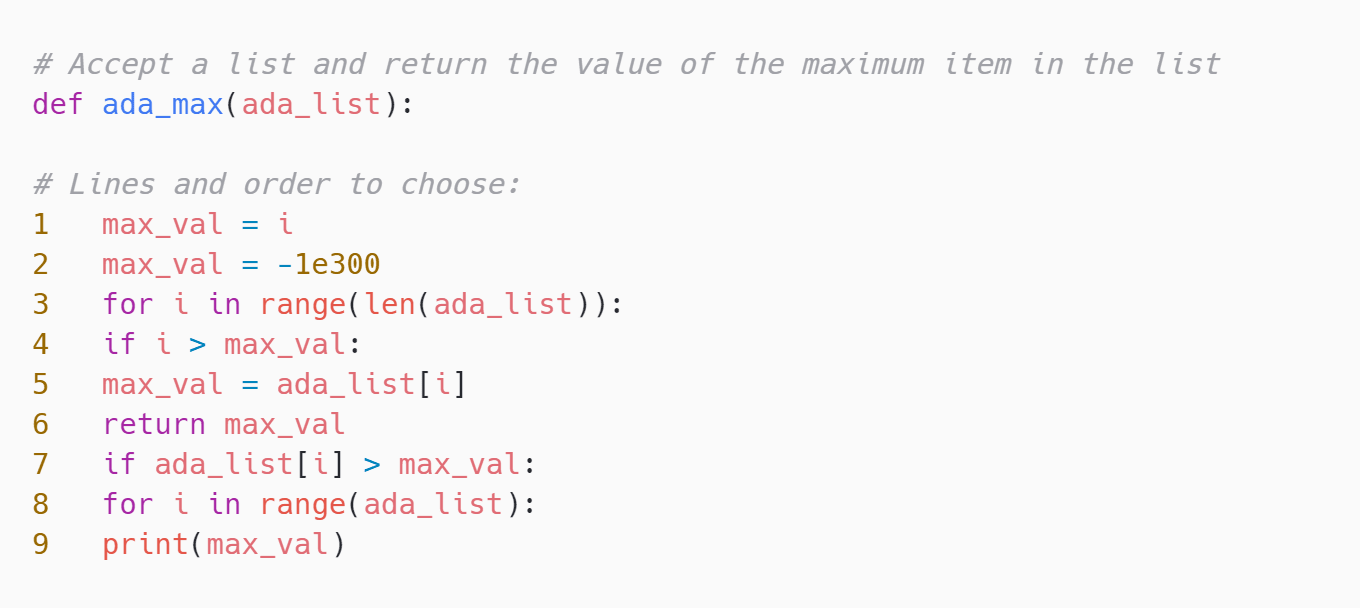
Medium Max Code | Solve | ||||
Medium Recursive Function | Solve | ||||
Medium Stacking problem | Solve | ||||
Medium Multi Select | Solve | ||||
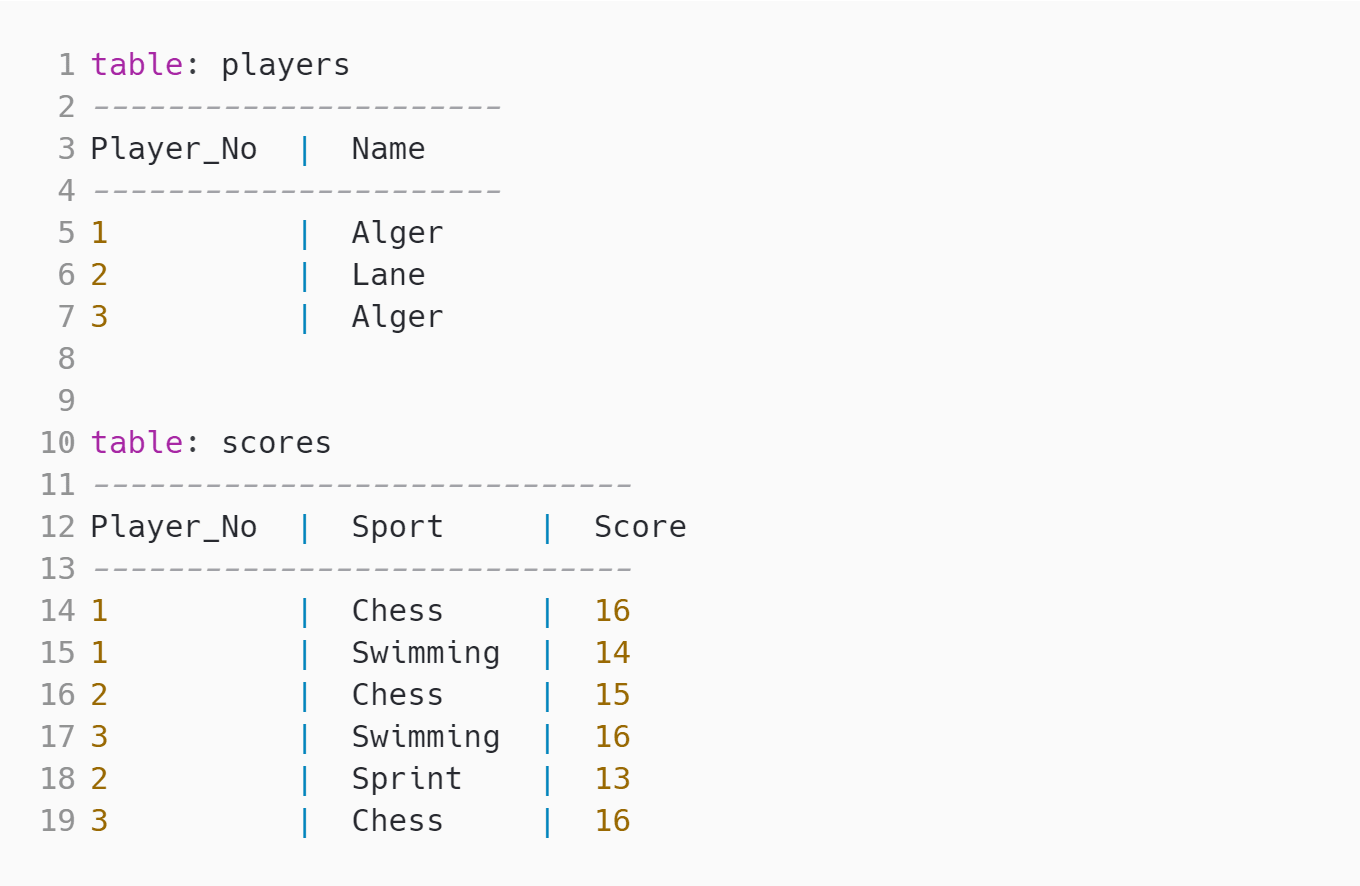
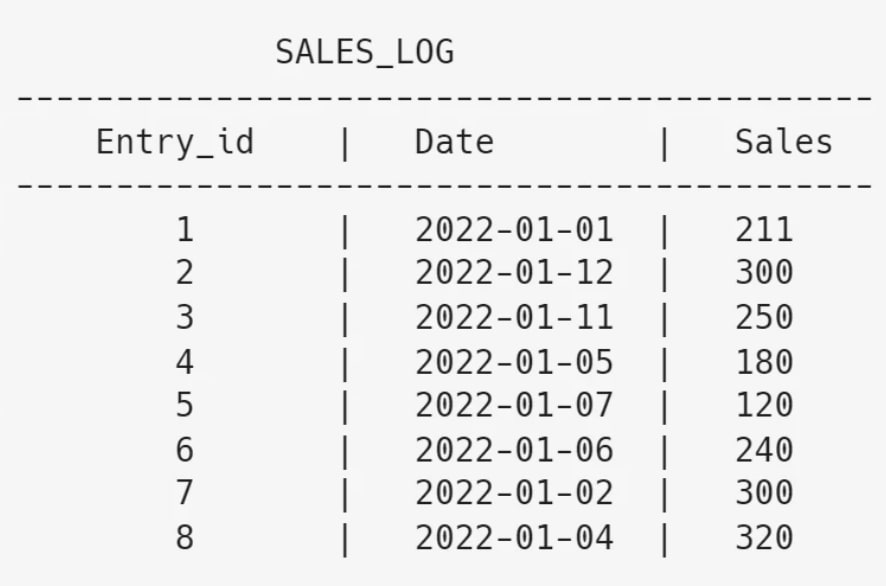
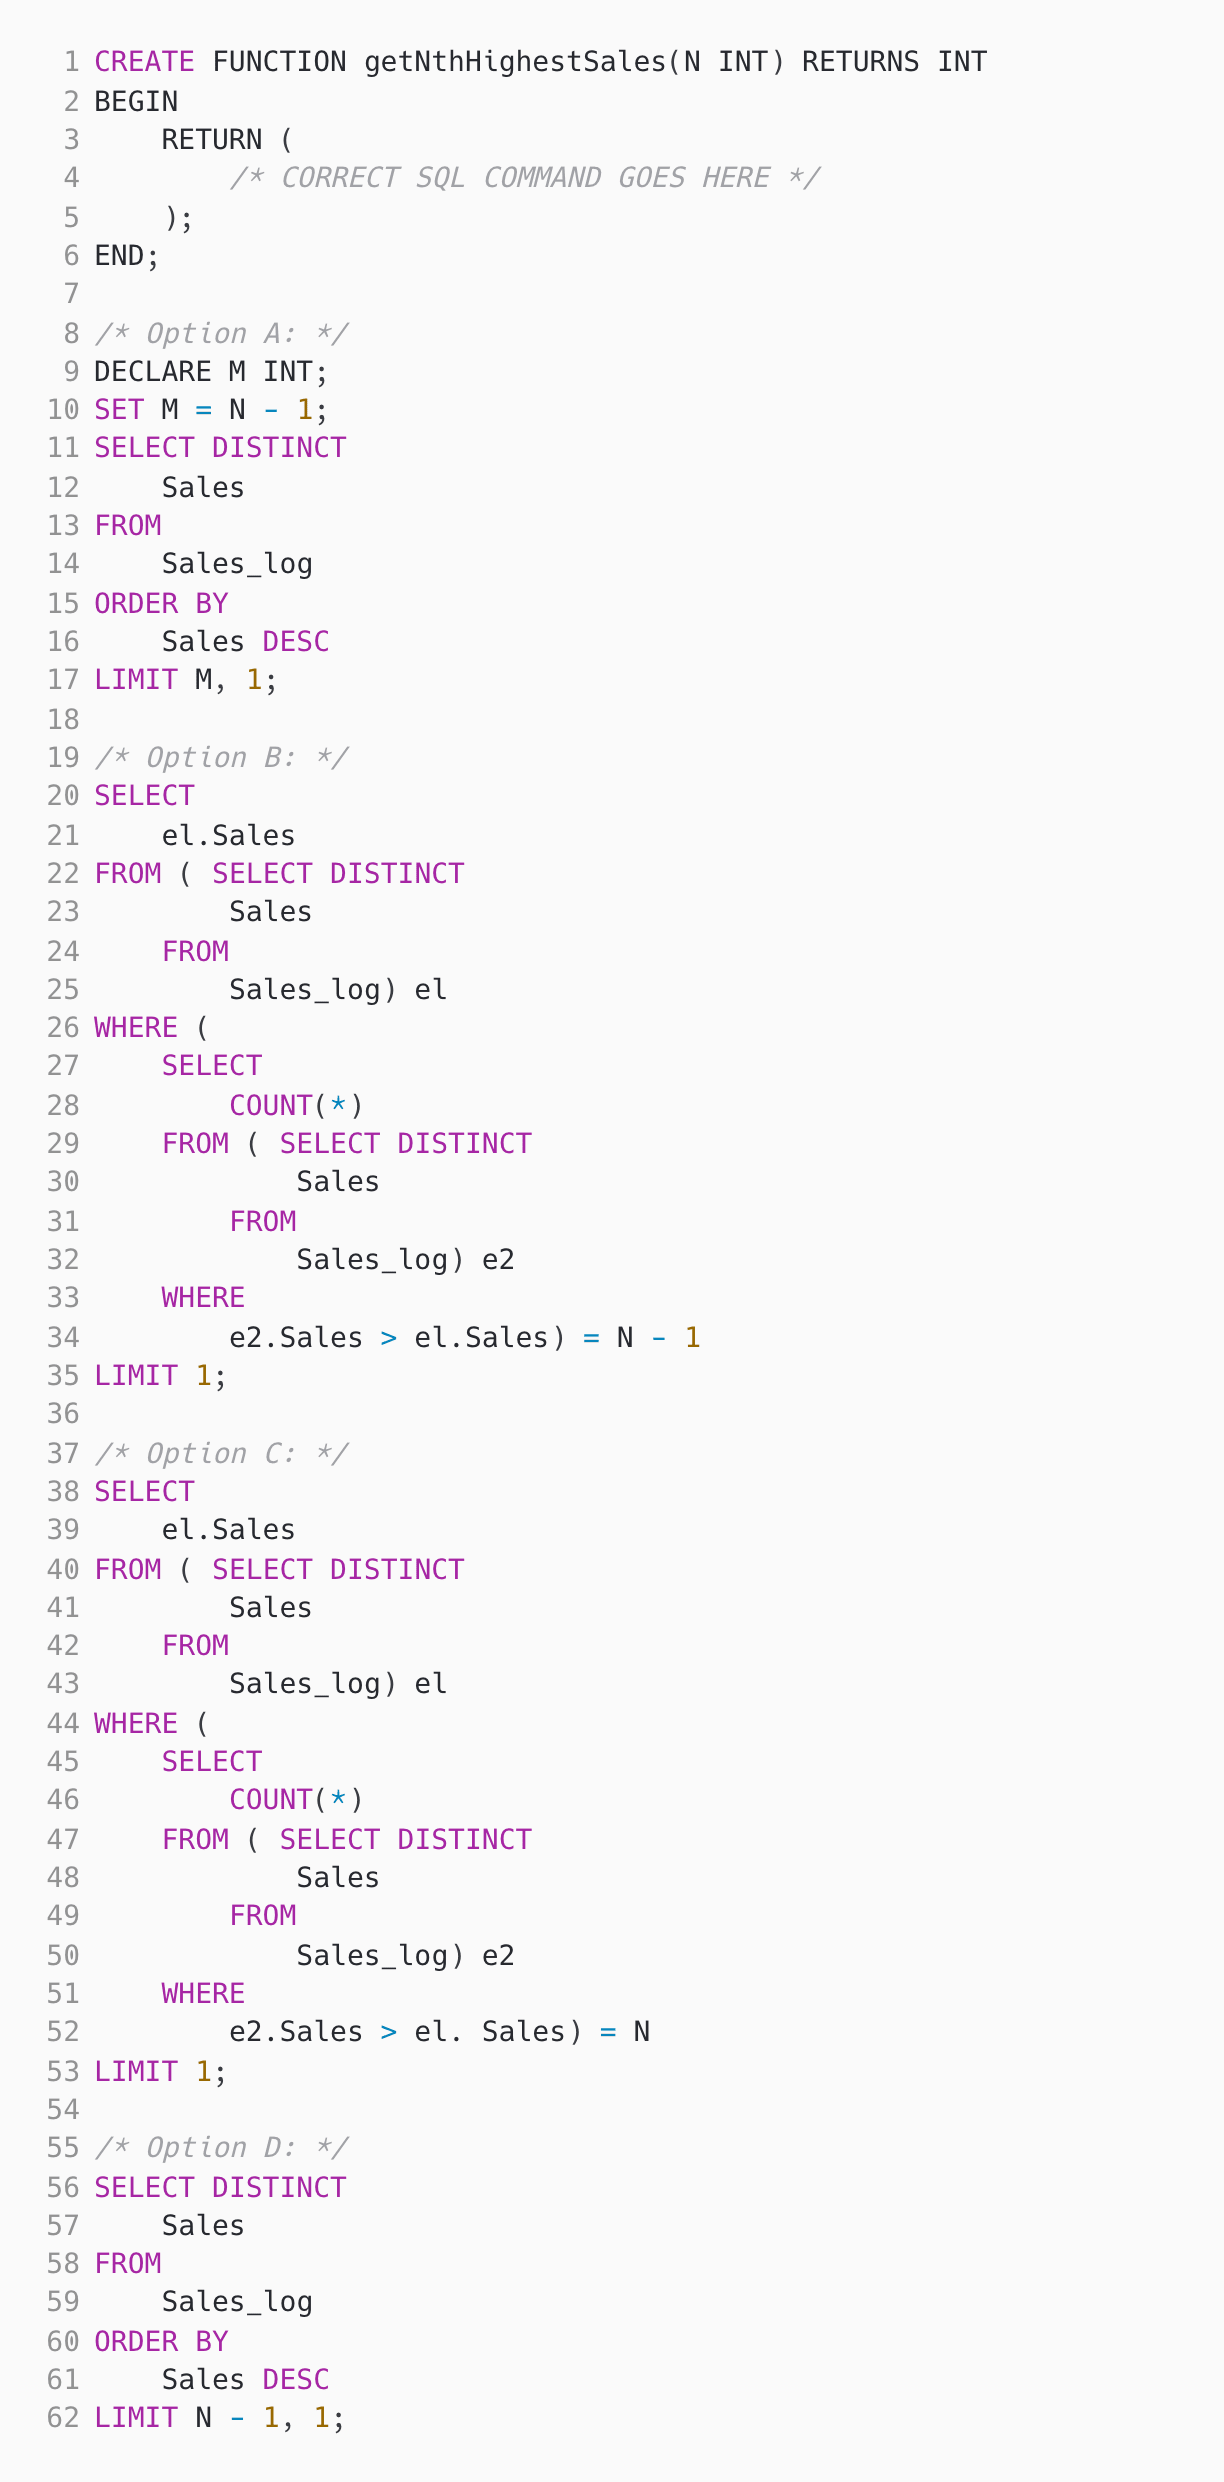
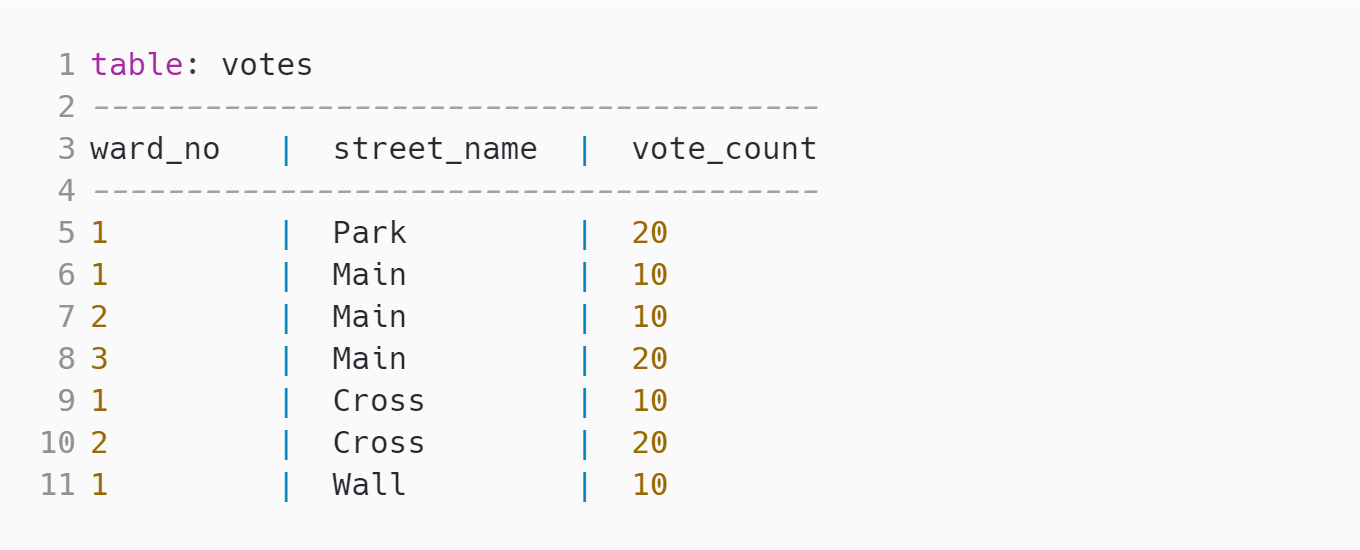
Medium nth highest sales | Solve | ||||
Medium Select & IN | Solve | ||||
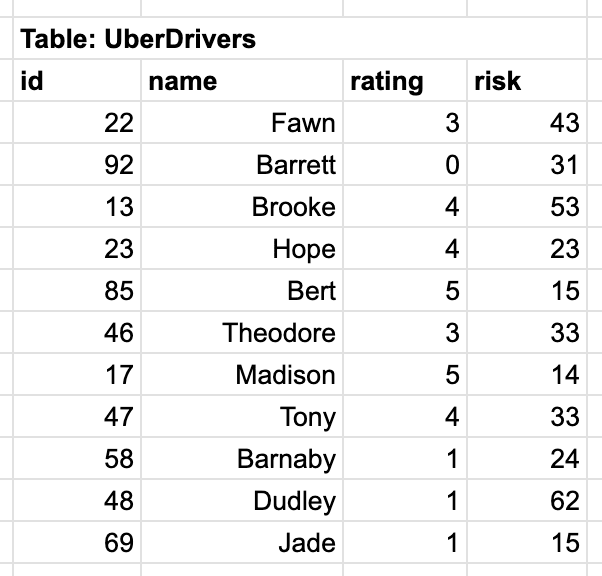
Medium Sorting Ubers | Solve | ||||
Hard With, AVG & SUM | Solve | ||||
Easy Registration Queue | Solve | ||||
Medium Visitors Count | Solve | ||||
| 🧐 Question | 🔧 Skill | ||
|---|---|---|---|
Medium Data Filtering | 2 mins Power BI | Solve | |
Medium Many-to-one error | 2 mins Power BI | Solve | |
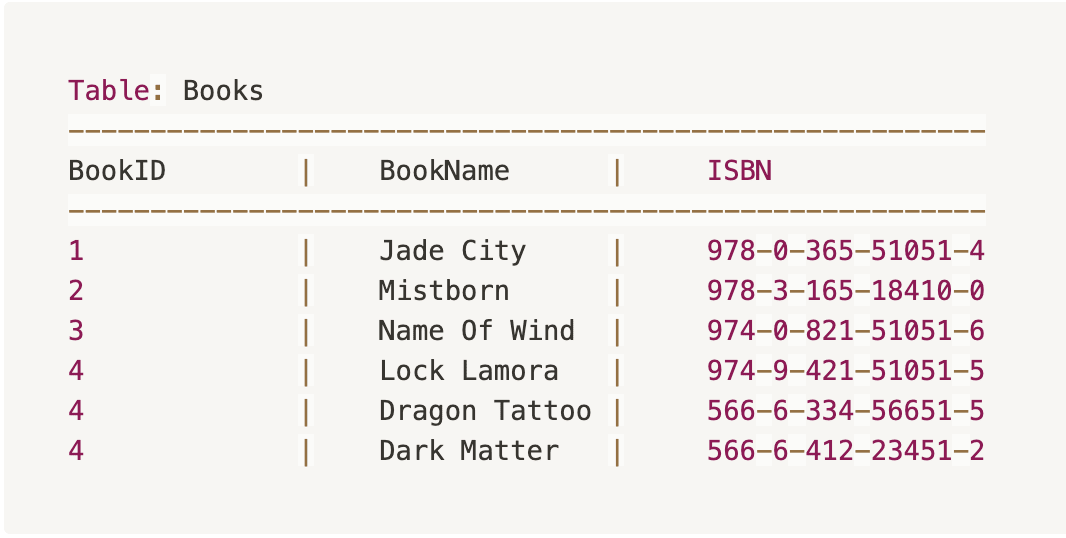
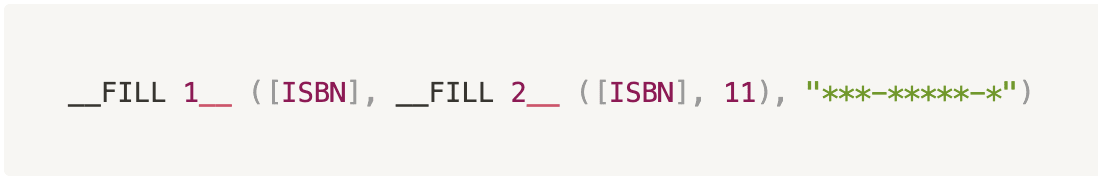
Medium Power Query Functions | 2 mins Power BI | Solve | |
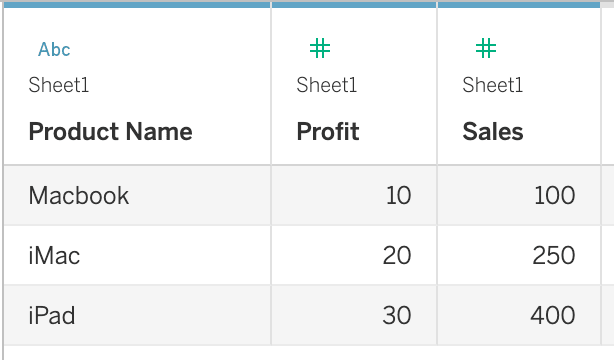
Medium Calculated Properties | 3 mins Tableau | Solve | |
Medium Change display icon | 2 mins Tableau | Solve | |
Easy Pie Chart | 3 mins Tableau | Solve | |
Medium Applying Functions | 3 mins R | Solve | |
Medium Dataframe Transform | 3 mins R | Solve | |
Medium Matrix Manipulation | 3 mins R | Solve | |
Medium ZeroDivisionError and IndexError | 2 mins Python | Solve | |
Medium Session | 2 mins Python | Solve | |
Medium Max Code | 2 mins Python | Solve | |
Medium Recursive Function | 3 mins Python | Solve | |
Medium Stacking problem | 4 mins Python | Solve | |
Medium Multi Select | 2 mins SQL | Solve | |
Medium nth highest sales | 3 mins SQL | Solve | |
Medium Select & IN | 3 mins SQL | Solve | |
Medium Sorting Ubers | 3 mins SQL | Solve | |
Hard With, AVG & SUM | 2 mins SQL | Solve | |
Easy Registration Queue | 30 mins Coding | Solve | |
Medium Visitors Count | 30 mins Coding | Solve |
| 🧐 Question | 🔧 Skill | 💪 Difficulty | ⌛ Time | ||
|---|---|---|---|---|---|
Data Filtering | Power BI | Medium | 2 mins | Solve | |
Many-to-one error | Power BI | Medium | 2 mins | Solve | |
Power Query Functions | Power BI | Medium | 2 mins | Solve | |
Calculated Properties | Tableau | Medium | 3 mins | Solve | |
Change display icon | Tableau | Medium | 2 mins | Solve | |
Pie Chart | Tableau | Easy | 3 mins | Solve | |
Applying Functions | R | Medium | 3 mins | Solve | |
Dataframe Transform | R | Medium | 3 mins | Solve | |
Matrix Manipulation | R | Medium | 3 mins | Solve | |
ZeroDivisionError and IndexError | Python | Medium | 2 mins | Solve | |
Session | Python | Medium | 2 mins | Solve | |
Max Code | Python | Medium | 2 mins | Solve | |
Recursive Function | Python | Medium | 3 mins | Solve | |
Stacking problem | Python | Medium | 4 mins | Solve | |
Multi Select | SQL | Medium | 2 mins | Solve | |
nth highest sales | SQL | Medium | 3 mins | Solve | |
Select & IN | SQL | Medium | 3 mins | Solve | |
Sorting Ubers | SQL | Medium | 3 mins | Solve | |
With, AVG & SUM | SQL | Hard | 2 mins | Solve | |
Registration Queue | Coding | Easy | 30 mins | Solve | |
Visitors Count | Coding | Medium | 30 mins | Solve |
Met Adaface konden we ons eerste screeningproces met ruim 75% optimaliseren, waardoor kostbare tijd vrijkwam voor zowel de rekruteringsmanagers als ons talentacquisitieteam!
Brandon Lee, Hoofd Mensen, Love, Bonito
The most important thing while implementing the pre-employment BI -ontwikkelaarstest in your hiring process is that it is an elimination tool, not a selection tool. In other words: you want to use the test to eliminate the candidates who do poorly on the test, not to select the candidates who come out at the top. While they are super valuable, pre-employment tests do not paint the entire picture of a candidate’s abilities, knowledge, and motivations. Multiple easy questions are more predictive of a candidate's ability than fewer hard questions. Harder questions are often "trick" based questions, which do not provide any meaningful signal about the candidate's skillset.
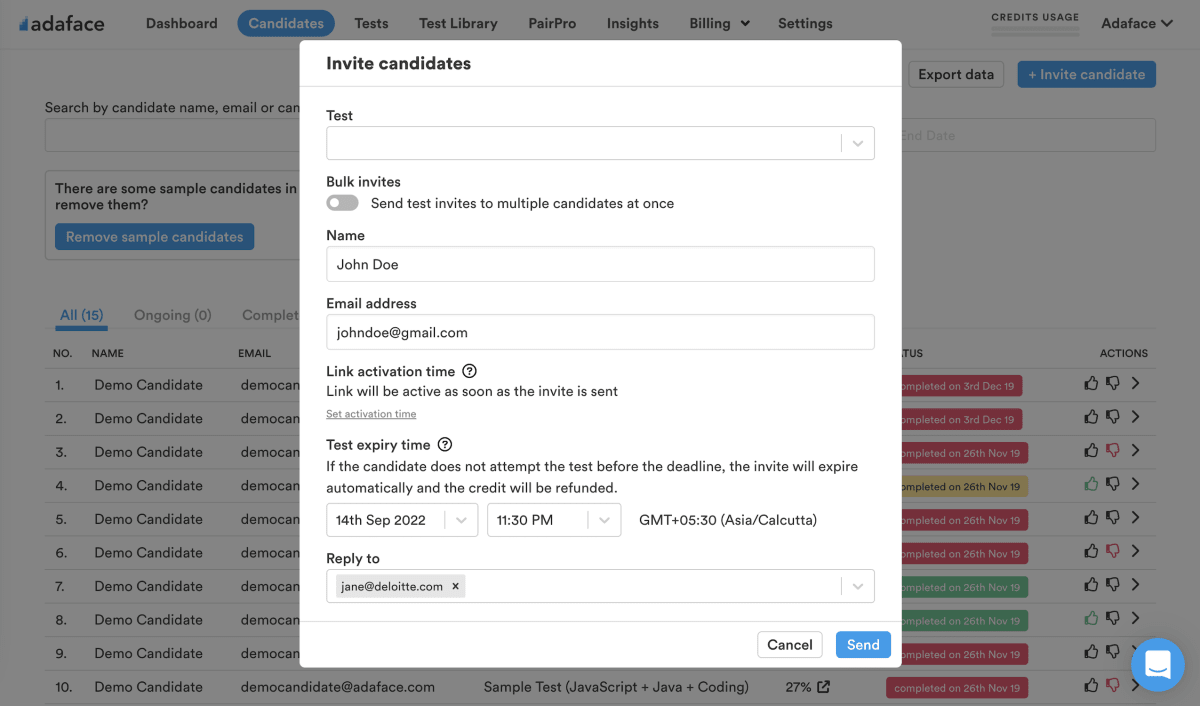
Science behind Adaface testsEmail invites: You can send candidates an email invite to the BI -ontwikkelaarstest from your dashboard by entering their email address.
Public link: You can create a public link for each test that you can share with candidates.
API or integrations: You can invite candidates directly from your ATS by using our pre-built integrations with popular ATS systems or building a custom integration with your in-house ATS.
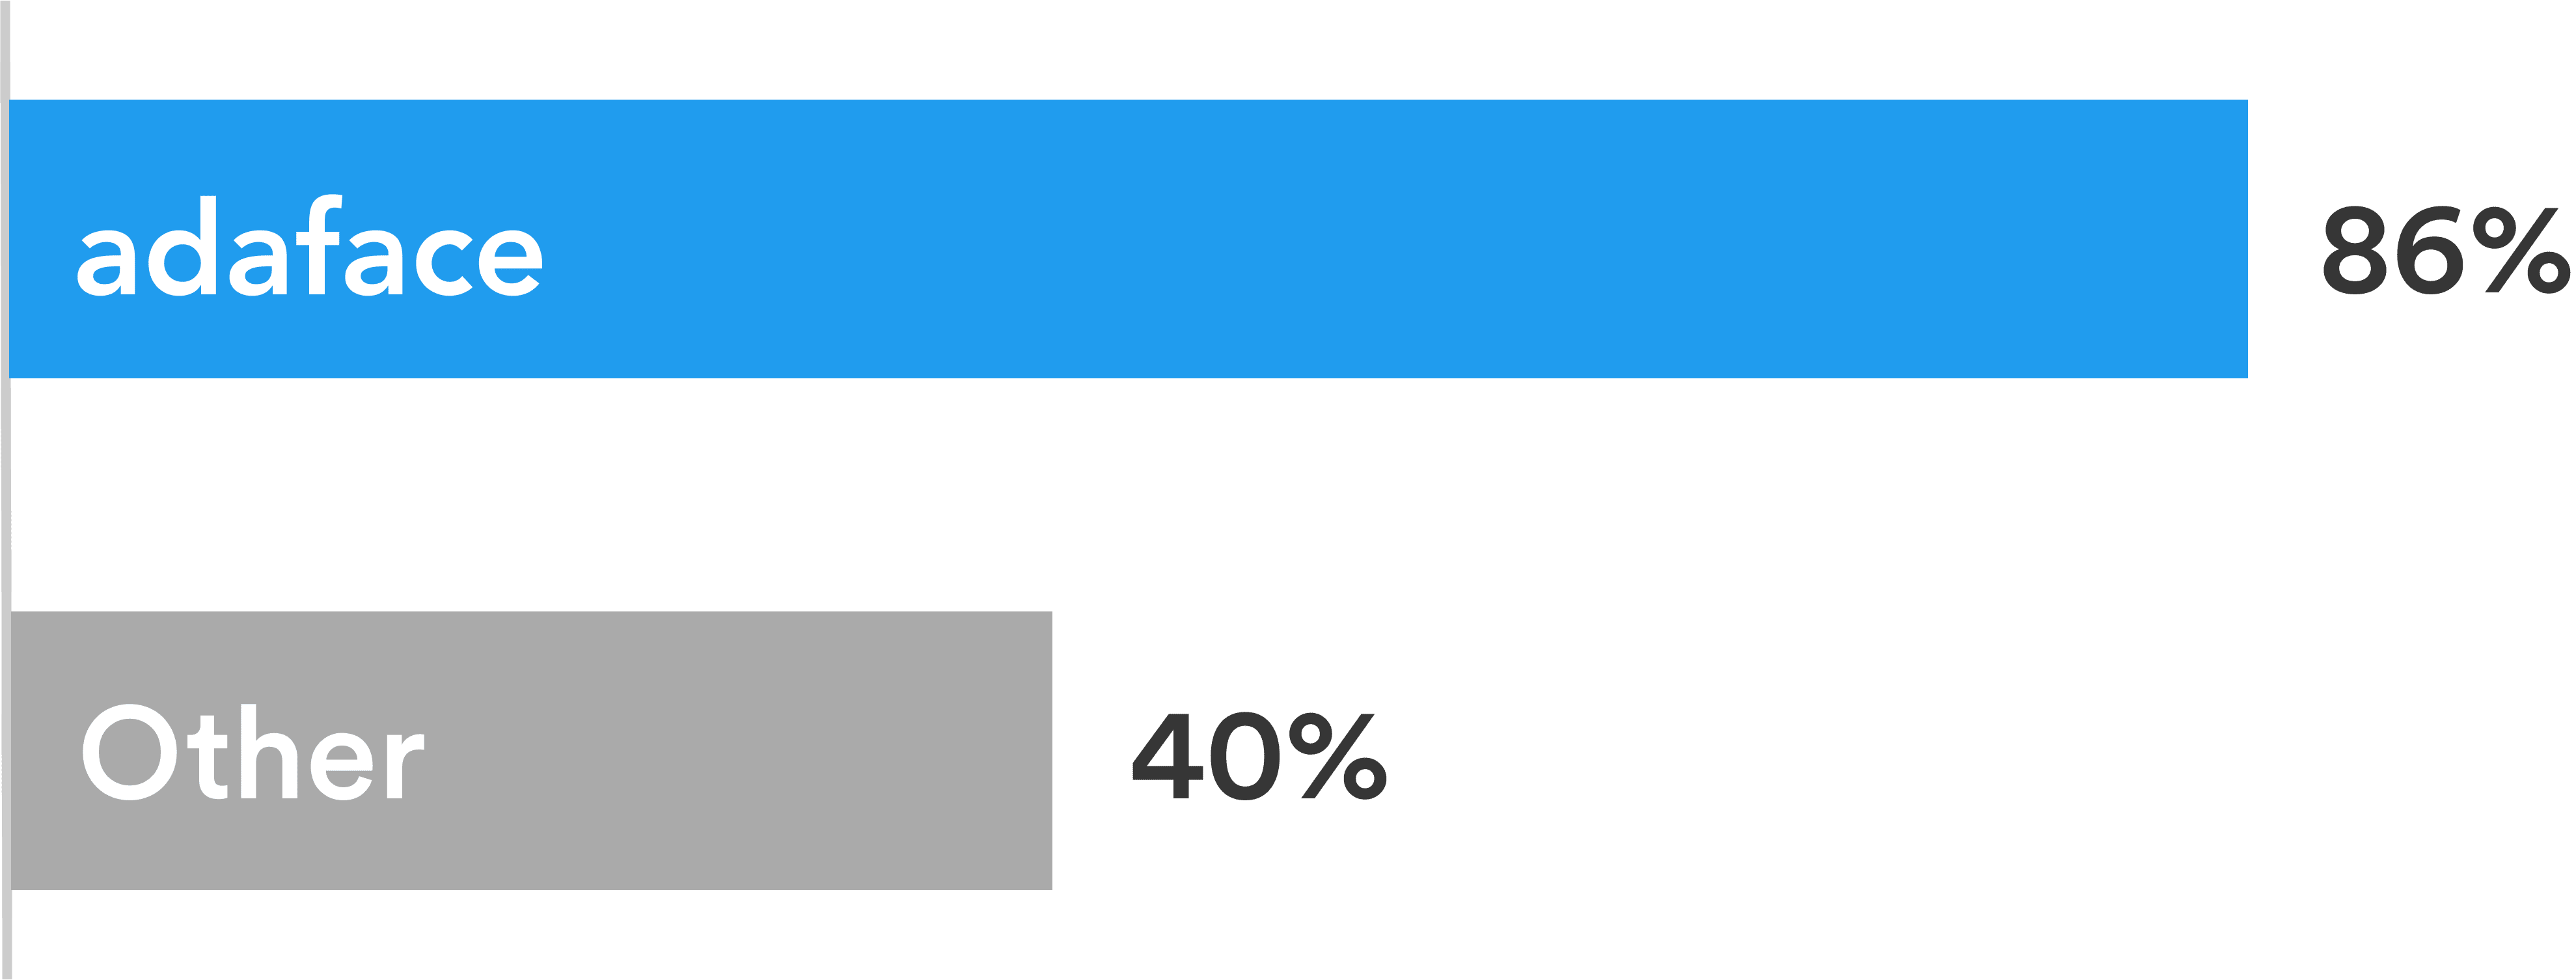
Adaface tests are conversational, low-stress, and take just 25-40 mins to complete.
This is why Adaface has the highest test-completion rate (86%), which is more than 2x better than traditional assessments.
ChatGPT protection
Screen proctoring
Plagiarism detection
Non-googleable questions
User authentication
IP proctoring
Web proctoring
Webcam proctoring
Full screen proctoring
Copy paste protection
De rekruteringsmanagers waren van mening dat ze door de technische vragen die ze tijdens de panelgesprekken stelden, konden zien welke kandidaten beter scoorden, en onderscheidden ze zich met degenen die niet zo goed scoorden. Zij zijn zeer tevreden met de kwaliteit van de kandidaten op de shortlist van de Adaface-screening.
Ja absoluut. Aangepaste beoordelingen zijn opgezet op basis van uw functiebeschrijving en bevatten vragen over alle must-have vaardigheden die u opgeeft.
We hebben de volgende anti-cheating-functies op zijn plaats:
Lees meer over de Proctoring -functies.
Het belangrijkste om in gedachten te houden is dat een beoordeling een eliminatietool is, geen selectietool. Een vaardighedenbeoordeling is geoptimaliseerd om u te helpen kandidaten te elimineren die niet technisch gekwalificeerd zijn voor de rol, het is niet geoptimaliseerd om u te helpen de beste kandidaat voor de rol te vinden. Dus de ideale manier om een beoordeling te gebruiken is om een drempelscore te bepalen (meestal 55%, wij helpen u benchmark) en alle kandidaten uit te nodigen die boven de drempel scoren voor de volgende interviewrondes.
Elke ADAFACE -beoordeling is aangepast aan uw functiebeschrijving/ ideale kandidaatpersonage (onze experts van het onderwerp zullen de juiste vragen kiezen voor uw beoordeling uit onze bibliotheek van 10000+ vragen). Deze beoordeling kan worden aangepast voor elk ervaringsniveau.
Ja, het maakt het veel gemakkelijker voor u om kandidaten te vergelijken. Opties voor MCQ -vragen en de volgorde van vragen worden gerandomiseerd. We hebben anti-cheating/proctoring functies. In ons bedrijfsplan hebben we ook de optie om meerdere versies van dezelfde beoordeling te maken met vragen over vergelijkbare moeilijkheidsniveaus.
Nee. Helaas ondersteunen we op dit moment geen oefentests. U kunt echter onze voorbeeldvragen gebruiken voor praktijk.
U kunt onze [prijsplannen] bekijken (https://www.adaface.com/pricing/).
Ja, u kunt gratis aanmelden en een voorbeeld van deze test.
Hier is een korte handleiding over hoe een aangepaste beoordeling aanvragen op Adaface.