Search test library by skills or roles
⌘ K

About the test:

De data -analyse in Excel -test evalueert het vermogen van een kandidaat om Excel te gebruiken voor gegevensanalyse en interpretatie. Het behandelt onderwerpen zoals gegevensmanipulatie, functies, formules, grafieken en datavisualisatie met behulp van Excel. De test bevat ook scenario-gebaseerde meerkeuzevragen om probleemoplossende vaardigheden en kritisch denken in een zakelijke context te beoordelen.

Covered skills:

  • Data interpretatie
  • Grafieken en grafieken in Excel
  • Rapporten maken en delen
  • Excel -functies
  • Gegevensanalyse Fundamentals

9 reasons why
9 reasons why

Adaface Data Analytics in Excel Assessment Test is the most accurate way to shortlist Data -analists


Reason #1

Tests for on-the-job skills

The Data Analytics in Excel Test helps recruiters and hiring managers identify qualified candidates from a pool of resumes, and helps in taking objective hiring decisions. It reduces the administrative overhead of interviewing too many candidates and saves time by filtering out unqualified candidates at the first step of the hiring process.

The test screens for the following skills that hiring managers look for in candidates:

  • Analyseer en interpreteer complexe gegevenssets efficiënt en interpreteer
  • Pas geavanceerde Excel -functies toe om gegevensanalyse uit te voeren
  • Maak visueel aantrekkelijke grafieken en grafieken om gegevens te presenteren
  • Toont vaardigheid in fundamentele data -analysetechnieken
  • Genereer nauwkeurige en informatieve rapporten met behulp van Excel
  • Deel en communiceren effectief bevindingen uit gegevensanalyse
  • Gebruik Excel -formules en functies om gegevens te manipuleren en te transformeren
  • Pas statistische analysemethoden toe om zinvolle inzichten te maken
  • Voer gegevensreiniging en voorbewerkingstaken uit in Excel
  • Interpreteer trends en patronen in gegevens voor besluitvorming
Reason #2

No trick questions

no trick questions

Traditional assessment tools use trick questions and puzzles for the screening, which creates a lot of frustration among candidates about having to go through irrelevant screening assessments.

View sample questions

The main reason we started Adaface is that traditional pre-employment assessment platforms are not a fair way for companies to evaluate candidates. At Adaface, our mission is to help companies find great candidates by assessing on-the-job skills required for a role.

Why we started Adaface
Reason #3

Non-googleable questions

We have a very high focus on the quality of questions that test for on-the-job skills. Every question is non-googleable and we have a very high bar for the level of subject matter experts we onboard to create these questions. We have crawlers to check if any of the questions are leaked online. If/ when a question gets leaked, we get an alert. We change the question for you & let you know.

How we design questions

Dit zijn slechts een klein monster uit onze bibliotheek met meer dan 10.000 vragen. De werkelijke vragen hierover Data -analyse in Excel -test zal niet-googelbaar zijn.

🧐 Question

Medium

MATCH INDEX LOOKUP
Solve
Some friends live in adjacent apartments in a building in Central Perk, New York. We want to write a function to search the apartment number by name. Which of the following functions should we use?
 image

Medium

Organization data
Data transformation
Solve
We have two Excel files with organization data. One file has Organization ID and Organization Name fields, whereas the second file has Organization ID, Organization Name and Country fields. We wrote a query to retrieve the data from both files. Here’s a sample of the data retrieved:
 image
We want to ensure Organization ID field is unique. Which of the following is the ideal solution that ensures Organization ID field is unique while retaining Country data?

A: Select the Organization ID and Country columns, and then click Keep Duplicates.
B: Select the Organization ID and Country columns, and then click Remove Duplicates.
C: Use Group BY function to group the rows by Organization ID. Specify output columns for Organization Name and Country using MAX operation.
D: Select Organization ID column and then click Remove Duplicates. Then specify output columns for Country using MAX operation.

Medium

Student scores
Data formatting
Solve
Here’s a sample Excel data source:
 image
Here’s the expected data format: 
 image
Which of the following is the correct way to transform the data from the query editor to achieve the result?

A: Columns to Select: Student Only
B: Columns to Select: Student and Student ID
C: Columns to Select: Primary and Secondary
D: Command to Use: Pivot Column
E: Command to Use: Reverse Rows
F: Command to Use: Unpivot Columns

Medium

VLOOKUP blood donor
Solve
We are looking to find the contact number of the only blood donor with blood group O-. Which function should we use to look up the correct contact number? Here's the documentation for VLOOKUP: =VLOOKUP(lookup value, range containing the lookup value, the column number in the range containing the return value, Approximate match (TRUE) or Exact match (FALSE)).
 image
A: =VLOOKUP("O-", A1:E10, 3, TRUE)
B: =VLOOKUP("O-", A1:E10, 3, FALSE)
C: =VLOOKUP("O-", D1:D10, 4)
D: =VLOOKUP("O-", D1:D10, 3)
E: =VLOOKUP("O-", A1:E10, 4, TRUE)
F: =VLOOKUP("O-", A1:E10, 4, FALSE)
G: =VLOOKUP("Kane", A1:E10, 4)

Medium

Hiring Developer
Skewed Data
Graph
Solve
Two companies A and B hired developers from the year 2001 to 2005. The given bar graph shows the hiring details. 
 image
 image
Now select the statements that are true based on the given details.

A: The data given for Company A is skewed to the left.
B: The data given for Company B is skewed to the right.
C: The data given for Company A is skewed to the right.
D: For Company B, mean and mode are equal.
E: For Company B, mean is equal to median but less than mode.
F: For Company A, median is less than mode but greater than mean.

Medium

Negative correlation
Solve
Saffi, one of the popular schools in San Francisco did a school wide study of the students in middle school. The study found that there is a negative correlation between the time spent on Facebook per day by students and their academic achievement. How can we understand the results of this study?
A: An increase in time spent on Facebook per day causes a drop in the academic achievement of students at the middle school level.

B: There is an association between an increase in time spent on Facebook per day and the drop in the academic achievement of students at Saffi. 

C: An increase in the time spent on Facebook per day causes a drop in the academic achievement of students at Saffi. 

D: There is an association between an increase in time spent on Facebook per day and the drop in the academic achievement of students at the middle school level.
🧐 Question🔧 Skill

Medium

MATCH INDEX LOOKUP

2 mins

Excel
Solve

Medium

Organization data
Data transformation

3 mins

Excel
Solve

Medium

Student scores
Data formatting

2 mins

Excel
Solve

Medium

VLOOKUP blood donor

2 mins

Excel
Solve

Medium

Hiring Developer
Skewed Data
Graph

3 mins

Data Analysis
Solve

Medium

Negative correlation

2 mins

Data Analysis
Solve
🧐 Question🔧 Skill💪 Difficulty⌛ Time
MATCH INDEX LOOKUP
Excel
Medium2 mins
Solve
Organization data
Data transformation
Excel
Medium3 mins
Solve
Student scores
Data formatting
Excel
Medium2 mins
Solve
VLOOKUP blood donor
Excel
Medium2 mins
Solve
Hiring Developer
Skewed Data
Graph
Data Analysis
Medium3 mins
Solve
Negative correlation
Data Analysis
Medium2 mins
Solve
Reason #4

1200+ customers in 75 countries

customers in 75 countries
Brandon

Met Adaface konden we ons eerste screeningproces met ruim 75% optimaliseren, waardoor kostbare tijd vrijkwam voor zowel de rekruteringsmanagers als ons talentacquisitieteam!


Brandon Lee, Hoofd Mensen, Love, Bonito

Reason #5

Designed for elimination, not selection

The most important thing while implementing the pre-employment Data -analyse in Excel -test in your hiring process is that it is an elimination tool, not a selection tool. In other words: you want to use the test to eliminate the candidates who do poorly on the test, not to select the candidates who come out at the top. While they are super valuable, pre-employment tests do not paint the entire picture of a candidate’s abilities, knowledge, and motivations. Multiple easy questions are more predictive of a candidate's ability than fewer hard questions. Harder questions are often "trick" based questions, which do not provide any meaningful signal about the candidate's skillset.

Science behind Adaface tests
Reason #6

1 click candidate invites

Email invites: You can send candidates an email invite to the Data -analyse in Excel -test from your dashboard by entering their email address.

Public link: You can create a public link for each test that you can share with candidates.

API or integrations: You can invite candidates directly from your ATS by using our pre-built integrations with popular ATS systems or building a custom integration with your in-house ATS.

invite candidates
Reason #7

Detailed scorecards & benchmarks

Bekijk Sample Scorecard
Reason #8

High completion rate

Adaface tests are conversational, low-stress, and take just 25-40 mins to complete.

This is why Adaface has the highest test-completion rate (86%), which is more than 2x better than traditional assessments.

test completion rate
Reason #9

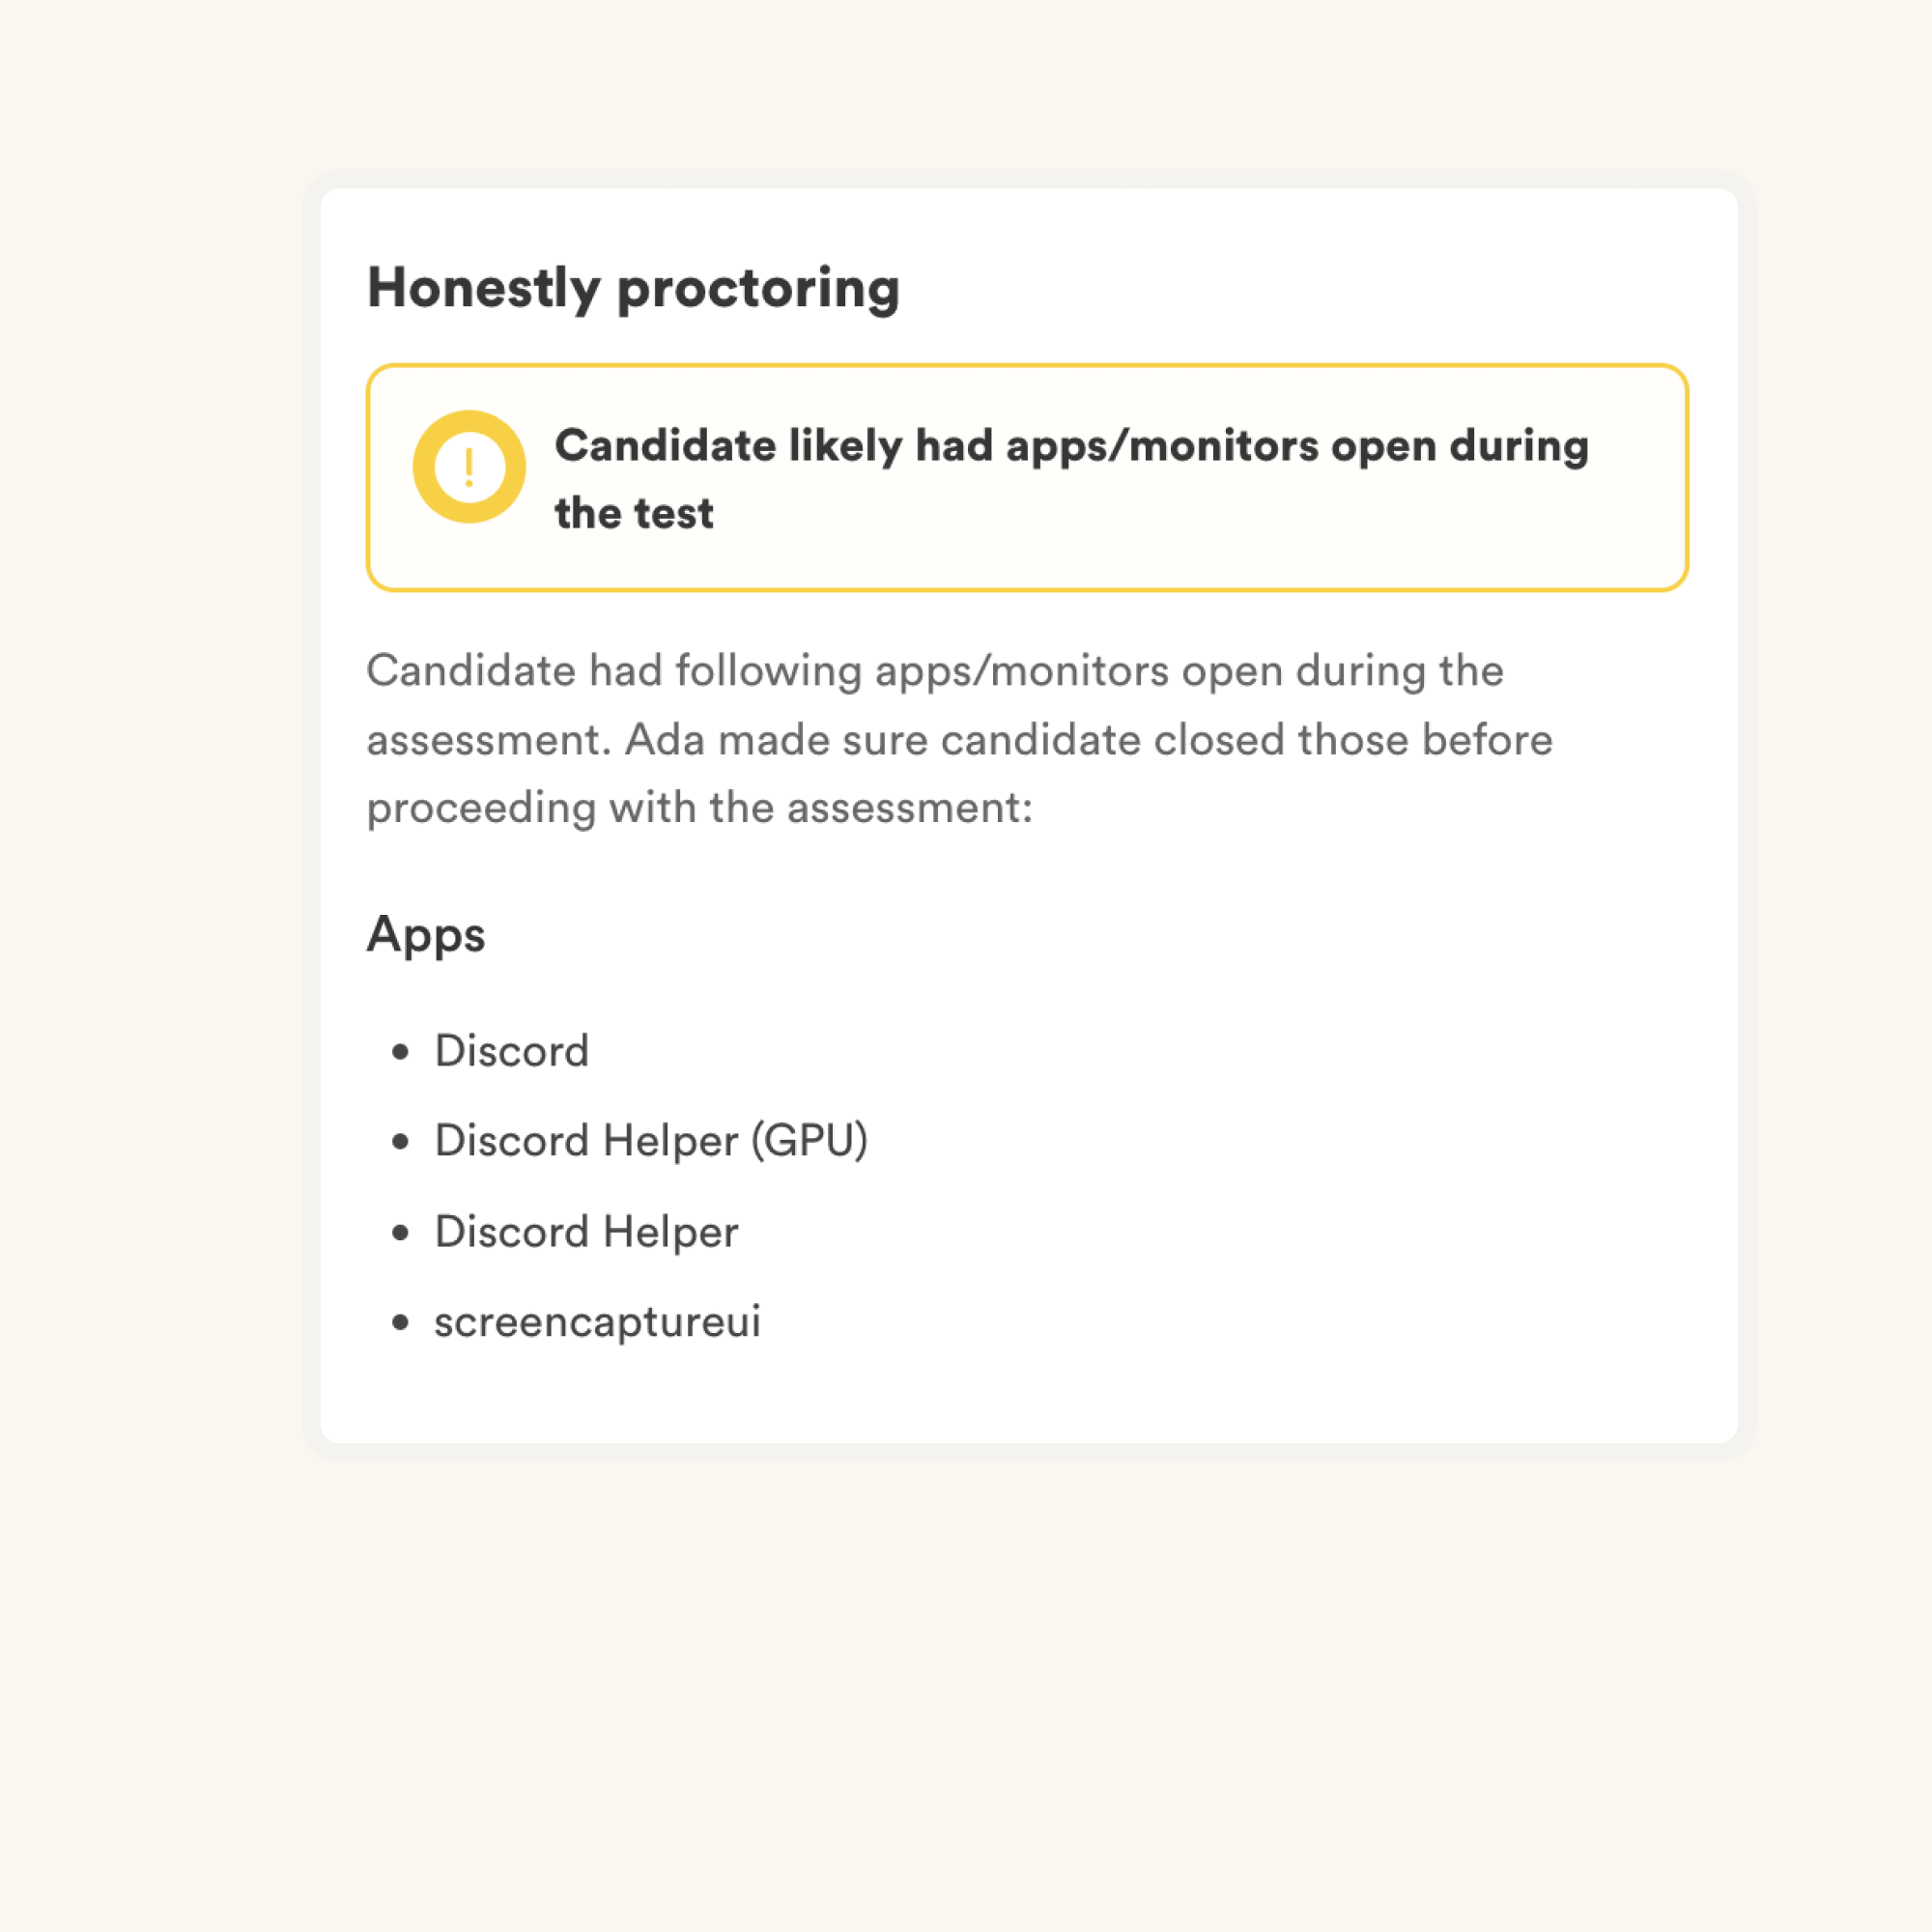
Advanced Proctoring


Learn more

About the Data Analytics in Excel Online Test

Why you should use Pre-employment Data Analytics in Excel Test?

The Data -analyse in Excel -test makes use of scenario-based questions to test for on-the-job skills as opposed to theoretical knowledge, ensuring that candidates who do well on this screening test have the relavant skills. The questions are designed to covered following on-the-job aspects:

  • Toont vaardigheid bij het gebruik van Excel -functies voor gegevensanalyse
  • Creëer en formaat grafieken en grafieken in Excel om gegevens visueel weer te geven
  • Interpreteer gegevens om trends, patronen en inzichten te identificeren
  • Gegevensanalyse fundamentals toepassen om bedrijfsproblemen op te lossen
  • Gebruik geavanceerde Excel -functies voor gegevensmanipulatie en reiniging
  • Toon expertise aan bij het maken en delen van rapporten in Excel
  • Gebruik gegevensvisualisatietechnieken om bevindingen effectief te communiceren
  • Voer geavanceerde gegevensberekeningen uit met behulp van Excel -formules en functies
  • Pas statistische analysemethoden toe om gegevens nauwkeurig te interpreteren
  • Toont vaardigheid in het gebruik van pivottabellen voor gegevensanalyse

Once the test is sent to a candidate, the candidate receives a link in email to take the test. For each candidate, you will receive a detailed report with skills breakdown and benchmarks to shortlist the top candidates from your pool.

What topics are covered in the Data Analytics in Excel Test?

  • Excel-functies:

    Excel-functies verwijzen naar een breed bereik van ingebouwde formules waarmee gebruikers complexe berekeningen kunnen uitvoeren, gegevens kunnen manipuleren en transformeren. Het begrijpen en beoordelen van deze vaardigheid is belangrijk, omdat het het vermogen van een kandidaat aantoont om de functionaliteit van Excel voor gegevensanalyse en probleemoplossing effectief te gebruiken. In Excel helpt om gegevens visueel weer te geven, waardoor het gemakkelijker wordt om patronen, trends en relaties te begrijpen en te analyseren. Het testen van deze vaardigheid zorgt ervoor dat kandidaten de mogelijkheid hebben om gegevens op een visueel aantrekkelijke en informatieve manier te presenteren.

  • Gegevensanalyse Fundamentals:

    Gegevensanalyse Fundamentals omvatten verschillende technieken en methodologieën die worden gebruikt om te interpreteren en Teken zinvolle conclusies uit gegevens. Het beoordelen van deze vaardigheid is belangrijk omdat het het begrip van een kandidaat aantoont van kerngegevensanalysetechnieken, zoals het samenvatten, organiseren en visualiseren omvat het verzamelen van gegevens, het genereren van zinvolle inzichten en het op een uitgebreide manier presenteren. Het evalueren van deze vaardigheid is cruciaal omdat het het vermogen van een kandidaat laat zien om bevindingen effectief en efficiënt te communiceren, waardoor geïnformeerde besluitvorming mogelijk is op basis van gegevensgestuurde inzichten.

  • Full list of covered topics

    The actual topics of the questions in the final test will depend on your job description and requirements. However, here's a list of topics you can expect the questions for Data -analyse in Excel -test to be based on.

    Gegevensvalidatie
    Conditionele opmaak
    Draaitabellen
    Vlookup -functie
    Hlookup -functie
    Sumifs -functie
    COUNTIFS -functie
    Formules en functies
    Grafiektypen
    Trendanalyse
    Slicers
    Gegevens sorteren
    Gegevensfiltering
    Power query
    Statistische functies
    Histogrammen
    Histogram -analyse
    Regressie analyse
    Data visualisatie
    Gegevensoverzicht
    Data interpretatie
    Scenario analyse
    Data manipulatie
    Gegevensopmaak
    Gegevensaggregatie
    Datamodellering
    Data presentatie
    Het delen van gegevens
    Rapportgeneratie
    Rapportopmaak

What roles can I use the Data Analytics in Excel Test for?

  • Data -analist
  • Bedrijfsanalist
  • Financieel analist
  • Business Intelligence Analyst
  • Data scientist
  • Data Engineer
  • Data Architect
  • Bedrijfsadviseur
  • Financieel adviseur
  • Marktonderzoeksanalist

How is the Data Analytics in Excel Test customized for senior candidates?

For intermediate/ experienced candidates, we customize the assessment questions to include advanced topics and increase the difficulty level of the questions. This might include adding questions on topics like

  • Gebruik geavanceerde Excel -functies voor automatisering en efficiëntie
  • Gebruik effectief de gegevensvalidatie van Excel en voorwaardelijke opmaakfuncties
  • Pas gegevensfilteringstechnieken toe om relevante informatie te extraheren
  • Toon begrip van gegevensreiniging en gegevenstransformatieprocessen
  • Gebruik Excel's datamodelleringsmogelijkheden om complexe datasets te analyseren
  • Demonstreer expertise in het gebruik van opzoekfuncties voor gegevensanalyse
  • Pas statistische functies toe in Excel om zinvolle inzichten af ​​te leiden
  • Gebruik Excel's regressieanalysemogelijkheden voor gegevensmodellering
  • Toon vaardigheid aan bij het gebruik van Excel's What-IF-analysetools
  • Pas geavanceerde datavisualisatietechnieken toe met behulp van Excel
Singapore government logo

De rekruteringsmanagers waren van mening dat ze door de technische vragen die ze tijdens de panelgesprekken stelden, konden zien welke kandidaten beter scoorden, en onderscheidden ze zich met degenen die niet zo goed scoorden. Zij zijn zeer tevreden met de kwaliteit van de kandidaten op de shortlist van de Adaface-screening.


85%
Vermindering van de screeningstijd

Data Analytics in Excel Hiring Test Veelgestelde vragen

Kan ik meerdere vaardigheden combineren in één aangepaste beoordeling?

Ja absoluut. Aangepaste beoordelingen zijn opgezet op basis van uw functiebeschrijving en bevatten vragen over alle must-have vaardigheden die u opgeeft.

Heeft u functies tegen latere of proctoring op hun plaats?

We hebben de volgende anti-cheating-functies op zijn plaats:

  • Niet-googelbare vragen
  • IP Proctoring
  • Web Proctoring
  • Webcam Proctoring
  • Plagiaatdetectie
  • Beveilig browser

Lees meer over de Proctoring -functies.

Hoe interpreteer ik testscores?

Het belangrijkste om in gedachten te houden is dat een beoordeling een eliminatietool is, geen selectietool. Een vaardighedenbeoordeling is geoptimaliseerd om u te helpen kandidaten te elimineren die niet technisch gekwalificeerd zijn voor de rol, het is niet geoptimaliseerd om u te helpen de beste kandidaat voor de rol te vinden. Dus de ideale manier om een ​​beoordeling te gebruiken is om een ​​drempelscore te bepalen (meestal 55%, wij helpen u benchmark) en alle kandidaten uit te nodigen die boven de drempel scoren voor de volgende interviewrondes.

Voor welk ervaringsniveau kan ik deze test gebruiken?

Elke ADAFACE -beoordeling is aangepast aan uw functiebeschrijving/ ideale kandidaatpersonage (onze experts van het onderwerp zullen de juiste vragen kiezen voor uw beoordeling uit onze bibliotheek van 10000+ vragen). Deze beoordeling kan worden aangepast voor elk ervaringsniveau.

Krijgt elke kandidaat dezelfde vragen?

Ja, het maakt het veel gemakkelijker voor u om kandidaten te vergelijken. Opties voor MCQ -vragen en de volgorde van vragen worden gerandomiseerd. We hebben anti-cheating/proctoring functies. In ons bedrijfsplan hebben we ook de optie om meerdere versies van dezelfde beoordeling te maken met vragen over vergelijkbare moeilijkheidsniveaus.

Ik ben een kandidaat. Kan ik een oefentest proberen?

Nee. Helaas ondersteunen we op dit moment geen oefentests. U kunt echter onze voorbeeldvragen gebruiken voor praktijk.

Wat zijn de kosten van het gebruik van deze test?

U kunt onze [prijsplannen] bekijken (https://www.adaface.com/pricing/).

Kan ik een gratis proefperiode krijgen?

Ja, u kunt gratis aanmelden en een voorbeeld van deze test.

Ik ben net naar een betaald plan verhuisd. Hoe kan ik een aangepaste beoordeling aanvragen?

Hier is een korte handleiding over hoe een aangepaste beoordeling aanvragen op Adaface.

customers across world
Join 1200+ companies in 75+ countries.
Probeer vandaag de meest kandidaatvriendelijke vaardighedenbeoordelingstool.
g2 badges
Ready to use the Adaface Data -analyse in Excel -test?
ada
Ada
● Online
Previous
Score: NA
Next
✖️