
Adaface Sample Tableau Questions
Here are some sample Tableau questions from our premium questions library (10273 non-googleable questions).
Skills
Programming Languages
Data Science
Frontend
Backend
Software Engineering Basics
Data Engineering
Cloud Engineering
Test Engineering
Aptitude
Logical Reasoning Abstract Reasoning English Reading Comprehension Spatial Reasoning Verbal Reasoning Diagrammatic Reasoning Critical Thinking Data Interpretation Situational Judgement Attention to Detail Numerical Reasoning Aptitude Quantitative Reasoning Inductive Reasoning Deductive Reasoning Error Checking English Speaking Pronunciation
Accounting
Others
Embedded Systems Agile/Scrum Cyber Security SAP ABAP SAP HANA Salesforce Developer Salesforce Administrator Boomi Dynamics 365 SCM Dynamics 365 Finance Spark Adobe InDesign Oracle Hyperion Planning ITIL Blue Prism SAS SCCM SSAS SSRS Citrix Google AdWords Weblogic Talend UML Human Resource Management Talent Acquisition RPA CISCO French SAP MM SAP Basis SAP WM SAP FICO SharePoint Technical Support Growth Marketing Marketing Analysis Jira German Spanish Grammar & Vocabulary Listening Comprehension Reading Comprehension Sentence Structure Guidewire Meta Ads Branding Strategy
| 🧐 Question | |||||
|---|---|---|---|---|---|
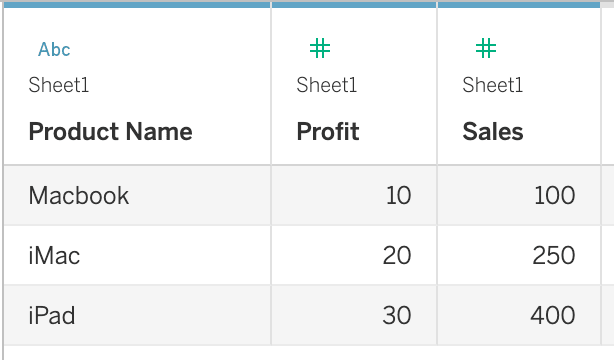
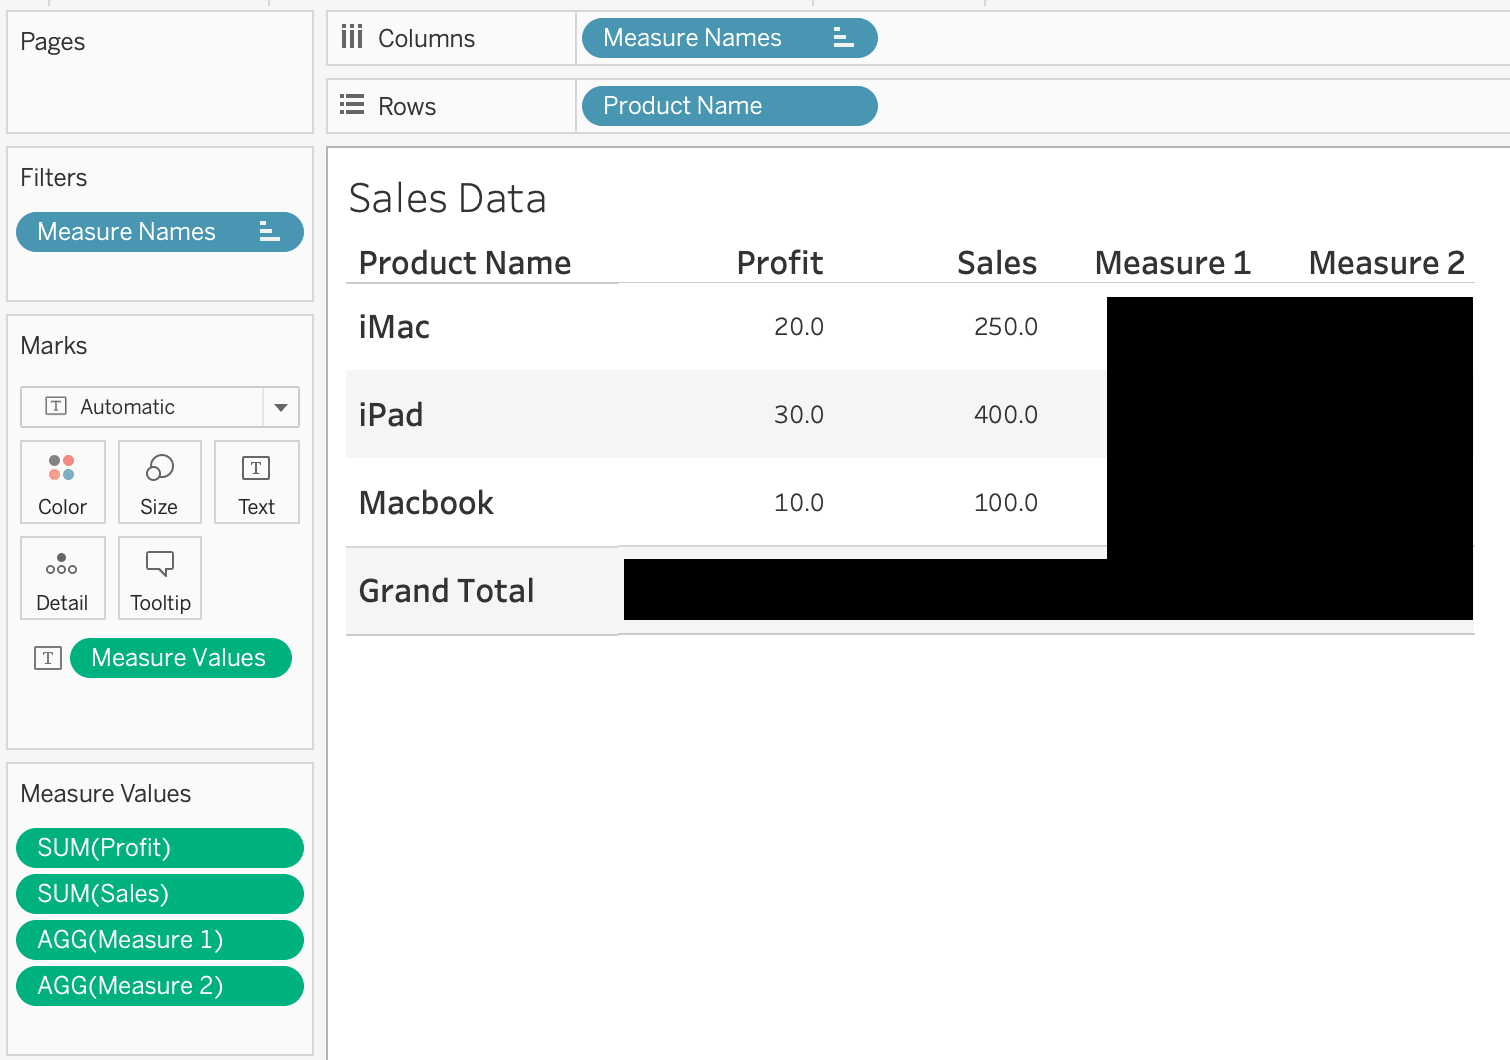
Medium Calculated Properties | Solve | ||||
Medium Change display icon | Solve | ||||
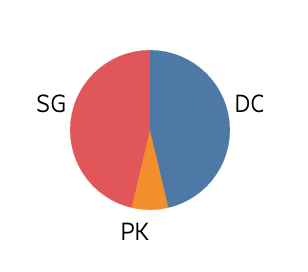
Easy Pie Chart | Solve | ||||

| 🧐 Question | 🔧 Skill | ||
|---|---|---|---|
Medium Calculated Properties | 3 mins Tableau | Solve | |
Medium Change display icon | 2 mins Tableau | Solve | |
Easy Pie Chart | 3 mins Tableau | Solve |
| 🧐 Question | 🔧 Skill | 💪 Difficulty | ⌛ Time | ||
|---|---|---|---|---|---|
Calculated Properties | Tableau | Medium | 3 mins | Solve | |
Change display icon | Tableau | Medium | 2 mins | Solve | |
Pie Chart | Tableau | Easy | 3 mins | Solve |


We evaluated several of their competitors and found Adaface to be the most compelling. Great library of questions that are designed to test for fit rather than memorization of algorithms.
Swayam Narain, CTO, Affable


Join 1200+ companies in 80+ countries.
Try the most candidate friendly skills assessment tool today.

Ready to streamline your recruitment efforts with Adaface?
Ready to streamline your recruitment efforts with Adaface?
40 min tests.
No trick questions.
Accurate shortlisting.
No trick questions.
Accurate shortlisting.