
Basic Power BI interview questions
1. What is Power BI and what is it used for?
2. Can you explain the difference between Power BI Desktop and Power BI Service?
3. What are the different types of data sources that Power BI can connect to?
4. Explain the process of importing data into Power BI.
5. What is a Power BI report and how is it different from a dashboard?
6. What are visuals in Power BI? Give some examples.
7. How do you filter data in Power BI?
8. What is the purpose of the Power BI data model?
9. Explain the concept of relationships between tables in Power BI.
10. What are calculated columns and measures in Power BI? How are they different?
11. What is DAX in Power BI and what is it used for?
12. Give an example of a simple DAX expression.
13. How can you share a Power BI report with others?
14. What are workspaces in Power BI and what is their purpose?
15. How do you refresh data in Power BI?
16. What is Power BI Embedded?
17. Describe the steps to create a simple bar chart in Power BI.
18. What is the role of the Power BI gateway?
19. How can you improve the performance of a Power BI report?
20. What are some best practices for designing Power BI dashboards?
21. What is the difference between a Power BI Pro and a Power BI Premium license?
22. How can you implement row-level security in Power BI?
23. What are parameters in Power BI and how can they be used?
Intermediate Power BI interview questions
1. How would you handle a scenario where a Power BI report is performing slowly, and what steps would you take to identify the bottleneck?
2. Can you describe your experience with using DAX to create calculated columns and measures in Power BI, and provide an example of a complex calculation you've implemented?
3. Explain the difference between calculated columns and measures in Power BI, and when you would use one over the other.
4. How do you optimize a Power BI report for mobile viewing, considering different screen sizes and user interactions?
5. Describe your approach to implementing row-level security (RLS) in Power BI, and what considerations you make when defining roles and filters.
6. What are the different types of data refresh in Power BI, and how do you choose the appropriate refresh type for a given scenario?
7. How would you troubleshoot a Power BI report that is displaying incorrect data, and what steps would you take to identify the source of the error?
8. Can you explain how to use Power Query to transform and clean data from multiple sources before loading it into Power BI?
9. Describe your experience with creating and managing relationships between tables in Power BI, and how you ensure data integrity.
10. How do you use bookmarks and selections in Power BI to create interactive and dynamic reports?
11. Explain your understanding of the Power BI service architecture, including workspaces, datasets, and reports.
12. How do you approach designing a Power BI report to meet the needs of different stakeholders, considering their varying levels of technical expertise?
13. What strategies do you employ to ensure data quality and accuracy in Power BI reports, and how do you validate your results?
14. How do you use drill-through and drill-down features in Power BI to enable users to explore data at different levels of granularity?
15. Describe your experience with using custom visuals in Power BI, and how you would evaluate the suitability of a custom visual for a specific use case.
16. How do you integrate Power BI with other Microsoft products, such as Excel, SharePoint, and Teams?
17. Explain how to use parameters in Power BI to allow users to customize report filters and calculations.
18. How would you handle a situation where a Power BI report needs to be migrated to a different environment, such as from development to production?
19. Describe your experience with using the Power BI REST API to automate tasks and integrate Power BI with other applications.
20. How do you use the performance analyzer in Power BI to identify and resolve performance issues in your reports?
21. Explain how to use incremental refresh in Power BI to optimize the refresh process for large datasets.
22. Describe your experience with using the Power BI mobile app to view and interact with reports on mobile devices.
23. How do you use the Q&A feature in Power BI to allow users to ask questions about their data in natural language?
24. Explain how to use the AI visuals in Power BI, such as key influencers and decomposition tree, to gain insights from your data.
25. How do you use the Power BI dataflows to create reusable data preparation and transformation processes?
26. How do you monitor and maintain Power BI reports and dashboards to ensure they are performing optimally and meeting user needs?
27. What are some best practices for designing Power BI reports that are accessible to users with disabilities?
28. Walk me through the process of connecting to an on-premises data source from Power BI Service. What are the components involved?
29. Describe a time you had to implement a complex DAX formula involving multiple tables and relationships. What challenges did you face, and how did you overcome them?
Advanced Power BI interview questions
1. Explain a scenario where you would choose a calculated column over a measure, and why?
2. How would you optimize a Power BI report that is performing slowly due to a large dataset?
3. Describe your experience with implementing row-level security in Power BI.
4. What are the key considerations when designing a Power BI data model for optimal performance?
5. How would you handle slowly changing dimensions in Power BI?
6. Explain how you would troubleshoot a DAX query that is returning unexpected results.
7. Describe your experience with using Power BI's performance analyzer.
8. How would you implement a solution to track user adoption and usage patterns within a Power BI report?
9. Explain the difference between incremental refresh and full refresh in Power BI, and when you would use each.
10. Describe a time when you had to work with a complex data source in Power BI, and how you overcame the challenges.
11. How would you handle data privacy concerns when building and sharing Power BI reports?
12. Explain your approach to version control for Power BI reports and datasets.
13. Describe your experience with integrating Power BI with other Microsoft services, such as Azure or Power Automate.
14. How would you design a Power BI report to be accessible to users with disabilities?
15. Explain how you would implement a custom visual in Power BI.
16. Describe a scenario where you would use the TREATAS function in DAX.
17. How would you handle a situation where the data in your Power BI report is inconsistent with the source data?
18. Explain your approach to testing and validating Power BI reports before deployment.
19. Describe your experience with using Power BI's AI features, such as Key Influencers or Decomposition Tree.
20. How would you optimize a Power BI report for mobile viewing?
21. Explain how you would implement a custom error handling mechanism in Power BI.
22. Describe your experience with using Power BI embedded.
23. How would you handle a situation where you need to combine data from multiple data sources with different granularities?
24. Explain your understanding of the VertiPaq engine and how it impacts Power BI performance.
25. Describe how you would implement a solution for users to provide feedback on Power BI reports.
Expert Power BI interview questions
1. How would you optimize a Power BI report that is performing slowly, and what are the key areas to investigate?
2. Describe a scenario where you would choose DirectQuery over Import mode, and what are the trade-offs?
3. Explain the difference between row-level security (RLS) and object-level security (OLS) in Power BI, and how would you implement them?
4. How can you implement a custom visual in Power BI, and what are the considerations for performance and security?
5. Describe your experience with Power BI Premium Capacity and its benefits for enterprise deployments.
6. How would you design a Power BI solution for a large dataset with millions of rows, considering scalability and performance?
7. Explain the use of deployment pipelines in Power BI and how they streamline the release process.
8. How do you monitor and troubleshoot performance issues in Power BI reports and dashboards?
9. Describe the process of integrating Power BI with other Azure services like Azure Synapse Analytics or Azure Data Lake Storage.
10. What are the best practices for version control and collaboration in Power BI development projects?
11. How can you implement advanced analytics techniques like forecasting or clustering in Power BI using DAX or R/Python?
12. Explain the concept of incremental refresh in Power BI and how it improves data refresh performance.
13. Describe a challenging data modeling scenario you have encountered in Power BI, and how you resolved it.
14. How would you implement a data governance strategy for Power BI deployments in an organization?
15. Explain the use of Power BI REST APIs for automating tasks and integrating with other applications.
16. How do you handle error handling and data quality issues in Power BI dataflows?
17. Describe your experience with using Power BI Embedded for integrating Power BI content into custom applications.
18. How would you optimize a complex DAX calculation for performance, and what tools or techniques would you use?
19. Explain the process of creating and managing workspaces in Power BI, and their role in collaboration.
20. How do you ensure data security and compliance when connecting Power BI to sensitive data sources?
21. Describe your approach to documenting Power BI solutions and ensuring maintainability.
22. What are the considerations for designing Power BI reports for mobile devices, and how do you optimize the user experience?
23. Explain the benefits and drawbacks of using calculated columns versus measures in Power BI.

Hiring managers need to be well-prepared to evaluate candidates effectively, ensuring they possess the skills to drive insights and innovation within the organization, especially given the rising demand for Power BI professionals. These interview questions will help you assess candidates and determine if they have what it takes to excel in this role, similar to screening candidates for other roles such as Data Analyst.
This blog post offers a curated list of Power BI interview questions, categorized by skill level, from basic to expert, as well as a Power BI MCQ section. The questions cover a range of topics, from data modeling and visualization to DAX expressions and Power BI service administration.
By using this resource, you'll be able to identify top talent and build a team that can leverage Power BI to its fullest potential. Before your interviews, consider using Adaface's Power BI online test to filter candidates quickly.
Table of contents
Basic Power BI interview questions
Intermediate Power BI interview questions
Advanced Power BI interview questions
Expert Power BI interview questions
Power BI MCQ
Which Power BI skills should you evaluate during the interview phase?
Hire Skilled Power BI Professionals with the Right Tools
Download Power BI interview questions template in multiple formats
Basic Power BI interview questions
1. What is Power BI and what is it used for?
Power BI is a business analytics service by Microsoft. It provides interactive visualizations and business intelligence capabilities with a simple interface for end users to create their own reports and dashboards.
It's used for:
- Data visualization: Creating charts, graphs, and other visuals to understand data.
- Data analysis: Exploring data to identify trends, patterns, and insights.
- Reporting: Building interactive reports and dashboards to share insights with others.
- Data integration: Connecting to various data sources (databases, spreadsheets, cloud services) to bring data together in one place.
2. Can you explain the difference between Power BI Desktop and Power BI Service?
Power BI Desktop is a free desktop application you install on your computer. It's used for data modeling, transformation, creating reports and dashboards. Think of it as the development environment for Power BI. The reports you create in Desktop can be saved as .pbix files.
Power BI Service is a cloud-based platform where you publish and share the reports and dashboards you create in Power BI Desktop. It's where end-users typically consume the data and interact with the visualizations. It handles report sharing, collaboration, scheduling data refreshes, and implementing security.
3. What are the different types of data sources that Power BI can connect to?
Power BI can connect to a wide variety of data sources, broadly categorized as:
- Files: Excel, CSV, XML, JSON, PDF, SharePoint Folder
- Databases: SQL Server, Oracle, MySQL, PostgreSQL, Azure SQL Database, Teradata, Access
- Power BI Datasets: Existing Power BI datasets, Power BI dataflows
- Azure: Azure HDInsight, Azure Blob Storage, Azure Data Lake Storage
- Online Services: SharePoint Online List, Dynamics 365, Salesforce, Google Analytics, Adobe Analytics
- Other: Web, OData Feed, ODBC, OLE DB, Blank Query
Power BI also supports connectors built by the community. These data sources can be accessed via the Get Data option in the Power BI Desktop or Service.
4. Explain the process of importing data into Power BI.
Importing data into Power BI involves connecting to various data sources, extracting the data, and loading it into the Power BI data model. Power BI supports a wide array of data sources, including databases (SQL Server, Oracle, MySQL), files (Excel, CSV, JSON), online services (SharePoint, Salesforce, Dynamics 365), and cloud platforms (Azure, AWS). The process generally begins by selecting the "Get Data" option in Power BI Desktop or the Power BI service. You then choose the desired data source and provide the necessary credentials or connection details.
Once the connection is established, Power BI presents a navigator window where you can select the specific tables or data entities to import. Before loading the data, you can use the Power Query Editor (accessed via "Transform Data") to clean, transform, and reshape the data as needed. This includes tasks like filtering rows, renaming columns, changing data types, merging tables, and creating calculated columns. After the transformations are complete, you can load the data into the Power BI data model, where it can be used to create visualizations and reports.
5. What is a Power BI report and how is it different from a dashboard?
A Power BI report is a multi-page, detailed view of data, often interactive, allowing users to explore data through visualizations, filters, and slicers. It focuses on in-depth analysis and can be based on multiple datasets. A report can be thought of as a collection of related visualizations designed to answer specific questions or explore a particular subject area.
In contrast, a Power BI dashboard is a single-page summary of key metrics and visualizations from one or more underlying reports or datasets. Dashboards provide a high-level overview and are designed for monitoring important KPIs. They are less interactive than reports and are primarily used to provide a quick snapshot of the current state of the data. You cannot usually use filters on a dashboard directly; instead, you click on a visual in the dashboard and it directs you to the specific report page related to that visual.
6. What are visuals in Power BI? Give some examples.
Visuals are graphical representations of data in Power BI. They help users understand and analyze data more effectively than raw numbers. Power BI offers a wide range of built-in visuals.
Examples include:
- Bar charts: Used to compare values across categories.
- Line charts: Show trends over time.
- Pie charts: Display proportions of a whole.
- Scatter plots: Illustrate the relationship between two variables.
- Maps: Visualize data geographically.
- Tables: Present data in a tabular format.
- Matrices: Similar to tables but allow for more complex data aggregation.
- Cards: Display single numerical values prominently.
- KPIs: Track progress toward specific goals.
- Gauge charts: Display a single value relative to a goal or range.
- Funnel charts: Show the stages of a process and the amount of data flowing through each stage.
7. How do you filter data in Power BI?
Power BI offers several ways to filter data, enabling you to focus on specific subsets of information. You can apply filters at different levels: report-level filters affect all visuals on all pages in the report; page-level filters affect only the visuals on a specific page; and visual-level filters affect only a single visual. These filters can be found in the Filters pane.
Specifically, Power BI offers basic filtering (using checkboxes or select all/none), advanced filtering (specifying conditions like "is greater than", "contains", "starts with", etc.), and top N filtering (displaying only the top or bottom N values based on a measure). You can also implement slicers, which are interactive on-canvas visuals that act as filters, allowing users to easily explore different segments of the data.
8. What is the purpose of the Power BI data model?
The Power BI data model serves as the foundation for creating reports and visualizations by structuring and relating data from various sources. It defines relationships between tables, calculates measures, and establishes hierarchies, essentially acting as a semantic layer that translates raw data into meaningful insights.
Specifically, the data model enables you to:
- Combine data: Integrate data from diverse sources like databases, Excel files, and cloud services.
- Define relationships: Create relationships between tables based on common fields, ensuring data integrity and accurate analysis.
- Create calculated columns and measures: Perform calculations using DAX (Data Analysis Expressions) to derive new insights from existing data.
- Optimize performance: Improve query performance by optimizing data storage and relationships within the model.
- Establish hierarchies: Define hierarchical structures for drilling down into data for more granular analysis.
- Enhance data governance: provides a central area for defining data relationships and calculations.
9. Explain the concept of relationships between tables in Power BI.
In Power BI, relationships define how data from different tables connect and relate to each other. These relationships enable you to combine data from multiple sources into a single, cohesive dataset for analysis and visualization. They are crucial for creating accurate and meaningful reports.
Power BI uses cardinality (the type of relationship, e.g., one-to-one, one-to-many, many-to-one, many-to-many) and cross-filter direction to determine how filters applied to one table propagate to related tables. For example, a one-to-many relationship between a 'Customers' table and an 'Orders' table allows you to filter orders based on customer attributes. Proper relationships ensure calculations and aggregations are performed correctly across related data.
10. What are calculated columns and measures in Power BI? How are they different?
Calculated columns and measures in Power BI both extend the capabilities of your data model, but they differ in how they are computed and stored. A calculated column is evaluated at the time of data refresh and the result is stored in the data model, increasing its size. It is calculated row by row, similar to formulas in Excel. You can think of it as a new column added to your table.
Measures, on the other hand, are calculated at query time, which means they are dynamic and only computed when needed for a visualization or report. They do not store values in the data model, making them more efficient for aggregations and complex calculations that depend on user interactions. Measures are often used for things like totals, averages, and other aggregate functions. Common functions in measures include SUM(), AVERAGE(), COUNT(), etc.
11. What is DAX in Power BI and what is it used for?
DAX (Data Analysis Expressions) is a formula language used in Power BI, Power Pivot for Excel, and Analysis Services tabular models. It is used to create calculated columns, measures, and custom tables to perform advanced data analysis and calculations. DAX formulas can manipulate data from one or more tables, perform calculations based on relationships between tables, and create aggregations such as sums, averages, and counts. Essentially, it allows you to derive new insights from your data that are not readily available in the raw data itself. Common functions include SUM, AVERAGE, CALCULATE, and FILTER.
12. Give an example of a simple DAX expression.
A simple DAX expression calculates the sum of a column. For example, if you have a table named 'Sales' with a column named 'Amount', you can calculate the total sales amount using the following DAX expression:
Total Sales = SUM(Sales[Amount])
This expression creates a new measure named 'Total Sales' that sums all the values in the 'Amount' column of the 'Sales' table. SUM is a DAX function that iterates over the column and adds each value. Measures can then be used in visualizations.
13. How can you share a Power BI report with others?
You can share Power BI reports in several ways:
- Direct Sharing: Share directly with individuals by entering their email addresses. They'll need a Power BI Pro or Premium Per User (PPU) license, or the report needs to reside in a Premium capacity workspace to view it.
- Publish to Web (Public): Generate an embed code to make the report publicly accessible on the web. This option is suitable for data you don't mind being publicly visible. Be cautious when sharing publicly, as anyone can access the data.
- Embed in SharePoint Online: Embed the report within a SharePoint Online page. Users will need appropriate Power BI permissions to view it.
- Export (PDF, PowerPoint): Export the report as a static PDF or PowerPoint file.
- Publish to Organizational App: Bundle multiple reports and dashboards into an organizational app and distribute it to users within your organization.
- Embed in Teams: Embed the report directly into a Microsoft Teams channel or chat.
14. What are workspaces in Power BI and what is their purpose?
Workspaces in Power BI are collaboration areas for creating, sharing, and managing dashboards, reports, datasets, and other Power BI content. They allow teams to work together on BI solutions, ensuring consistent data access and security.
The primary purpose of workspaces is to facilitate collaboration, control access to content through roles, and deploy Power BI content to different environments (e.g., development, test, production). They also provide a way to organize content logically, making it easier to find and manage.
15. How do you refresh data in Power BI?
Data in Power BI can be refreshed in a few ways:
Manual Refresh: Users can manually refresh data in Power BI Desktop or the Power BI service by clicking the 'Refresh' button. This pulls the latest data from the data source.
Scheduled Refresh: For datasets in the Power BI service, you can configure scheduled refresh. This allows Power BI to automatically refresh the data at specified intervals (e.g., daily, weekly) so the reports are always up-to-date. You'll need to configure credentials to access the data source.
DirectQuery and Live Connection: For connections using DirectQuery or Live Connection, Power BI queries the data source directly each time a user interacts with a report, ensuring the data is always current. No explicit refresh is needed. However, performance depends on the data source's speed and availability.
Gateway: When data resides behind a firewall (on-premises), a gateway (either the on-premises data gateway or the personal gateway) is used to establish a connection between the Power BI service and the data source for scheduled refresh. This is important for secure data access.
API Refresh: Power BI also provides an API that can be used to trigger refreshes programmatically. This can be useful for triggering refreshes based on events or other external factors.
The choice of refresh method depends on factors like data source type, refresh frequency requirements, and data sensitivity.
16. What is Power BI Embedded?
Power BI Embedded allows you to embed Power BI reports and dashboards into your own applications. Instead of requiring users to navigate to the Power BI service, they can view and interact with the content directly within your application's interface. This provides a seamless and branded analytics experience for your users.
It's primarily designed for ISVs and developers who want to provide analytics capabilities to their customers without building their own BI platform. Power BI Embedded abstracts away the complexities of managing a full-fledged BI environment, allowing you to focus on your core application. You pay for what you use with capacity-based pricing.
17. Describe the steps to create a simple bar chart in Power BI.
To create a simple bar chart in Power BI, first load your data into Power BI Desktop. Then, in the Visualizations pane, select the 'Clustered bar chart' icon. This will add an empty bar chart visual to your report canvas. Next, drag the field you want to use for the categories (the bars) to the 'Category' well. Finally, drag the field you want to use for the values (the height of the bars) to the 'Values' well. Power BI will automatically create the bar chart based on the selected data. You can then customize the chart's appearance using the 'Format' pane.
18. What is the role of the Power BI gateway?
The Power BI gateway acts as a bridge between on-premises data sources and Power BI cloud services. It securely transfers data from sources that are not directly accessible over the internet to the Power BI service for reporting and analysis. Think of it as a secure tunnel.
Without a gateway, Power BI Desktop can connect to on-premises data, but the Power BI service cannot directly refresh datasets based on that data. The gateway enables scheduled data refreshes and live connections to ensure reports are always up-to-date with the latest on-premises information.
19. How can you improve the performance of a Power BI report?
To improve Power BI report performance, focus on data reduction and query optimization. Import only necessary data by using data source filters and aggregations within Power Query. Optimize DAX measures by avoiding iterative functions and using variables to store intermediate results.
Also, optimize the report design itself. Reduce the number of visuals on a single page, and consider using performance analyzer to identify bottlenecks. Enable query reduction techniques such as 'Apply changes only when needed' and minimize the use of bi-directional cross-filtering where possible.
20. What are some best practices for designing Power BI dashboards?
When designing Power BI dashboards, prioritize clarity and conciseness. Start by defining the target audience and the key performance indicators (KPIs) that need to be tracked. Keep the layout simple and intuitive, using visuals that are appropriate for the data being presented. Avoid cluttering the dashboard with unnecessary elements. Use consistent formatting and color schemes to improve readability and create a professional look.
Optimize performance by minimizing the number of visuals and using data reduction techniques like aggregations and filters. Ensure the dashboard is mobile-friendly and responsive to different screen sizes. Regularly test and gather feedback from users to iterate on the design and improve its effectiveness. Always consider accessibility guidelines to ensure the dashboard is usable by everyone.
21. What is the difference between a Power BI Pro and a Power BI Premium license?
Power BI Pro and Premium are both licenses that grant access to Power BI functionality, but they differ significantly in features, capacity, and cost. Power BI Pro is a per-user license, meaning each user who needs to create, share, or consume content needs a Pro license. It enables collaboration, sharing reports, and ad-hoc analysis. The storage is limited to 10GB per user. It also provides access to embedding APIs and controls.
Power BI Premium offers dedicated capacity and is designed for larger organizations. Instead of licensing each user, you purchase capacity, which can then be shared among users. Premium enables features like larger datasets, more frequent refreshes, deployment pipelines, paginated reports, and AI capabilities. It also includes access to Power BI Report Server for on-premises reporting. The capacity is measured in v-cores, each offering various storage and refresh limits.
22. How can you implement row-level security in Power BI?
Row-level security (RLS) in Power BI can be implemented using either Power BI Desktop or the Power BI Service. It restricts data access for given users.
RLS is achieved by defining roles and filters within the Power BI model. These filters are applied to tables, limiting the data that users assigned to those roles can see. You can define roles in Power BI Desktop using DAX expressions to filter data. After publishing the report to the Power BI service, you assign users or security groups to these roles. When users access the report, they only see the data authorized by the assigned role. RLS can be static (using pre-defined DAX expressions) or dynamic (using DAX expressions that adapt based on the user's username or other attributes).
23. What are parameters in Power BI and how can they be used?
Parameters in Power BI are named values that can be used to make your reports and queries more dynamic and flexible. They allow users to modify values within a report without needing to directly edit the underlying data or DAX code. Parameters act as variables that can be used in Power Query Editor to modify the data source, filter data, or change calculations.
Parameters can be used in several ways:
- Data Source Configuration: Connect to different databases or file paths using parameters.
- Filtering: Dynamically filter data based on user input.
- Calculations: Modify DAX expressions or calculated columns.
- Report Customization: Allow users to change titles, formatting, or other visual elements based on parameter values.
Intermediate Power BI interview questions
1. How would you handle a scenario where a Power BI report is performing slowly, and what steps would you take to identify the bottleneck?
If a Power BI report is performing slowly, I'd start by checking the obvious: is the data gateway healthy and online? Next, I'd use Power BI's Performance Analyzer to identify the visuals and DAX queries taking the most time. I'd also review the data model for any complex relationships or calculated columns that could be optimized. Specifically, I would look for high cardinality columns that can be removed or aggregations that are performed within power bi instead of the data source. Additionally, I would consider the row count in the tables and if possible apply aggregations/filters in the data source.
To address the bottleneck, I'd focus on optimizing the slow DAX queries by reviewing the formula and relationships used. If the issue is data volume, I would explore techniques like data reduction, aggregation, or incremental refresh. If the bottleneck is the data source, I would review the underlying database indexes and query performance.
2. Can you describe your experience with using DAX to create calculated columns and measures in Power BI, and provide an example of a complex calculation you've implemented?
I have extensive experience using DAX to create calculated columns and measures in Power BI. I've used calculated columns to add new attributes to existing tables based on row context, such as calculating age from a date of birth column. For measures, I've created aggregations and calculations that respond to slicers and filters in reports, like calculating total sales, average order value, and year-over-year growth.
An example of a complex calculation I implemented involved creating a measure to calculate a weighted average price, adjusting for different quantities sold at different prices. The DAX code used the SUMX function to iterate through each row in the sales table, multiplying the price by the quantity for each transaction, and then dividing the total by the sum of the quantities. The measure also had to handle potential division-by-zero errors using the DIVIDE function, returning 0 when total quantity was zero. DIVIDE function example: DIVIDE(SUMX(Sales, Sales[Price] * Sales[Quantity]), SUM(Sales[Quantity]), 0)
3. Explain the difference between calculated columns and measures in Power BI, and when you would use one over the other.
Calculated columns are new columns added to a table in your data model. They are computed row by row during data refresh and stored in the data model. You would use a calculated column when you need to filter, group, or slice your data based on the result of the calculation or when the calculation should be directly available as a new attribute of the table.
Measures are calculations that are performed dynamically at query time. They are not stored in the data model like calculated columns. Measures are typically used to aggregate data, such as calculating sums, averages, or counts. You would use a measure when you need to perform aggregations or calculations that change based on the user's interaction with the report, such as filtering or slicing the data. Also, use a measure when the calculation only applies to aggregations and doesn't make sense at the row level. If you are planning to use the calculation in a visual's values area, a measure is generally the right choice.
4. How do you optimize a Power BI report for mobile viewing, considering different screen sizes and user interactions?
To optimize Power BI reports for mobile, I prioritize creating a mobile-specific layout within Power BI Desktop. This involves using the phone layout view, which allows arranging visuals in a single, scrollable column optimized for smaller screens. Key considerations include minimizing visual clutter, using clear and concise labels, and ensuring adequate spacing for touch interactions. I also focus on using filters and slicers effectively to allow users to quickly drill down to the information they need.
Further optimization includes performance considerations. I would make sure the data model is optimized for speed, avoiding large datasets and complex calculations that can slow down loading times on mobile devices. Using optimized visuals and summarizing data where possible improves the user experience. Finally, testing the report on different mobile devices is critical to ensure compatibility and responsiveness across various screen sizes and resolutions.
5. Describe your approach to implementing row-level security (RLS) in Power BI, and what considerations you make when defining roles and filters.
My approach to implementing Row-Level Security (RLS) in Power BI involves defining roles and filters within Power BI Desktop. First, I identify the security requirements, determining which users or groups should have access to specific rows of data. Then, I create roles in Power BI Desktop, each representing a distinct set of users or groups. For each role, I define filters using DAX expressions that specify the criteria for filtering the data. These filters often use functions like USERNAME() or USERPRINCIPALNAME() to dynamically filter data based on the current user's identity.
When defining roles and filters, I consider factors like performance, complexity, and maintainability. Simple filters are preferred for better performance. It's crucial to thoroughly test the RLS implementation with different user accounts to ensure it's working as expected. I also design roles with scalability in mind, anticipating future changes in user access requirements. Consider also the impact on development team. If DAX is hard to read/maintain, this could create challenges. Another important consideration is how RLS will be implemented in the data source, and the impact of moving this logic into the Power BI data model.
6. What are the different types of data refresh in Power BI, and how do you choose the appropriate refresh type for a given scenario?
Power BI offers several data refresh types to keep your reports and dashboards up-to-date. The main types are: Scheduled Refresh, which automatically refreshes data at predefined intervals; On-demand Refresh, which allows manual refreshes when needed; Push Dataset, which refreshes data by pushing it directly into Power BI; Streaming Dataset, designed for real-time data updates; and Incremental Refresh, which only refreshes data that has changed.
Choosing the right refresh type depends on factors like data source type, data volume, refresh frequency requirements, and data sensitivity. For example, scheduled refresh is suitable for data that changes periodically, while streaming dataset is best for real-time data. Incremental refresh is ideal for large datasets where only a portion needs updating regularly. For sensitive data or when immediate updates are crucial, consider on-demand or push dataset options.
7. How would you troubleshoot a Power BI report that is displaying incorrect data, and what steps would you take to identify the source of the error?
To troubleshoot incorrect data in a Power BI report, I would start by verifying the data source connection and ensuring it's properly authenticated. Next, I'd examine the Power Query Editor steps within Power BI Desktop to identify any potential transformations or filters that may be causing the discrepancy. I would also carefully review the DAX measures and calculated columns used in the report, paying close attention to the formulas and logic to ensure they are accurate.
To pinpoint the error source, I would systematically check the data at each stage, starting from the raw data source and progressing through each transformation step in Power Query. Using techniques like data profiling and comparing the results with expected values, I can isolate where the data corruption or miscalculation is occurring. Finally, I would validate any relationships between tables and check for unintended filtering or cross-filtering effects that might be influencing the displayed data.
8. Can you explain how to use Power Query to transform and clean data from multiple sources before loading it into Power BI?
Power Query is used for data transformation and cleaning in Power BI. First, you Get Data from various sources (Excel, SQL Server, web, etc.). Power Query then opens, allowing you to reshape the data.
Transformations include:
- Filtering rows: Removing unwanted data.
- Removing columns: Deleting unnecessary fields.
- Pivoting/Unpivoting: Reshaping the data structure.
- Changing data types: Ensuring correct data formats (e.g., text to number).
- Merging/Appending queries: Combining data from multiple sources (joins and unions).
- Adding custom columns: Creating new columns based on formulas. (e.g.,
=[Column1] * [Column2])
Once transformed, you Close & Apply the changes to load the cleaned data into the Power BI data model.
9. Describe your experience with creating and managing relationships between tables in Power BI, and how you ensure data integrity.
I have extensive experience creating and managing relationships between tables in Power BI using the 'Manage Relationships' feature. This includes defining the cardinality (one-to-one, one-to-many, many-to-one, many-to-many) and cross-filter direction based on the business requirements and the data model. I also utilize calculated columns and DAX measures to create virtual relationships when direct relationships aren't feasible.
To ensure data integrity, I validate relationships by checking for null values in key columns, understanding the data granularity of each table, and verifying that the relationships accurately reflect the real-world connections. I also use Power BI's data profiling tools to identify inconsistencies and potential data quality issues that might affect the relationship's integrity, and address them before creating the relationship. Furthermore, I validate the accuracy of the relationships by verifying that filters applied across related tables yield the expected results, and perform testing with sample data sets.
10. How do you use bookmarks and selections in Power BI to create interactive and dynamic reports?
Bookmarks in Power BI capture the current state of a report page, including filters, slicers, and visual selections. By creating multiple bookmarks with different states, you can allow users to navigate between predefined views of the data. Selections, on the other hand, enable cross-filtering and highlighting within visuals. When a user selects a data point in one visual, related data points in other visuals are highlighted or filtered based on that selection.
To create interactive reports: First, create the desired visuals and slicers. Then, define different states by adjusting filters, selections, and visual properties. Next, create bookmarks for each state using the 'Bookmarks' pane (View > Bookmarks). Finally, link these bookmarks to buttons or images, enabling users to click these elements to navigate between the defined states. Selections are inherently dynamic, requiring no explicit setup besides ensuring that visuals are set to interact with each other (Format > Edit Interactions).
11. Explain your understanding of the Power BI service architecture, including workspaces, datasets, and reports.
The Power BI service architecture revolves around several key components working together in the cloud. Workspaces are containers for Power BI content, enabling collaboration and access control. Datasets represent the data sources imported or connected to Power BI, including data models, tables, and relationships. These datasets act as the foundation for visualizations and analysis.
Reports are interactive dashboards and visualizations built on top of datasets. Users can create reports to explore data, gain insights, and share findings. The Power BI service facilitates data refresh, report sharing, and collaboration among users within an organization. It's a SaaS (Software as a Service) platform, meaning that Microsoft manages the infrastructure and platform, while users focus on creating and consuming business intelligence content. Gateways are used for connecting to on-premise data sources.
12. How do you approach designing a Power BI report to meet the needs of different stakeholders, considering their varying levels of technical expertise?
To design a Power BI report for diverse stakeholders, I start by gathering requirements from each group, focusing on their specific needs and KPIs. I then prioritize the most critical information and design the report with multiple layers of detail. High-level dashboards provide summaries for executives, while more detailed pages cater to analysts who need to drill down. I'll use tooltips, drill-throughs and bookmarks to facilitate exploration. It is critical to use clear visuals and avoid technical jargon. I also ensure the report's performance is optimized for quick loading and responsiveness. The report also needs to be tested with representative users from each group to iterate on design and ensure it meets their individual needs. Finally, I will use row-level security to guarantee only authorized users can see sensitive data.
13. What strategies do you employ to ensure data quality and accuracy in Power BI reports, and how do you validate your results?
I ensure data quality and accuracy in Power BI reports using several strategies. First, I focus on data profiling and cleansing in Power Query. This includes steps like removing duplicates, handling missing values (imputation or exclusion), correcting data types, and standardizing formats. I also implement data validation rules directly within Power Query using conditional columns to flag or filter out invalid data based on business logic. Transformations such as Table.ReplaceValue for fixing inconsistencies and Number.Round for precision control are also used.
To validate results, I employ techniques like comparing aggregated values in Power BI against source system totals to ensure reconciliation. I also conduct thorough testing of DAX measures to verify they are calculating correctly by comparing results with manual calculations or known values. Cross-validation using different visualizations (e.g., matrix vs. chart) helps identify anomalies. Finally, I actively seek feedback from end-users and subject matter experts to confirm that the data presented is accurate and meets their expectations.
14. How do you use drill-through and drill-down features in Power BI to enable users to explore data at different levels of granularity?
Drill-down and drill-through in Power BI are essential features for navigating data hierarchies and exploring granular details. Drill-down allows users to explore data within the same visual, moving from a higher-level category to a more specific subcategory. For example, a user could drill down from 'Year' to 'Quarter' to 'Month' directly within a chart, revealing more granular time-based insights. Drill-through enables users to navigate to a different page in the report that contains more details related to a specific data point selected. This often involves passing filter context from the source page to the destination page.
To implement these features, you'd typically define hierarchies in your data model (e.g., Year > Quarter > Month). For drill-down, you simply add the hierarchy to the axis of a visual and enable drill-down in the visual header. For drill-through, you create a dedicated "details" page, add the field you want to drill-through on to the drill-through filter pane on that page, and configure the source page to allow drill-through actions. Users can then right-click on a data point in the source visual and choose 'Drill through' to access the details page, filtered to show information relevant to the selected data point.
15. Describe your experience with using custom visuals in Power BI, and how you would evaluate the suitability of a custom visual for a specific use case.
I've used custom visuals extensively in Power BI to enhance the default visualization options and address specific reporting needs. My experience includes importing custom visuals from the AppSource marketplace, developing custom visuals using the Power BI Visuals SDK (JavaScript, TypeScript, and D3.js), and integrating them into reports and dashboards. I've created visuals to display network graphs, advanced time series analysis, and process flow diagrams, which were not readily available out-of-the-box.
To evaluate a custom visual's suitability, I consider several factors. First, does it meet the specific data visualization requirement that the standard visuals cannot? Second, I assess its performance with the dataset in question - is it responsive and efficient? Third, I check for compatibility with different browsers and devices. Fourth, I examine the level of customization available and whether it aligns with the desired aesthetic and functional needs. Finally, I consider its security and trust by reviewing its certification status and the publisher's reputation. If developing a custom visual, thorough unit testing is essential.
16. How do you integrate Power BI with other Microsoft products, such as Excel, SharePoint, and Teams?
Power BI integrates smoothly with other Microsoft products. With Excel, you can analyze Power BI data directly within Excel using the 'Analyze in Excel' feature or import Excel data into Power BI for enhanced visualization and analysis. For SharePoint, you can embed Power BI reports and dashboards directly into SharePoint pages, allowing users to view and interact with them within their familiar SharePoint environment. Similarly, Power BI integrates with Microsoft Teams by allowing you to embed reports and dashboards as tabs within Teams channels or share reports directly in chats, facilitating collaborative data analysis and decision-making. This integration enables seamless data sharing and collaboration across the Microsoft ecosystem.
17. Explain how to use parameters in Power BI to allow users to customize report filters and calculations.
Power BI parameters enable report customization by allowing users to modify filters and calculations. You create parameters in the Power Query Editor (Get Data -> Transform Data). Define the parameter's name, data type (e.g., text, number, date), and optionally a list of suggested values or a query to dynamically populate the values. Once created, you can reference these parameters within your Power Query transformations (M code). For example, a parameter controlling a filter can be applied to a table by referencing the parameter's value in a filter step. Similarly, parameters can be used in calculated columns or measures using DAX, allowing users to influence calculations directly.
To expose the parameter to report users, go to the Modeling tab -> New Parameter. This creates a slicer or a what-if parameter visual in the report canvas. When users interact with this slicer, the parameter's value changes, which, in turn, affects the data filtering or calculations defined in your Power Query or DAX expressions. Parameters can significantly improve report interactivity and flexibility, enabling users to explore the data based on their specific needs. This avoids the need to create duplicate reports for slight variations.
18. How would you handle a situation where a Power BI report needs to be migrated to a different environment, such as from development to production?
Migrating a Power BI report between environments (e.g., dev to production) involves careful steps to ensure data integrity and functionality. I'd use a combination of Power BI parameters and deployment pipelines. First, I'd parameterize the data source connections in the Power BI Desktop file. This allows easily switching between development and production databases/data sources. After parameterizing I would use Power BI Deployment pipelines to automate the promotion process. This involves creating pipelines that represent the different environments (Dev, Test, Prod). These pipelines will handle the process of deploying, testing, and monitoring of your Power BI content, this will make the process more secure, as the dataset will not be downloaded at any point.
19. Describe your experience with using the Power BI REST API to automate tasks and integrate Power BI with other applications.
I've used the Power BI REST API to automate tasks such as refreshing datasets, updating parameters, and exporting reports. For example, I created a Python script leveraging the requests library to authenticate with Azure Active Directory, obtain an access token, and then use that token to call the Power BI REST API to refresh a specific dataset after a data warehouse update. This ensured that Power BI reports always displayed the most current information without manual intervention.
Furthermore, I've integrated Power BI with other applications by embedding reports and dashboards. Using the Power BI JavaScript API in conjunction with the REST API, I created a custom web application that dynamically filters and displays Power BI content based on user roles and permissions managed in the external application. Specifically, I used the powerbi.embed method and passed filter parameters received from the external application's backend, effectively creating a tailored Power BI experience within the existing application.
20. How do you use the performance analyzer in Power BI to identify and resolve performance issues in your reports?
The Power BI Performance Analyzer helps identify slow-performing report elements. To use it, first, open the Performance Analyzer pane in Power BI Desktop (View tab > Show panes > Performance analyzer). Then, click "Start recording" and interact with your report - filter data, navigate pages, etc. The analyzer captures query durations, visual rendering times, and other performance metrics for each action. Analyze the generated log by sorting by "Total time (milliseconds)" to identify the most resource-intensive visuals or DAX queries.
Based on the analysis, you can optimize slow elements. For DAX queries, review the formula for inefficiencies, consider using variables, optimizing relationships or simplifying calculations. For slow visuals, reduce the amount of data displayed, simplify the visual's design, or consider alternative visual types. Using these techniques helps improve report loading and interaction speed.
21. Explain how to use incremental refresh in Power BI to optimize the refresh process for large datasets.
Incremental refresh in Power BI optimizes the refresh process for large datasets by only refreshing data that has changed, rather than refreshing the entire dataset. This is achieved by using parameters to filter the data based on date ranges, typically using RangeStart and RangeEnd parameters. Power BI automatically manages these parameters to determine which partitions need to be refreshed.
To implement it, you need to define these parameters, create a filter in Power Query using those parameters, and then configure the incremental refresh policy in the Power BI service. This policy specifies the refresh and archive periods. For example, you might refresh the last month's data every day and keep three years of historical data. This significantly reduces refresh times and resource consumption, especially for datasets that are continuously growing. This also keeps the PBIX file size manageable. Data partitions are created based on the date range.
22. Describe your experience with using the Power BI mobile app to view and interact with reports on mobile devices.
I've used the Power BI mobile app extensively to access and interact with reports and dashboards on both iOS and Android devices. My experience includes navigating reports, filtering data, drilling down into specific visuals, and using features like annotations to highlight key insights and share them with colleagues. I've also utilized the mobile app for data alerts to stay informed about critical changes in key metrics, as well as offline access to view reports when a network connection isn't available.
Specifically, I appreciate the responsiveness of the app and its optimization for smaller screens. I've customized the mobile layout of reports to ensure optimal viewing on different device sizes. I am familiar with using features like the barcode scanner to quickly filter reports based on scanned data and leveraging geo-location to filter reports based on my current location, which has been particularly useful in sales-related contexts. I also used 'Ask a question' feature using natural language.
23. How do you use the Q&A feature in Power BI to allow users to ask questions about their data in natural language?
To use the Q&A feature in Power BI, first ensure that Q&A is enabled for your dataset. It's generally enabled by default. Users can then start typing questions in the Q&A explorer box within a report or dashboard. Power BI uses its natural language processing engine to interpret the question and generate an appropriate visualization or answer.
To improve the experience, you can refine Q&A's understanding by teaching it terms and defining synonyms. This is done in the Modeling view under the 'Q&A Setup' section. You can also add suggested questions to help users get started and guide them toward relevant insights. Finally, you can review user questions to identify areas where Q&A's understanding can be further improved.
24. Explain how to use the AI visuals in Power BI, such as key influencers and decomposition tree, to gain insights from your data.
Power BI's AI visuals empower users to uncover hidden relationships and drivers within their data. The Key Influencers visual identifies factors that significantly impact a selected outcome. It ranks these influencers based on their impact and displays how different values of those influencers affect the outcome. For example, in a sales dataset, it could reveal that region and marketing campaign are key influencers of sales, highlighting which regions and campaigns lead to higher sales figures.
The Decomposition Tree visual breaks down a measure into its constituent dimensions, allowing you to explore data in a hierarchical manner. You can start with an overall metric (like total revenue) and then drill down through different categories (like product category, region, and customer segment) to see how each contributes to the whole. The 'AI Splits' feature can automatically suggest the most impactful dimensions to drill down into, guiding you to key areas for further investigation. By using these AI visuals, business users can quickly identify patterns and gain actionable insights without requiring advanced statistical expertise.
25. How do you use the Power BI dataflows to create reusable data preparation and transformation processes?
Power BI dataflows enable reusable data preparation and transformation by encapsulating ETL logic in the cloud. You define data sources, transformations (using Power Query), and refresh schedules within a dataflow. Subsequent Power BI reports or other dataflows can then connect to this dataflow as a data source, reusing the already prepared and transformed data. This reduces redundancy and promotes consistency across multiple reports.
Key benefits include:
- Centralized Data Preparation: Define transformations once, use everywhere.
- Improved Consistency: Ensures all reports use the same data transformation logic.
- Reduced ETL Effort: Avoid repeating the same data preparation steps for each report.
- Enhanced Collaboration: Dataflows can be shared and managed collaboratively within an organization.
26. How do you monitor and maintain Power BI reports and dashboards to ensure they are performing optimally and meeting user needs?
Monitoring and maintaining Power BI reports involves several key activities. Performance is monitored through the Performance Analyzer within Power BI Desktop, which helps identify slow visuals and DAX queries. The Power BI Premium Capacity Metrics app provides insights into the performance of Premium capacities. Usage is tracked using the Power BI activity log and audit logs to understand report adoption and identify potential areas for improvement. Gateway connections and data refresh schedules are regularly checked for errors to ensure data accuracy.
User needs are met by actively gathering feedback through surveys, user interviews, and direct communication. Based on this feedback, reports and dashboards are iterated upon to improve usability and relevance. Regular reviews of data models and measures are conducted to ensure they align with business requirements. Proactive communication about updates, scheduled maintenance, or any known issues is essential to manage user expectations and build trust.
27. What are some best practices for designing Power BI reports that are accessible to users with disabilities?
When designing Power BI reports for accessibility, prioritize clear and simple layouts. Use sufficient color contrast between text and background, aiming for a contrast ratio of at least 4.5:1. Avoid relying solely on color to convey information; instead, use labels, icons, or patterns. Ensure that all interactive elements, like buttons and slicers, are keyboard navigable. Provide alt text for all visuals and images, describing the content and purpose.
Additionally, structure your report logically using headings and proper tab order. Test your reports with assistive technologies like screen readers to identify and fix any accessibility issues. Power BI has an accessibility checker that helps identify these issues. Use it frequently during the development process.
28. Walk me through the process of connecting to an on-premises data source from Power BI Service. What are the components involved?
To connect to an on-premises data source from Power BI Service, you'll primarily use the On-premises data gateway. First, you install the gateway on a server within your on-premises network that has access to the data source. The gateway acts as a bridge, securely transferring data between the on-premises data source and the Power BI Service in the cloud.
The process involves:
- Downloading and installing the On-premises data gateway (standard or personal mode) on a machine that meets the requirements and can access the data source.
- Configuring the gateway with your organizational account.
- Adding data sources to the gateway configuration, specifying the data source type, server, database, and authentication method.
- In Power BI Service, when you create or refresh a report using that on-premises data source, you'll select the configured gateway to facilitate the data transfer. The gateway will then handle the secure connection and data retrieval.
29. Describe a time you had to implement a complex DAX formula involving multiple tables and relationships. What challenges did you face, and how did you overcome them?
In a previous role, I needed to calculate the rolling 12-month sales growth for our product categories. This involved sales data in a Sales table, product categories in a Product table, and a Date table for time intelligence. The Sales table was related to the Product table via a ProductID and to the Date table via an OrderDate. The complexity arose from needing to correctly filter the Sales table for the previous 12 months, considering the current date context and ensuring proper aggregation at the category level.
The main challenges were performance and ensuring the calculation was accurate across different granularities. I overcame these by:
- Using
CALCULATEandDATEADDfunctions: To filter theSalestable for the rolling 12-month period. - Leveraging
ALLandALLEXCEPT: To remove unwanted filters and ensure correct aggregation at the product category level. - Optimizing relationships: Ensuring that the relationships between the tables were properly defined and optimized for query performance.
- Testing thoroughly: Creating test measures to validate the results against expected values. Specifically, I wrote some tests to ensure the following: Current Sales, Last Year Sales and Growth calculation.
Advanced Power BI interview questions
1. Explain a scenario where you would choose a calculated column over a measure, and why?
I would choose a calculated column over a measure when the result needs to be used in a slicer, filter, or row/column axis of a visual, or when I need to establish relationships with other tables based on the calculated value. Calculated columns are materialized and stored in the data model, making them suitable for these scenarios because these elements rely on the physical data model. Measures, on the other hand, are calculated on the fly, so they can't be used in these contexts.
For example, suppose you have a table of sales transactions and you need to categorize each transaction into 'High Value' or 'Low Value' based on a threshold. A calculated column would be appropriate here. You can then use this calculated category column directly in a slicer to filter sales transactions, which wouldn't be possible with a measure.
2. How would you optimize a Power BI report that is performing slowly due to a large dataset?
To optimize a slow Power BI report with a large dataset, I'd focus on data reduction, query optimization, and report design. I would start by filtering data in Power Query to only import necessary columns and rows. Aggregating data at the source (if possible) or within Power BI can also significantly reduce dataset size. Optimizing DAX measures by simplifying formulas and using variables to avoid redundant calculations is key.
On the report design side, I would limit the number of visuals on a single page, consider using bookmarks and page navigation to break down the report into smaller sections, and disable cross-highlighting if it's not essential. Finally, regular maintenance such as updating Power BI Desktop and gateway to the latest versions, and ensuring the data gateway is properly configured can contribute to improved performance. Using Performance Analyzer is also crucial to identify slow elements in the report.
3. Describe your experience with implementing row-level security in Power BI.
I have experience implementing row-level security (RLS) in Power BI using both static and dynamic approaches. With static RLS, I've defined roles and assigned users directly to those roles based on predefined criteria. For example, creating a 'Sales Manager' role that only allows access to data related to their specific region. This involved using the Power BI Desktop interface to define roles and DAX filters on relevant tables.
For dynamic RLS, I've leveraged the USERNAME() or USERPRINCIPALNAME() DAX functions to filter data based on the current user's login. This is particularly useful when user access is determined by a table containing user-region mappings. I create a role and a DAX expression that compares the user's identity to the region value in the mapping table. I have also used security groups, ensuring appropriate governance and assignment of users to roles.
4. What are the key considerations when designing a Power BI data model for optimal performance?
When designing a Power BI data model for optimal performance, key considerations include: minimizing data import by filtering to only necessary columns and rows, using DirectQuery judiciously (especially for large datasets that change frequently), and optimizing DAX calculations. Favor star schema designs with dimension tables and a fact table, which improves query performance. Also, create appropriate relationships between tables, ensuring they are correctly defined (cardinality and cross-filter direction). Properly formatted data types and calculated columns can also speed up queries. Consider aggregations to pre-calculate results at a higher level of granularity. Avoid bi-directional relationships where possible.
Further optimizations may involve partitioning large tables, optimizing DAX measures (avoiding iterator functions like SUMX and FILTER when possible), and regularly reviewing the performance analyzer within Power BI Desktop to identify bottlenecks and areas for improvement.
5. How would you handle slowly changing dimensions in Power BI?
Slowly changing dimensions (SCDs) in Power BI can be handled using Power Query and DAX. For Type 1 SCDs (overwriting old values), you can simply load the updated data into your dimension table. For Type 2 SCDs (creating new rows for changes), you'll need to implement a process to identify changes and insert new rows with appropriate start and end dates. This often involves comparing the incoming data with the existing dimension table and using Power Query transformations to create the new rows. A common approach is to use Table.NestedJoin to find the changes between the existing dimension table and the update data. Then, based on the changes, new rows will be appended to the dimension table with the new values and the valid dates. DAX can be used to create calculated columns for filtering the latest values or other dimension properties.
For a Type 2 SCD, consider these steps:
- Identify changes: Compare the new data with the existing dimension table based on business keys.
- Close existing rows: Update the
EndDateof the existing rows where changes are detected. - Insert new rows: Insert new rows with the updated values and set the
StartDateto the day after theEndDateof the previous row and theEndDateto a future date (or NULL if applicable). - Add Index Column: Add index column to the dimension table and order by business key and start date in ascending order.
6. Explain how you would troubleshoot a DAX query that is returning unexpected results.
To troubleshoot a DAX query returning unexpected results, I'd start by simplifying the query to isolate the problem area. This might involve removing filters or calculated columns one by one to see if the results become correct. Then, I would use the EVALUATE and ROW DAX functions to inspect intermediate calculations. For example, EVALUATE ROW("Value", [MyMeasure]) helps to view the measure's value. Also consider the filter context and relationships between tables. Explicitly stating the direction of relationships using CROSSFILTER can sometimes resolve ambiguity.
I would also validate the data types of the columns involved and ensure they are as expected. Double-check the logic of any calculated columns and measures, especially those involving complex calculations or aggregations. Using DAX Studio to profile the query and identify performance bottlenecks can sometimes reveal unexpected behaviour. Finally, use the DAX query view in Power BI Desktop (if applicable) to step through the execution and observe the results at each stage.
7. Describe your experience with using Power BI's performance analyzer.
I've used Power BI's Performance Analyzer extensively to identify and address performance bottlenecks in reports. The Performance Analyzer allows you to record and examine the DAX queries and visuals that take the longest to render. I usually start by recording the user interactions that seem slow, then analyze the results.
Specifically, I look at the DAX Query, Visual display and other times, and correlate that back to specific measures or visuals. I can then use this information to optimize my DAX, simplify complex visuals, or consider data model improvements. For example, I identified a slow-performing measure by comparing the "DAX Query" duration across different visuals and I rewrote the DAX to improve performance.
8. How would you implement a solution to track user adoption and usage patterns within a Power BI report?
To track user adoption and usage patterns in Power BI, I'd primarily leverage the Power BI Activity Log. This log captures various events, including report views, dashboard accesses, and dataset refreshes. I would extract and analyze this data to understand which reports are most popular, when they are being used, and by whom.
To enhance this further, I could integrate custom events using Power BI's DAX language and custom measures. For example, I might track specific button clicks or filter selections within a report. The data can be stored in a separate data source for further analysis and visualization. This provides more granular insights into user behavior within a specific report. Furthermore, incorporating Application Insights (if applicable, depending on the embedding scenario) provides comprehensive tracking and telemetry.
9. Explain the difference between incremental refresh and full refresh in Power BI, and when you would use each.
Incremental refresh in Power BI loads only the data that has changed since the last refresh, based on defined date ranges and a filter. This is much faster and more efficient than loading the entire dataset every time, especially for large datasets. Full refresh, on the other hand, reloads all the data from the source, overwriting the existing data.
You'd use incremental refresh when you have a large dataset that's frequently updated, and you only need to load the new or changed data. Full refresh is suitable for smaller datasets, datasets where the source data has undergone significant changes, or during initial setup and testing of a Power BI report.
10. Describe a time when you had to work with a complex data source in Power BI, and how you overcame the challenges.
In a previous role, I had to create a Power BI report using data from a REST API that returned nested JSON. The initial challenge was flattening the nested structure to make it usable in Power BI. I used Power Query's Json.Document and List.Combine functions iteratively to extract the data into tabular format. I also had to handle pagination, as the API only returned a limited number of records per request. This was resolved by creating a custom function that recursively called the API, accumulating the results until all pages were retrieved.
Another issue was data consistency. The API occasionally returned fields with inconsistent data types (e.g., sometimes a number as a string). To address this, I implemented conditional logic in Power Query to standardize the data types before loading it into the Power BI model. For example, using try...otherwise to convert values to numbers, defaulting to null if the conversion failed. This ensured data integrity and prevented errors in the report.
11. How would you handle data privacy concerns when building and sharing Power BI reports?
When building and sharing Power BI reports, I address data privacy through several measures. First, I implement row-level security (RLS) within Power BI to restrict data access based on user roles, ensuring users only see relevant information. Data masking techniques can also be employed to obfuscate sensitive data while still allowing for meaningful analysis. Secondly, I carefully consider data sensitivity classifications and apply appropriate sharing settings. Reports containing sensitive data are shared only with authorized personnel via secure channels, and I use sensitivity labels to enforce data governance policies. I also avoid embedding sensitive data directly in report titles or visualizations visible to a broad audience. Finally, I ensure compliance with relevant data privacy regulations (e.g., GDPR, CCPA) by regularly reviewing data usage and access patterns, implementing data retention policies, and providing users with clear information about data processing practices.
12. Explain your approach to version control for Power BI reports and datasets.
My approach to version control for Power BI involves a combination of strategies. For .pbix report files, I utilize Git. I store these files in a Git repository, which allows me to track changes, revert to previous versions, and collaborate effectively with others. To mitigate .pbix files being binary, I break them down to their underlying parts using the Power BI Devops Toolkit, storing them as human readable format. This makes it easy to perform proper diffing and merging of code.
For the datasets/dataflows, I use a deployment pipeline approach where development, test and production environments are clearly separated. Changes are promoted through the pipeline using automated processes when possible. Parameterization plays a key role, particularly around data source connections and refresh schedules, enabling seamless deployments across environments. Regular backups of the Power BI service workspaces are also essential to provide an extra layer of safety net.
13. Describe your experience with integrating Power BI with other Microsoft services, such as Azure or Power Automate.
I have experience integrating Power BI with several Microsoft services. For example, I've used Power Automate to trigger data refreshes in Power BI based on events like file uploads to SharePoint or updates in Dynamics 365. This ensured near real-time data visualization. I've also connected Power BI to Azure services like Azure SQL Database, Azure Data Lake Storage, and Azure Analysis Services for data warehousing and advanced analytics, using both direct query and import modes, depending on the data volume and performance requirements.
Furthermore, I've embedded Power BI reports and dashboards within Power Apps applications to provide users with interactive data visualizations within their workflows. This involved configuring appropriate security settings and passing parameters between Power Apps and Power BI to filter the data displayed. I also used Azure functions with Power BI REST APIs for more complex automation scenarios, such as automatically exporting reports to SharePoint.
14. How would you design a Power BI report to be accessible to users with disabilities?
To design an accessible Power BI report, consider the following: Use sufficient color contrast between text and background. Avoid relying solely on color to convey information. Ensure all visuals have alt text describing their content. Use a clear and logical report layout, and set the tab order for easy navigation using a keyboard. Use descriptive titles and labels for all report elements. For users with screen readers, test the report with a screen reader to verify accessibility. Leverage Power BI's built-in accessibility checker to identify potential issues, and fix the issues accordingly.
15. Explain how you would implement a custom visual in Power BI.
To implement a custom visual in Power BI, I would start by installing the Power BI Visuals CLI (npm install -g powerbi-visuals-tools). Then, I'd use the CLI to create a new visual project (pbiviz new <visualName>). This scaffolds the basic file structure, including visual.ts (the core logic), capabilities.json (describes data roles and properties), and package.json.
Next, I'd modify visual.ts to handle data binding and rendering using D3.js or similar libraries. I would define the visual's properties and data roles in capabilities.json. After coding the visual, I'd package it using pbiviz package. Finally, I would import the resulting .pbiviz file into Power BI Desktop to test and use the custom visual. Debugging is done using Power BI Desktop's developer tools.
16. Describe a scenario where you would use the TREATAS function in DAX.
A common scenario for TREATAS is when you need to apply a filter from one table to another table that doesn't have a direct relationship. Imagine you have a 'Sales' table and a 'Promotions' table. The 'Sales' table contains transaction data, and the 'Promotions' table lists which products were on promotion during specific dates. There's no direct link between 'Sales' and 'Promotions' based on product or date.
You could use TREATAS to treat a filtered list of products from the 'Promotions' table as if it were a filter on the 'Sales' table. For example, CALCULATE(SUM(Sales[Amount]), TREATAS(VALUES(Promotions[ProductID]), Sales[ProductID])) would calculate the total sales amount, but only for products that appear in the 'Promotions' table. TREATAS temporarily creates a virtual relationship using the specified columns.
17. How would you handle a situation where the data in your Power BI report is inconsistent with the source data?
First, I'd immediately verify the data refresh status in Power BI service to ensure it completed successfully. Then I'd systematically investigate the discrepancy. This involves:
- Checking the ETL process: Reviewing the data transformation logic (Power Query) within Power BI and also any external ETL processes used to populate the source data, looking for errors or unexpected transformations.
- Validating data types: Confirming that data types in Power BI and the source database are consistent. A mismatch can cause unexpected results.
- Examining filters and slicers: Double-checking that no accidental filters or slicers are applied in the Power BI report that might be limiting or altering the displayed data.
- Comparing data directly: Running SQL queries against the source database to directly extract and compare the inconsistent data with what's shown in the Power BI report. Once the root cause is identified (e.g., a bug in the ETL, a data type issue, or a filtering problem), I'd correct the issue and refresh the Power BI report. Finally, I would document the issue and the resolution to prevent future occurrences.
18. Explain your approach to testing and validating Power BI reports before deployment.
My approach to testing Power BI reports involves a layered strategy. First, I validate the data source connection and confirm data accuracy by comparing aggregated results in the Power BI report with the source database or system, using SQL queries or other tools to verify numbers match. Then, I test calculations and measures, ensuring they produce the correct results under various conditions. I also focus on the user interface, checking for visual consistency, correct formatting, and responsiveness across different devices and screen sizes. Accessibility standards (WCAG) are also considered.
Before deployment, I conduct thorough user acceptance testing (UAT) where stakeholders review the report for completeness, accuracy, and usability. I use a checklist covering data validation, functional testing, performance evaluation (report load times), and security aspects (data access control). Any identified issues are documented, addressed, and re-tested before the report is moved to production.
19. Describe your experience with using Power BI's AI features, such as Key Influencers or Decomposition Tree.
I've used Power BI's AI features like Key Influencers and Decomposition Tree to uncover insights and enhance data exploration. With Key Influencers, I've identified factors impacting key metrics such as customer churn and sales performance by analyzing various fields and revealing statistically significant relationships. For instance, I used it to determine that delivery time and customer service ratings were key influencers of customer satisfaction.
Decomposition Tree has helped me perform root cause analysis and drill down into data hierarchies. It's especially useful for quickly understanding the composition of aggregated metrics and identifying contributing factors. I utilized it to break down total sales by region, product category, and individual sales representatives, pinpointing areas with unexpectedly low or high performance.
20. How would you optimize a Power BI report for mobile viewing?
To optimize a Power BI report for mobile viewing, prioritize simplicity and clarity. Use a mobile-first layout within Power BI Desktop, which is under the View ribbon, then Mobile layout. This allows you to resize and rearrange visuals specifically for smaller screens. Key considerations include:
- Reduce Visual Clutter: Use only essential visuals, avoiding overcrowding the screen. Keep text concise and labels clear.
- Optimize Visual Types: Opt for visual types that render well on mobile devices, like simple bar charts, line charts, and card visuals.
- Implement Page Navigation: Use bookmarks and buttons to create a clear navigation structure, making it easy for users to move between different report sections. Reduce the number of pages. Consider interactive elements like slicers to filter the data and provide drill down to reduce the need for additional visuals. Always test your report on different mobile devices and screen sizes.
21. Explain how you would implement a custom error handling mechanism in Power BI.
Power BI doesn't offer a direct 'try-catch' block like traditional programming languages for error handling within DAX or Power Query. However, you can implement custom error handling through several methods. One common approach is to use the IFERROR function in DAX or try...otherwise in Power Query (M). These functions allow you to specify an alternative result if an expression returns an error. For example, IFERROR(DIVIDE(Sales[TotalSales], Sales[Returns]), 0) will return 0 if the division results in an error (e.g., division by zero).
Another strategy involves creating custom error tables. You can log errors encountered during data transformations in Power Query to a dedicated table. This table can store details like the error message, the step where the error occurred, and the data that caused the error. This allows for centralized monitoring and analysis of data quality issues. You can also use conditional logic to validate data and raise custom errors where appropriate, although this doesn't halt query execution but rather flags potential issues.
22. Describe your experience with using Power BI embedded.
I have experience using Power BI Embedded to integrate interactive dashboards and reports into custom applications. I've primarily worked with the JavaScript API to embed reports, configure filters, and handle events. My focus has been on creating seamless user experiences by tailoring the embedded visuals to the specific needs of the application, ensuring consistent styling and branding.
Specifically, I've used the Power BI REST API to manage embedding tokens, ensuring secure access to the reports. I've also worked with row-level security (RLS) to filter data based on the user accessing the application. Additionally, I have experience optimizing performance by carefully selecting the appropriate embedding configuration and leveraging caching mechanisms.
23. How would you handle a situation where you need to combine data from multiple data sources with different granularities?
When combining data from multiple sources with differing granularities, I'd first identify the target granularity. This often involves aggregating data from finer granularities to match the coarser ones. For example, if I have daily sales data and monthly marketing spend data, I might aggregate the daily sales to monthly totals to align with the marketing data. Common techniques include aggregation (sum, average, count), disaggregation (less common and requires careful consideration as it involves assumptions to distribute coarser data), and using appropriate join keys at the correct granularity level.
Next, I'd consider potential data loss or inaccuracies introduced during aggregation or disaggregation. It's crucial to document these transformations and understand their impact on the final analysis. SQL or Python with libraries like Pandas are invaluable here. Specifically, using GROUP BY in SQL for aggregation or pandas.resample() or pandas.groupby() in Python enables granular control. Finally, always validate the combined data to ensure accuracy and consistency across all sources.
24. Explain your understanding of the VertiPaq engine and how it impacts Power BI performance.
The VertiPaq engine is the in-memory analytics engine that powers Power BI. It uses columnar storage and aggressive compression techniques to store data efficiently, enabling extremely fast query performance. Instead of storing data row by row like a traditional database, VertiPaq stores it column by column. This is beneficial because calculations often involve aggregating values within a single column.
VertiPaq's impact on Power BI performance is significant. By loading data into memory and using compression, it reduces the need for disk I/O, leading to quicker data retrieval and faster report rendering. This is why Power BI can handle large datasets with reasonable speed. The DAX query language is optimized to work with VertiPaq, further contributing to the overall performance and enabling complex calculations on the data model.
25. Describe how you would implement a solution for users to provide feedback on Power BI reports.
I would implement a feedback solution using a combination of Power BI features and external tools. First, I'd embed a Power Apps visual directly into the Power BI report. This Power App would contain a simple form with fields for feedback type (e.g., bug report, suggestion, praise), a text area for detailed comments, and optionally, a rating scale. The Power App would then save this feedback data to a data source like a SharePoint list or a Dataverse table.
Second, I would create a separate Power BI report to analyze the feedback data collected. This report would allow report creators to monitor feedback trends, identify common issues, and track resolution progress. I would also consider setting up email notifications using Power Automate to alert report developers when new feedback is submitted, ensuring timely responses and improvements to the reports. This ensures a closed-loop feedback mechanism.
Expert Power BI interview questions
1. How would you optimize a Power BI report that is performing slowly, and what are the key areas to investigate?
To optimize a slow Power BI report, I'd start by investigating these key areas: Data Source Performance: Ensure the underlying data sources (databases, APIs, etc.) are optimized. Slow queries or connections there will bottleneck everything. Use tools like SQL Server Profiler or database query analyzers to identify and resolve slow queries. Data Model Efficiency: Review the Power BI data model. Minimize unnecessary columns and tables. Use data types appropriately (e.g., integer instead of text for numeric IDs). Create relationships correctly between tables and avoid circular dependencies. DAX Optimization: Analyze DAX measures and calculated columns for inefficiencies. Avoid iterative functions like FILTER and RANKX where possible; consider using alternative approaches like calculated tables or optimized aggregation functions. Use variables to store intermediate results. Report Design: Simplify the report's visuals. Too many visuals, especially complex ones, can impact performance. Reduce the number of visuals on a single page. Use appropriate visual types. Consider using performance analyzer within Power BI to identify slow-rendering visuals.
2. Describe a scenario where you would choose DirectQuery over Import mode, and what are the trade-offs?
I would choose DirectQuery over Import mode when dealing with very large datasets that exceed the storage capacity of Power BI or when near real-time data is crucial. For example, consider analyzing rapidly changing sensor data from a manufacturing plant. Import mode would require frequent refreshes, which can be resource-intensive and may not provide up-to-the-minute insights. DirectQuery, on the other hand, queries the source database directly, ensuring that reports always reflect the latest data.
However, DirectQuery comes with trade-offs. Query performance can be significantly slower, especially if the underlying database is not optimized or if the queries are complex. Power BI features might be limited compared to Import mode (e.g., certain DAX functions are not supported). There can be limitations with transformations in Power Query. Database performance is key; poorly performing queries will directly impact the Power BI experience.
3. Explain the difference between row-level security (RLS) and object-level security (OLS) in Power BI, and how would you implement them?
Row-Level Security (RLS) filters data rows based on a user's attributes or roles. Each user only sees the rows they are authorized to view. This is implemented in Power BI using DAX expressions that define filters applied to tables. You configure RLS within Power BI Desktop and publish it with the report, defining roles and filters.
Object-Level Security (OLS) restricts access to specific tables or columns (objects) within the data model. Users may not even see the existence of restricted objects. OLS is configured at the semantic model/dataset level using the XMLA endpoint and requires Power BI Premium Capacity or Premium Per User (PPU) license. It's implemented by modifying the TMSL (Tabular Model Scripting Language) definition of the dataset to set permissions on specific objects.
4. How can you implement a custom visual in Power BI, and what are the considerations for performance and security?
To implement a custom visual in Power BI, you typically start by using the pbiviz tool, which is part of the Power BI Visuals SDK. This involves creating a new visual project using pbiviz new <visualName>, developing the visual using TypeScript, packaging it using pbiviz package, and then importing the .pbiviz file into Power BI Desktop or the Power BI service.
For performance, consider factors like minimizing DOM manipulations, optimizing data processing using efficient algorithms, and reducing the visual's footprint by lazy loading resources. Security considerations include sanitizing user inputs to prevent script injection, validating data against schema, and being aware of the capabilities enabled in the pbiviz.json file, especially external API calls. Ensure data is handled securely and respects user privacy. Regular security audits and updates to the visual's dependencies are crucial.
5. Describe your experience with Power BI Premium Capacity and its benefits for enterprise deployments.
I have experience working with Power BI Premium Capacity, mainly focusing on its administration and utilization within enterprise environments. I've been involved in capacity planning, workload management, and performance optimization to ensure optimal performance for our users.
Some of the key benefits I've observed include: enhanced performance and scalability to handle large datasets and complex reports, dedicated resources ensuring consistent performance even during peak usage, increased data refresh limits, support for larger models, the ability to distribute content to users without requiring them to have individual Power BI Pro licenses (with Premium Per User or organizational Premium), and access to advanced features like deployment pipelines and XMLA endpoint connectivity.
6. How would you design a Power BI solution for a large dataset with millions of rows, considering scalability and performance?
For a large dataset in Power BI, I'd prioritize DirectQuery or Aggregations over Import mode due to the volume. DirectQuery pushes the processing to the data source, leveraging its resources. For faster aggregations I would consider the following:
- Aggregations: Create summarized tables within Power BI using aggregations to reduce the data volume loaded into visuals.
- Optimize Data Model: Ensure proper data types and relationships. Remove unnecessary columns.
- Query Optimization: Write efficient DAX queries that minimize calculations, use variables.
- Incremental Refresh: For import mode, consider incremental refresh to only update recent data. This avoids a full refresh each time.
- Premium Capacity: Use Power BI Premium for increased processing power and storage.
7. Explain the use of deployment pipelines in Power BI and how they streamline the release process.
Deployment pipelines in Power BI automate the release process for Power BI content (reports, dashboards, datasets) across different environments (e.g., development, test, production). They streamline release management by providing a structured workflow and version control. Specifically, they allow you to:
- Develop and Test: Create and modify content in a development environment.
- Promote Changes: Move the content through the pipeline stages (e.g., from Dev to Test and then to Prod) with a click, applying necessary configuration changes between stages (like dataset connections).
- Automate Testing: Facilitate testing in each stage before promoting to the next, ensuring quality.
- Version Control: Track changes and revert to previous versions if needed.
- Reduce Errors: Minimize manual intervention, reducing the risk of human errors during deployment. Parameterization enables streamlined environment-specific configuration. For example dataset connection strings or report parameters can be updated as the content is deployed into different environments.
8. How do you monitor and troubleshoot performance issues in Power BI reports and dashboards?
To monitor and troubleshoot Power BI performance, I utilize several techniques. I start with Power BI Performance Analyzer to identify slow-loading visuals. This tool reveals the query execution time, rendering time, and other performance metrics for each visual. DAX Studio is also useful for analyzing and optimizing DAX queries. Furthermore, I monitor the Power BI service's capacity usage via the Admin portal to identify potential resource constraints or gateway issues.
For troubleshooting, I focus on optimizing DAX query performance by reviewing formula efficiency and cardinality estimates. I also consider data model size reduction techniques, such as removing unnecessary columns or aggregating data. I check for issues like complex relationships, unoptimized data types, and inefficient filters that might impact performance. Finally, I profile the data source to ensure data is being retrieved efficiently.
9. Describe the process of integrating Power BI with other Azure services like Azure Synapse Analytics or Azure Data Lake Storage.
Integrating Power BI with Azure services like Azure Synapse Analytics or Azure Data Lake Storage (ADLS) typically involves connecting to these services as data sources within Power BI Desktop or the Power BI service. For Azure Synapse Analytics, you'd use the Azure Synapse Analytics (SQL DW) connector. You'll need the server name, database name, and authentication credentials. Power BI then queries Synapse directly, leveraging its compute power for data processing. For ADLS, you'd use the Azure Data Lake Storage Gen2 connector, providing the ADLS account URL or storage account name and file system.
Once connected, you can import or use DirectQuery to access the data. DirectQuery is often preferred for large datasets in Synapse or ADLS as it avoids importing the data into Power BI, relying on the source system for querying. Power BI can also use Azure Analysis Services as a middle tier or publish reports to a Power BI Embedded solution hosted on Azure for broader access and scalability.
10. What are the best practices for version control and collaboration in Power BI development projects?
Best practices for version control and collaboration in Power BI development include using Git with a service like Azure DevOps, GitHub, or GitLab. Store your PBIX files, dataflows, and any custom visuals in the repository. Use branching strategies for features and fixes, and pull requests for code review. Smaller PBIX files work better with Git. Consider modularizing reports into smaller components or using the Power BI REST APIs to manage parts of the report.
For collaboration, establish clear roles and responsibilities. Use workspaces effectively to manage access and permissions. Document your development process, including naming conventions, data source connections, and any custom DAX formulas. Have a consistent deployment pipeline using Power BI deployment pipelines or custom scripting to move content between development, test, and production environments.
11. How can you implement advanced analytics techniques like forecasting or clustering in Power BI using DAX or R/Python?
In Power BI, you can implement advanced analytics techniques such as forecasting and clustering using a combination of DAX and external tools like R or Python.
For forecasting, DAX provides built-in time intelligence functions. Use these to calculate moving averages, year-over-year growth, or create custom time series analysis. Example:
Calculate(SUM(Sales), DATESYTD(Date))
For more advanced forecasting, integrate R or Python scripts directly into Power BI. You can pass data from your Power BI model to the R/Python script, perform the forecasting using libraries like forecast in R or scikit-learn in Python, and then return the results back to Power BI for visualization. Clustering can be achieved similarly using R or Python scripts executed within Power BI leveraging libraries such as kmeans.
12. Explain the concept of incremental refresh in Power BI and how it improves data refresh performance.
Incremental refresh in Power BI enables you to refresh only the data that has changed, rather than refreshing the entire dataset. This significantly improves refresh performance, especially for large datasets with frequently updated data. By partitioning the data based on dates, Power BI can identify and refresh only the new or updated partitions.
Incremental refresh works by filtering data based on the RangeStart and RangeEnd parameters in Power Query. These parameters define the date range for the data to be refreshed. Power BI automatically updates these parameters during each refresh, ensuring that only the relevant data is processed. This reduces refresh times, minimizes resource consumption, and makes the Power BI reports and dashboards more responsive.
13. Describe a challenging data modeling scenario you have encountered in Power BI, and how you resolved it.
One challenging scenario I faced was dealing with a many-to-many relationship between a sales table and a product category table. Direct relationships in Power BI led to inflated or incorrect figures due to the inherent ambiguity. To resolve this, I created a bridge table. This bridge table contained unique combinations of sales IDs and product category IDs, effectively acting as a junction between the two original tables. I then established one-to-many relationships between the sales table and the bridge table, and between the product category table and the bridge table. Using this setup, along with appropriate measures (like CALCULATE with appropriate filters), I could accurately analyze sales figures by product category without data duplication or misrepresentation. For example, to get total sales for category 'X', the measure would be Total Sales for X = CALCULATE(SUM(Sales[SalesAmount]), FILTER(BridgeTable, BridgeTable[CategoryID] = 'X'))
14. How would you implement a data governance strategy for Power BI deployments in an organization?
Implementing a data governance strategy for Power BI involves several key steps. First, establish clear data ownership and stewardship roles to assign responsibility for data quality and accuracy. Next, define data standards and policies regarding data definitions, naming conventions, and data lineage tracking. Implement data quality monitoring and validation rules within Power BI and at the source system level to ensure data accuracy and reliability. Enforce security policies, including row-level security and data masking, to protect sensitive information. Finally, establish a formal process for managing Power BI content, including version control, deployment procedures, and usage monitoring. Data cataloging to centralize the metadata of all data assets and provide a single place to discover and understand data.
15. Explain the use of Power BI REST APIs for automating tasks and integrating with other applications.
Power BI REST APIs enable automation and integration by providing programmatic access to Power BI resources. You can use them to automate tasks like refreshing datasets, publishing reports, managing users and permissions, and exporting data. This is particularly useful for streamlining workflows, automating report distribution, and incorporating Power BI data into custom applications.
For example, to refresh a dataset, you might use a POST request to the https://api.powerbi.com/v1.0/myorg/datasets/{datasetId}/refreshes endpoint, after obtaining an access token. The access token is typically obtained by authenticating against Azure Active Directory. This allows for scheduled refreshes or refreshes triggered by external events, improving data freshness and reducing manual intervention. These APIs support various programming languages, making it relatively easy to integrate Power BI with diverse systems and workflows.
16. How do you handle error handling and data quality issues in Power BI dataflows?
In Power BI dataflows, I handle error handling and data quality issues through several mechanisms. Dataflows have built-in data profiling capabilities that help identify anomalies, nulls, and inconsistencies early in the data ingestion process. I use these insights to implement data cleansing steps directly within the dataflow using Power Query transformations (M language). For example, I might use try...otherwise blocks to gracefully handle errors during data type conversions or use conditional logic to replace invalid values with default or calculated values.
For more complex scenarios, I leverage the dataflow's diagnostic logging. I monitor the dataflow refresh history in the Power BI service to identify error patterns or performance bottlenecks. By examining the detailed error messages, I can pinpoint the exact step causing the issue and adjust the transformation logic accordingly. I can also implement data validation rules using conditional columns to flag rows that don't meet specific criteria. These flagged rows can then be either filtered out or directed to a separate 'error' table for further investigation and correction.
17. Describe your experience with using Power BI Embedded for integrating Power BI content into custom applications.
I've worked with Power BI Embedded to seamlessly integrate Power BI reports and dashboards into custom applications, providing users with interactive data visualizations within their familiar workflows. My experience includes generating embed tokens to secure access to Power BI content, configuring embedding settings, and handling user authentication. I've also implemented row-level security (RLS) within the embedded reports to ensure that users only see the data relevant to them. This involved configuring roles and rules within Power BI Desktop and passing the appropriate identity information through the embed token.
Specifically, I've utilized the Power BI REST APIs and the Power BI JavaScript API to control the embedded report's behavior. For instance, I've used JavaScript to dynamically filter the report based on user selections in the host application. I am familiar with handling events such as report load, page change, and data selection through the JavaScript API. I also have experience troubleshooting embedding issues, such as token expiration and permission problems, and optimizing the embedding performance for large datasets.
18. How would you optimize a complex DAX calculation for performance, and what tools or techniques would you use?
To optimize a complex DAX calculation, I'd focus on reducing the iterator workload and improving filter context. I'd start by identifying the most time-consuming parts of the calculation using Performance Analyzer in Power BI Desktop. Then, I'd refactor DAX to use more efficient functions like SUMX with optimized filter conditions, avoid CALCULATE where possible by directly incorporating filters, and utilize variables to store intermediate results and prevent redundant calculations. I'd also look at optimizing the data model by reducing cardinality on relationships and optimizing column data types. VertiPaq Analyzer can also help identify high-cardinality columns and inefficient data types.
Furthermore, I would consider using aggregation tables to pre-calculate results for commonly used aggregations. This can significantly speed up calculations, especially for large datasets. Finally, ensuring efficient data loading practices and proper indexing in the data source can have a ripple effect on DAX performance. Also, verify that relationships are set correctly with appropriate cross filter direction.
19. Explain the process of creating and managing workspaces in Power BI, and their role in collaboration.
In Power BI, workspaces are containers for dashboards, reports, datasets, and workbooks. Creating a workspace involves clicking on 'Workspaces' then 'Create workspace' in the Power BI Service and assigning a name and configuring settings like privacy. Workspaces are managed by assigning roles (Admin, Member, Contributor, Viewer) to users, controlling their access and permissions regarding content creation, editing, sharing, and viewing.
Workspaces significantly enhance collaboration by providing a centralized location for teams to access and work on Power BI content. Different roles enable controlled access and modification capabilities, preventing unauthorized changes and ensuring data governance. This shared environment facilitates team development, peer review, and efficient distribution of insights across the organization.
20. How do you ensure data security and compliance when connecting Power BI to sensitive data sources?
When connecting Power BI to sensitive data sources, I prioritize both security and compliance using a multi-faceted approach. Firstly, I leverage Power BI's built-in security features, such as role-level security (RLS) and object-level security (OLS), to restrict data access based on user roles and permissions. Data encryption, both at rest and in transit, is crucial, ensuring the data is protected from unauthorized access. We can also utilize Power BI's data loss prevention (DLP) policies to prevent sensitive data from leaving the Power BI environment.
Secondly, I adhere to compliance regulations (e.g., GDPR, HIPAA) by implementing data masking and anonymization techniques where applicable. I also ensure thorough auditing and monitoring of data access and usage within Power BI to track activities and identify potential security breaches. Data source credentials should be securely stored and managed, preferably using Azure Key Vault, and multi-factor authentication (MFA) should be enforced for all users. Finally, regular security assessments and penetration testing are performed to identify vulnerabilities and ensure that the implemented security measures are effective.
21. Describe your approach to documenting Power BI solutions and ensuring maintainability.
My approach to documenting Power BI solutions focuses on clarity and accessibility for both technical and non-technical users. I typically create a comprehensive documentation package that includes: 1) A data source inventory detailing all sources used, their connection methods, and refresh schedules. 2) A data model diagram illustrating table relationships, calculated columns, and measures, along with descriptions of key calculations. 3) Report-level documentation outlining the purpose of each report, key visuals, filters, and any DAX expressions used. 4) I also like to use Power BI's built-in description fields extensively for datasets, tables, columns, and measures. This helps others immediately understand the purpose of a data element.
To ensure maintainability, I follow best practices for Power BI development, such as using clear naming conventions, parameterizing data source connections, and implementing version control for PBIX files (using Git with considerations for binary files). This, coupled with thorough documentation, makes solutions easier to update, troubleshoot, and enhance over time.
22. What are the considerations for designing Power BI reports for mobile devices, and how do you optimize the user experience?
When designing Power BI reports for mobile, prioritize simplicity and readability. Key considerations include using a mobile-friendly layout with a single-column design to avoid horizontal scrolling, optimizing visuals for smaller screen sizes (larger fonts, clear labels), and minimizing the number of visuals per page to prevent clutter. Performance is crucial; so, reduce data volumes, optimize DAX queries, and use summarized data where appropriate. Design for touch by ensuring interactive elements are adequately sized and spaced apart. Leverage Power BI's mobile-specific features such as phone-optimized dashboards and mobile report themes.
To optimize user experience, focus on interactivity and navigation. Implement clear and intuitive navigation patterns. Use bookmarks and buttons to allow users to quickly jump to specific sections or views. Leverage drill-down and drill-through features to enable users to explore data in more detail. Test the report thoroughly on various mobile devices and screen sizes to ensure optimal viewing and functionality. Consider using the Power BI mobile app's offline capabilities for scenarios where users may not have continuous connectivity.
23. Explain the benefits and drawbacks of using calculated columns versus measures in Power BI.
Calculated columns add data to your model, increasing its size and potentially slowing performance. They are evaluated at refresh time, making them static. Benefits include being able to use them in slicers, axes, and legends, and they can simplify complex calculations for use in visuals.
Measures, on the other hand, are calculated dynamically at query time, leading to smaller model sizes and faster performance. They don't take up storage space like calculated columns, as they only store the formula. Drawbacks include not being usable directly as slicers, axes, or legends and can be more complex to write for iterative calculations.
Power BI MCQ
Question 1.
Which DAX expression correctly calculates the total sales amount for all products in the 'Red' color category?
Options:
Question 2.
Which of the following DAX functions is most suitable for filtering data based on multiple AND conditions in Power BI?
Options:
Question 3.
Which Power Query function is used to transform multiple columns into attribute-value pairs, effectively unpivoting the data?
Options:
Question 4.
Which of the following Power BI visualizations is BEST suited for displaying hierarchical data with proportional relationships, where the size of each segment represents its contribution to the whole?
- A) Treemap
- B) Funnel Chart
- C) Scatter Chart
- D) Line Chart
Options:
Question 5.
Which Power Query function is used to merge two tables based on a common column, similar to a SQL JOIN operation?
A) Append B) Merge C) Group By D) Pivot
Options:
Question 6.
Which DAX function is most suitable for calculating a running total of sales by month in Power BI?
Options:
Question 7.
You have imported a dataset into Power BI using Power Query, and some columns contain errors represented as '#ERROR!'. Which Power Query steps would you use to replace these errors with a specified value, such as '0'?
Options:
Question 8.
Which DAX function is most suitable for calculating the average sales for each month, considering the past 3 months as a rolling window?
a) AVERAGEX(LASTN(3, SalesTable, SalesDate), SalesAmount)
b) CALCULATE(AVERAGE(SalesTable[SalesAmount]), DATESINPERIOD(SalesTable[SalesDate], LASTDATE(SalesTable[SalesDate]), -3, MONTH))
c) CALCULATE(AVERAGE(SalesTable[SalesAmount]), DATESBETWEEN(SalesTable[SalesDate], ENDOFMONTH(DATEADD(LASTDATE(SalesTable[SalesDate]), -3, MONTH)), LASTDATE(SalesTable[SalesDate])))
d) AVERAGEX(DATESINPERIOD(SalesTable[SalesDate], LASTDATE(SalesTable[SalesDate]), -3, MONTH), SalesTable[SalesAmount])
Options:
Question 9.
Which of the following methods is the correct way to create a calculated column in Power BI using DAX to calculate the 'Profit Margin' based on 'Sales' and 'Cost' columns?
a) Profit Margin = Sales - Cost
b) Profit Margin = DIVIDE(Sales, Cost)
c) Profit Margin = Sales / Cost
d) Profit Margin = DIVIDE(Sales - Cost, Sales)
Options:
Question 10.
What is the most efficient method to import data from multiple Excel sheets, where each sheet has the same structure, into a single table in Power BI?
Options:
Question 11.
Which DAX function is most suitable for calculating the difference between two dates (e.g., start date and end date) in Power BI, returning the result in a specified interval (e.g., days, months, years)?
A) CALCULATE B) DATEDIFF C) DATEVALUE D) YEARFRAC
Options:
Question 12.
Which of the following methods is the correct way to connect to an OData feed in Power BI?
Options:
Question 13.
Which Power Query function is most suitable for creating a custom column based on multiple conditional checks (i.e., IF-THEN-ELSE logic)?
- A)
Table.AddColumnwith a simple arithmetic operation - B)
Table.TransformColumnswith a type conversion - C)
Table.AddColumnwith a nestedifstatement within the each clause - D)
Table.ReplaceValuewith a specified replacement value
Options:
Question 14.
You need to create a Power BI measure that displays the percentage contribution of each product's sales to the total sales. Which DAX function is most suitable for achieving this?
Options:
Question 15.
Which Power Query function is most suitable for grouping rows in a table based on the values in a specific column and then calculating an aggregate (e.g., sum, average) for each group?
a) Table.AddColumn b) Table.SelectRows c) Table.Group d) Table.TransformColumns
Options:
Question 16.
Which of the following is the correct approach to implement Row-Level Security (RLS) in Power BI based on a user's email address?
Options:
Question 17.
Which of the following is the most efficient method for creating a dynamic date range slicer in Power BI that allows users to select a date range relative to the current date (e.g., 'Last 7 Days', 'Next 30 Days', 'Year to Date')?
a) Manually create separate measures for each date range option, and then use a slicer to choose between the measures.
b) Create a calculated table with date ranges defined using DAX functions and use that table as the source for the slicer.
c) Utilize the built-in relative date filtering options within the filter pane for the visual.
d) Import a pre-built custom visual from the AppSource marketplace specifically designed for dynamic date ranges.
Options:
Question 18.
Which of the following is the correct method to create a drill-down visualization (e.g., Year > Quarter > Month) in Power BI?
Options:
Question 19.
You need to create a dynamic 'Sales Target' parameter in Power BI that allows users to adjust the target and see its impact on 'Sales Variance'. Which method is most appropriate?
Options:
Question 20.
Which DAX expression correctly ranks products based on their sales within each product category?
- A)
RANKX(ALL(Products), [Total Sales], , ASC, Dense) - B)
RANKX(ALLSELECTED(Products), [Total Sales], , DESC, Dense) - C)
RANKX(FILTER(ALL(Products[Category]),[Total Sales]),[Total Sales],,DESC,Dense) - D)
RANKX(FILTER(ALL(Products[ProductName]),ALLEXCEPT(Products,Products[Category])),[Total Sales],,DESC,Dense)
Options:
Question 21.
Which of the following techniques is MOST effective for optimizing the performance of a Power BI report that is struggling with very large datasets?
Options:
Question 22.
Which of the following methods is the MOST appropriate to create a report-level filter in Power BI that displays data only for the last quarter based on the current date?
Options:
Question 23.
You need to add a new column to your 'Sales' table that categorizes sales amounts into 'Low', 'Medium', and 'High' based on the following criteria:
- 'Low': Sales Amount < 500
- 'Medium': 500 <= Sales Amount < 1000
- 'High': Sales Amount >= 1000
Which DAX expression would correctly achieve this?
Options:
Question 24.
You need to ensure that a Power BI dataset is automatically updated whenever the data in the underlying SQL Server database changes. Which of the following is the MOST appropriate method to achieve this?
A) Schedule a refresh in the Power BI Service settings. B) Use a Personal Gateway and configure incremental refresh. C) Configure a DirectQuery connection to the SQL Server database. D) Use an On-premises data gateway in Standard or Enterprise mode and configure a scheduled refresh.
Options:
Question 25.
Which DAX function is most suitable for calculating the year-to-date (YTD) sales?
Options:
Which Power BI skills should you evaluate during the interview phase?
Assessing a candidate's full capabilities in a single interview is always challenging. However, when evaluating Power BI skills, focusing on some core competencies can provide valuable insights. This section will highlight key Power BI skills to evaluate during the interview process.
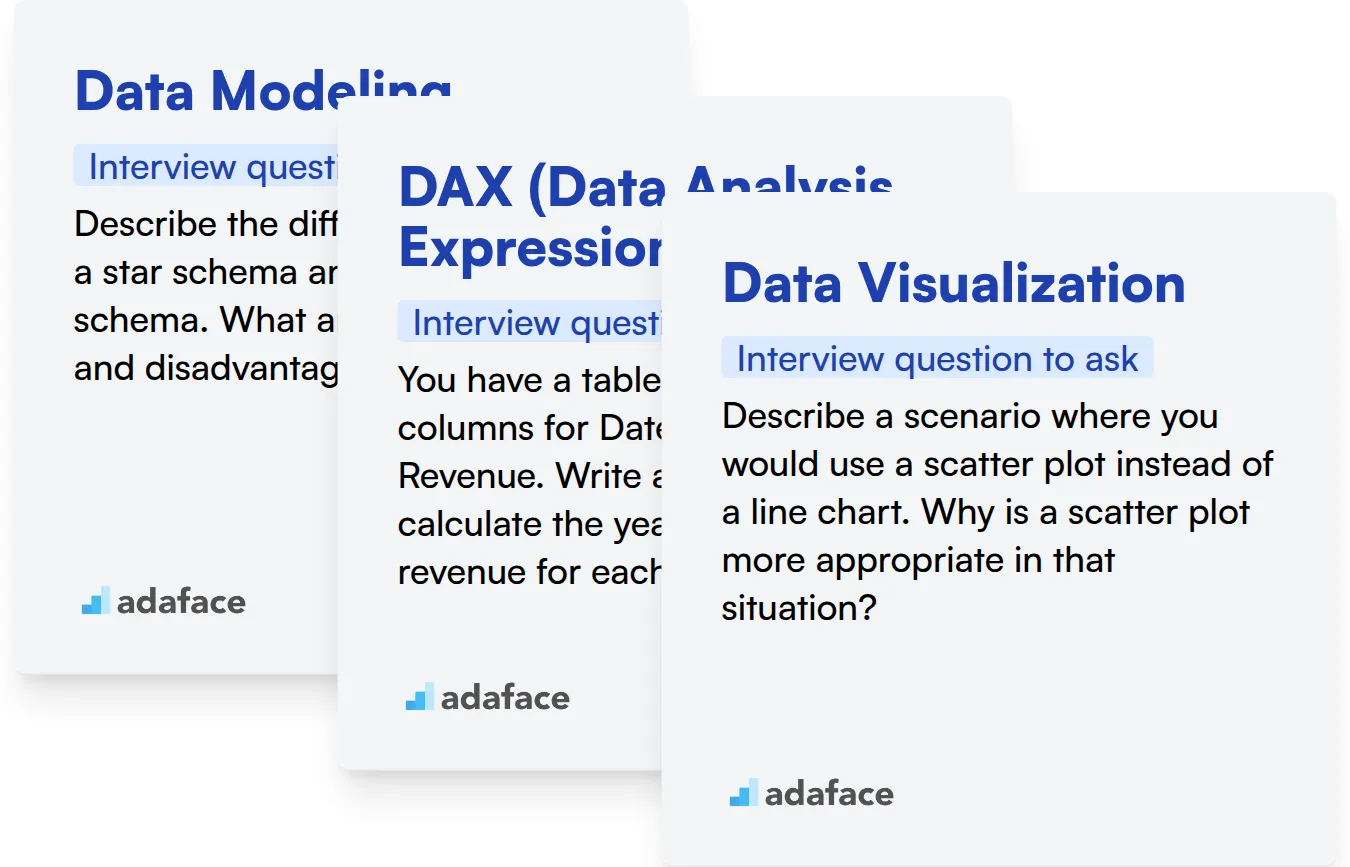
Data Modeling
You can use an assessment test with relevant MCQs to quickly filter candidates with strong data modeling skills. Consider using a Power BI assessment to evaluate a candidate’s understanding of data modeling concepts.
To assess this skill, you can ask targeted interview questions. The following question is tailored to data modeling specifically.
Describe the difference between a star schema and a snowflake schema. What are the advantages and disadvantages of each?
Look for the candidate to explain the core differences and trade-offs. A good answer will touch upon query performance, data redundancy, and ease of understanding.
DAX (Data Analysis Expressions)
To gauge a candidate's DAX proficiency, use an assessment test with DAX-specific questions. Adaface's Power BI test evaluates DAX skills effectively.
Present candidates with a scenario-based question to understand their practical knowledge of DAX. Here's one such question to try:
You have a table of sales data with columns for Date, Product, and Revenue. Write a DAX measure to calculate the year-to-date (YTD) revenue for each product.
The ideal answer will show an understanding of DAX functions like TOTALYTD and how to use them with the CALCULATE function. Look for clarity and correctness in their DAX formula.
Data Visualization
To quickly evaluate data visualization skills, use assessment tests that include questions on chart selection and best practices. You can find related questions in a Power BI test.
Ask targeted questions to assess a candidate's data visualization abilities. Here's one example:
Describe a scenario where you would use a scatter plot instead of a line chart. Why is a scatter plot more appropriate in that situation?
The candidate should explain that scatter plots are suited for showing the relationship between two continuous variables. A good response highlights the ability of scatter plots to reveal clusters, outliers, and correlations that a line chart would not.
Hire Skilled Power BI Professionals with the Right Tools
Looking to bring on board a Power BI expert? It's important to accurately gauge their skills to ensure they can deliver impactful insights. This involves verifying their understanding of data modeling, visualization, and report building.
The most direct way to assess these skills is through a dedicated skills test. Consider using the Power BI Online Test to evaluate candidates' abilities.
Once you've used the skills test to identify top performers, you can confidently shortlist candidates for interviews. This allows you to focus your interview efforts on the most promising applicants.
Ready to streamline your hiring process? Explore our online assessment platform to get started and find the perfect Power BI professional for your team.
Power BI Online Test
25 mins | 15 MCQs
The Power BI test evaluates candidate's ability to build data models, select and execute appropriate visualizations, create dashboards to explore data and answer queries, publish and share insightful reports and run analytics using DAX language in Power BI.
Try Power BI Online Test
Download Power BI interview questions template in multiple formats
Power BI Interview Questions FAQs
What are some basic Power BI interview questions?
Basic questions cover fundamental concepts like Power BI Desktop, data sources, and report creation. They assess the candidate's familiarity with the Power BI interface and core functionalities.
What do intermediate Power BI interview questions focus on?
Intermediate questions explore data modeling, DAX functions, and data visualization techniques. These questions gauge the candidate's ability to manipulate data and create insightful reports.
What kind of advanced Power BI interview questions should I ask?
Advanced questions cover topics like Power BI Service, dataflows, and advanced analytics. They evaluate the candidate's understanding of Power BI's cloud capabilities and ability to handle complex scenarios.
What expert-level Power BI interview questions should I consider?
Expert-level questions challenge candidates on performance optimization, custom visuals, and integration with other Azure services. They determine if the candidate can lead Power BI initiatives and tackle the toughest problems.
Why is it important to ask the right Power BI interview questions?
Asking targeted questions helps you accurately assess a candidate's skills and experience, ensuring you hire someone who can effectively leverage Power BI for your organization's needs.
What should I look for in a candidate's answers to Power BI interview questions?
Look for clarity, accuracy, and practical examples of how the candidate has applied their Power BI knowledge. A strong candidate should be able to explain concepts clearly and demonstrate problem-solving abilities.
40 min skill tests.
No trick questions.
Accurate shortlisting.
We make it easy for you to find the best candidates in your pipeline with a 40 min skills test.
Try for freeRelated posts
Free resources

Join 1200+ companies in 80+ countries.
Try the most candidate friendly skills assessment tool today.

40 min tests.
No trick questions.
Accurate shortlisting.
No trick questions.
Accurate shortlisting.