
9 general Data Analysis interview questions and answers
8 advanced Data Analysis interview questions and answers to evaluate senior analysts
7 Data Analysis interview questions and answers related to data visualization

Hiring the right data analyst is key to turning raw data into actionable insights. To ensure you identify the best candidates, it's essential to ask the right Data Analysis interview questions.
This post outlines a range of questions aimed at assessing junior to senior analysts, inspecting their statistical methods knowledge, and evaluating their data visualization skills. By utilizing these questions, you can efficiently gauge the depth of a candidate's expertise.
Using these questions will help you pinpoint top talent and enhance your recruitment process. Complement this with our Data Analysis Test to ensure a thorough evaluation before the interview stage.
Table of contents
9 general Data Analysis interview questions and answers
20 Data Analysis interview questions to ask junior analysts
8 advanced Data Analysis interview questions and answers to evaluate senior analysts
12 Data Analysis questions related to statistical methods
7 Data Analysis interview questions and answers related to data visualization
Which Data Analysis skills should you evaluate during the interview phase?
Leverage Data Analysis Skills Tests and Interview Questions to Identify Top Candidates
Download Data Analysis interview questions template in multiple formats
9 general Data Analysis interview questions and answers
To help you navigate the often challenging waters of data analysis interviews, we've compiled a list of nine essential questions and answers. These are designed to gauge whether candidates possess the fundamental skills and thought processes needed for data analysis roles.
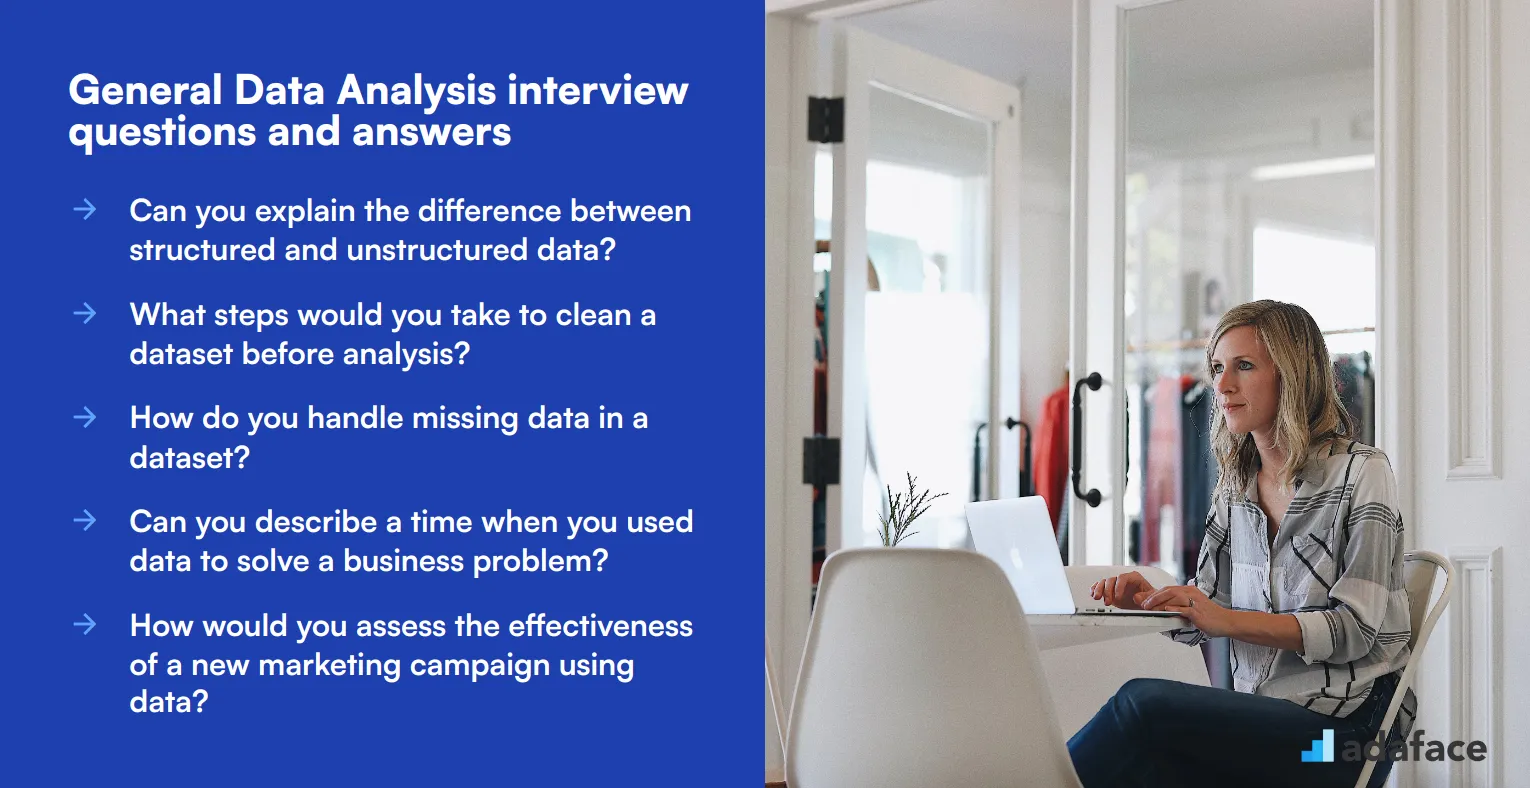
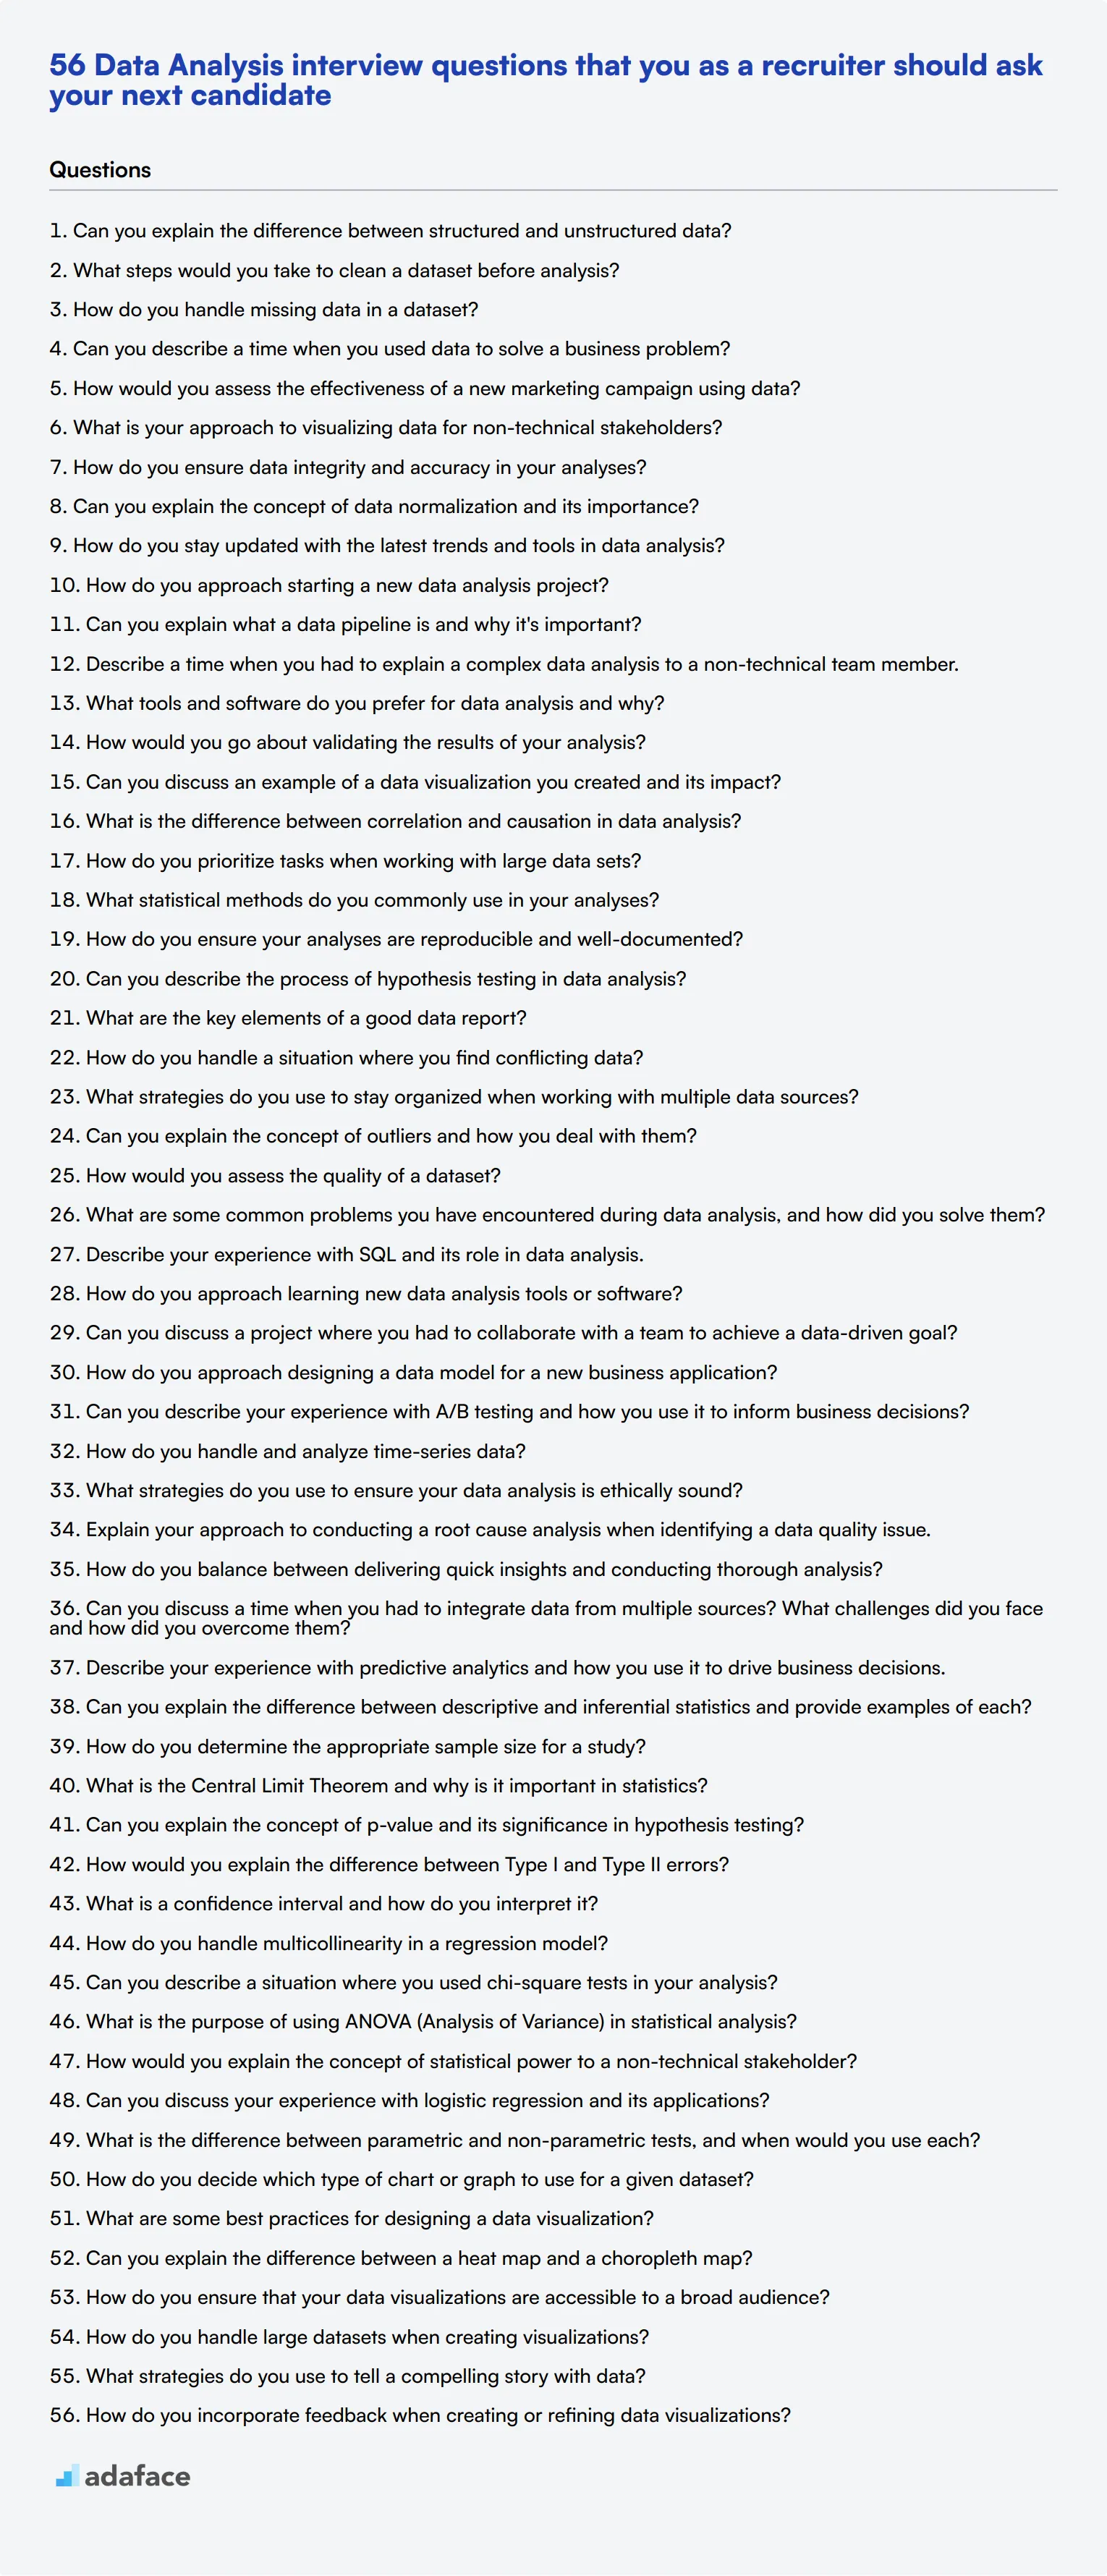
1. Can you explain the difference between structured and unstructured data?
Structured data is highly organized and easily readable by machine learning algorithms. It's typically stored in a tabular format with rows and columns, like databases and spreadsheets.
Unstructured data, on the other hand, lacks a predefined format or organization. Examples include text documents, images, and social media posts. Because it's not easily searchable, analyzing unstructured data often requires advanced techniques like natural language processing.
An ideal answer should demonstrate the candidate's understanding of both data types and their use cases, reflecting the practical experience of working with them.
2. What steps would you take to clean a dataset before analysis?
Cleaning a dataset involves several steps: removing duplicates, handling missing values, correcting data types, and addressing outliers. Each step ensures the integrity and quality of the data used for analysis.
Candidates should mention techniques like imputation for missing values, normalization for scaling, and the use of tools like Python’s Pandas library for data manipulation.
Look for a clear, methodical approach that shows the candidate's ability to keep data accurate and consistent.
3. How do you handle missing data in a dataset?
There are several strategies for handling missing data, including deletion, imputation, and using algorithms that support missing values. The choice depends on the nature and extent of the missing data.
Imputation can be done using mean, median, or mode for numerical data and the most frequent value for categorical data. Advanced techniques might involve predictive models to estimate missing values.
A strong candidate will explain their approach based on the context, showing flexibility and understanding of different methods.
4. Can you describe a time when you used data to solve a business problem?
A strong answer will include a specific example where the candidate identified a business problem, collected and analyzed relevant data, and derived actionable insights.
For instance, they might discuss optimizing marketing campaigns, improving customer retention, or increasing operational efficiency by analyzing sales data or customer feedback.
Look for evidence of measurable impact and a clear explanation of the data analysis process they followed.
5. How would you assess the effectiveness of a new marketing campaign using data?
To assess a marketing campaign's effectiveness, you would track key performance indicators (KPIs) such as conversion rates, click-through rates, and return on investment (ROI).
Data collection might involve web analytics tools, customer surveys, and sales data. Analyzing trends before, during, and after the campaign helps determine its impact.
Candidates should show an understanding of the importance of both quantitative and qualitative data in evaluating campaign success.
6. What is your approach to visualizing data for non-technical stakeholders?
Effective data visualization involves simplifying complex data into clear, understandable visuals like charts, graphs, and dashboards. Tools like Tableau, Power BI, and Python’s Matplotlib are commonly used.
It’s crucial to focus on the audience's needs, avoiding technical jargon and highlighting key insights. Storytelling techniques can help contextualize data and make it more relatable.
Candidates should demonstrate their ability to translate technical findings into actionable business insights that non-technical stakeholders can easily grasp.
7. How do you ensure data integrity and accuracy in your analyses?
Ensuring data integrity involves multiple steps, including data validation, regular audits, and maintaining detailed documentation. Using automated tools for data cleaning and validation can also minimize errors.
Cross-referencing data sources and performing sanity checks can further ensure accuracy. Keeping a clear data lineage helps track changes and maintain consistency.
Look for a systematic approach that emphasizes thoroughness and attention to detail, reflecting a candidate's commitment to high-quality analysis.
8. Can you explain the concept of data normalization and its importance?
Data normalization is the process of organizing data to minimize redundancy and improve data integrity. It involves structuring a database according to certain rules to ensure dependencies are properly enforced.
Normalization helps in efficient data storage and retrieval, reduces anomalies, and improves data consistency. Common forms include the First Normal Form (1NF), Second Normal Form (2NF), and Third Normal Form (3NF).
Candidates should show an understanding of the practical benefits of normalization and its impact on data management.
9. How do you stay updated with the latest trends and tools in data analysis?
Staying up-to-date involves continuous learning through online courses, industry blogs, webinars, and professional networks. Following influential data scientists on social media and participating in forums like Stack Overflow can also be beneficial.
Attending conferences and workshops, and obtaining certifications in tools and methodologies like advanced Excel skills or machine learning, can enhance knowledge and skills.
An ideal response will reflect a proactive approach to learning and a genuine interest in the field, demonstrating a commitment to professional growth.
20 Data Analysis interview questions to ask junior analysts
To determine whether your applicants have the right foundational skills for a junior data analyst, ask them some of these 20 targeted interview questions. Use this list to evaluate their technical capabilities and problem-solving approach, ensuring they can meet your organization's needs.
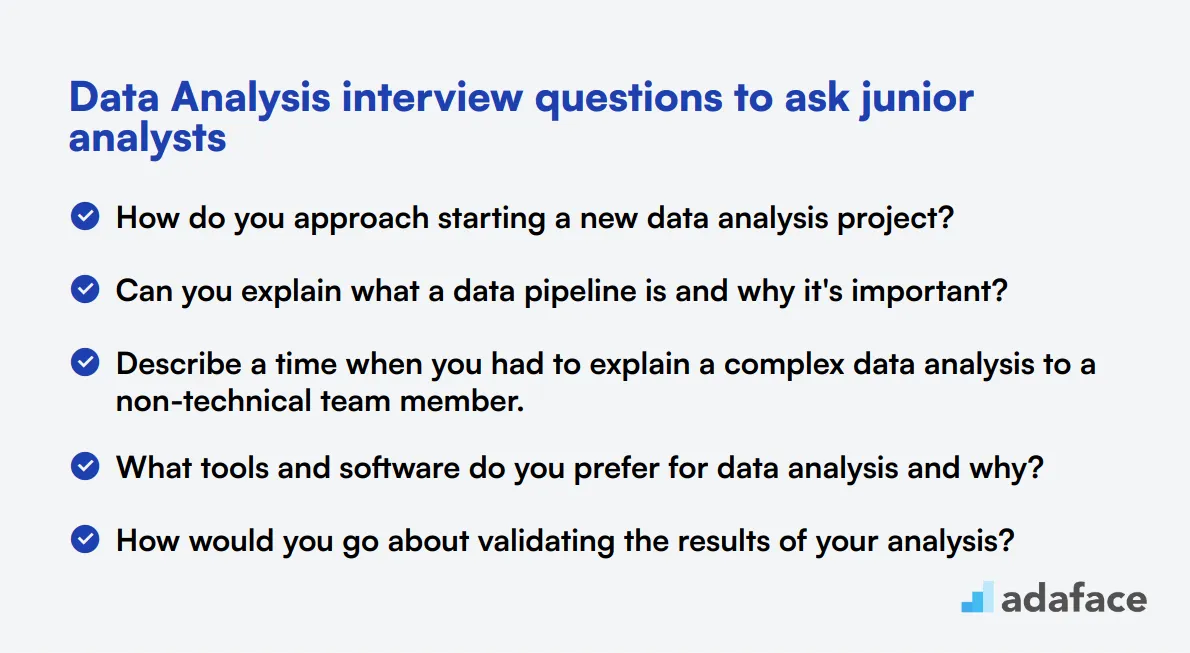
- How do you approach starting a new data analysis project?
- Can you explain what a data pipeline is and why it's important?
- Describe a time when you had to explain a complex data analysis to a non-technical team member.
- What tools and software do you prefer for data analysis and why?
- How would you go about validating the results of your analysis?
- Can you discuss an example of a data visualization you created and its impact?
- What is the difference between correlation and causation in data analysis?
- How do you prioritize tasks when working with large data sets?
- What statistical methods do you commonly use in your analyses?
- How do you ensure your analyses are reproducible and well-documented?
- Can you describe the process of hypothesis testing in data analysis?
- What are the key elements of a good data report?
- How do you handle a situation where you find conflicting data?
- What strategies do you use to stay organized when working with multiple data sources?
- Can you explain the concept of outliers and how you deal with them?
- How would you assess the quality of a dataset?
- What are some common problems you have encountered during data analysis, and how did you solve them?
- Describe your experience with SQL and its role in data analysis.
- How do you approach learning new data analysis tools or software?
- Can you discuss a project where you had to collaborate with a team to achieve a data-driven goal?
8 advanced Data Analysis interview questions and answers to evaluate senior analysts
Hiring a senior data analyst? These advanced interview questions will help you gauge whether your candidates have the deep expertise and strategic thinking needed to handle complex data challenges and drive impactful business decisions.
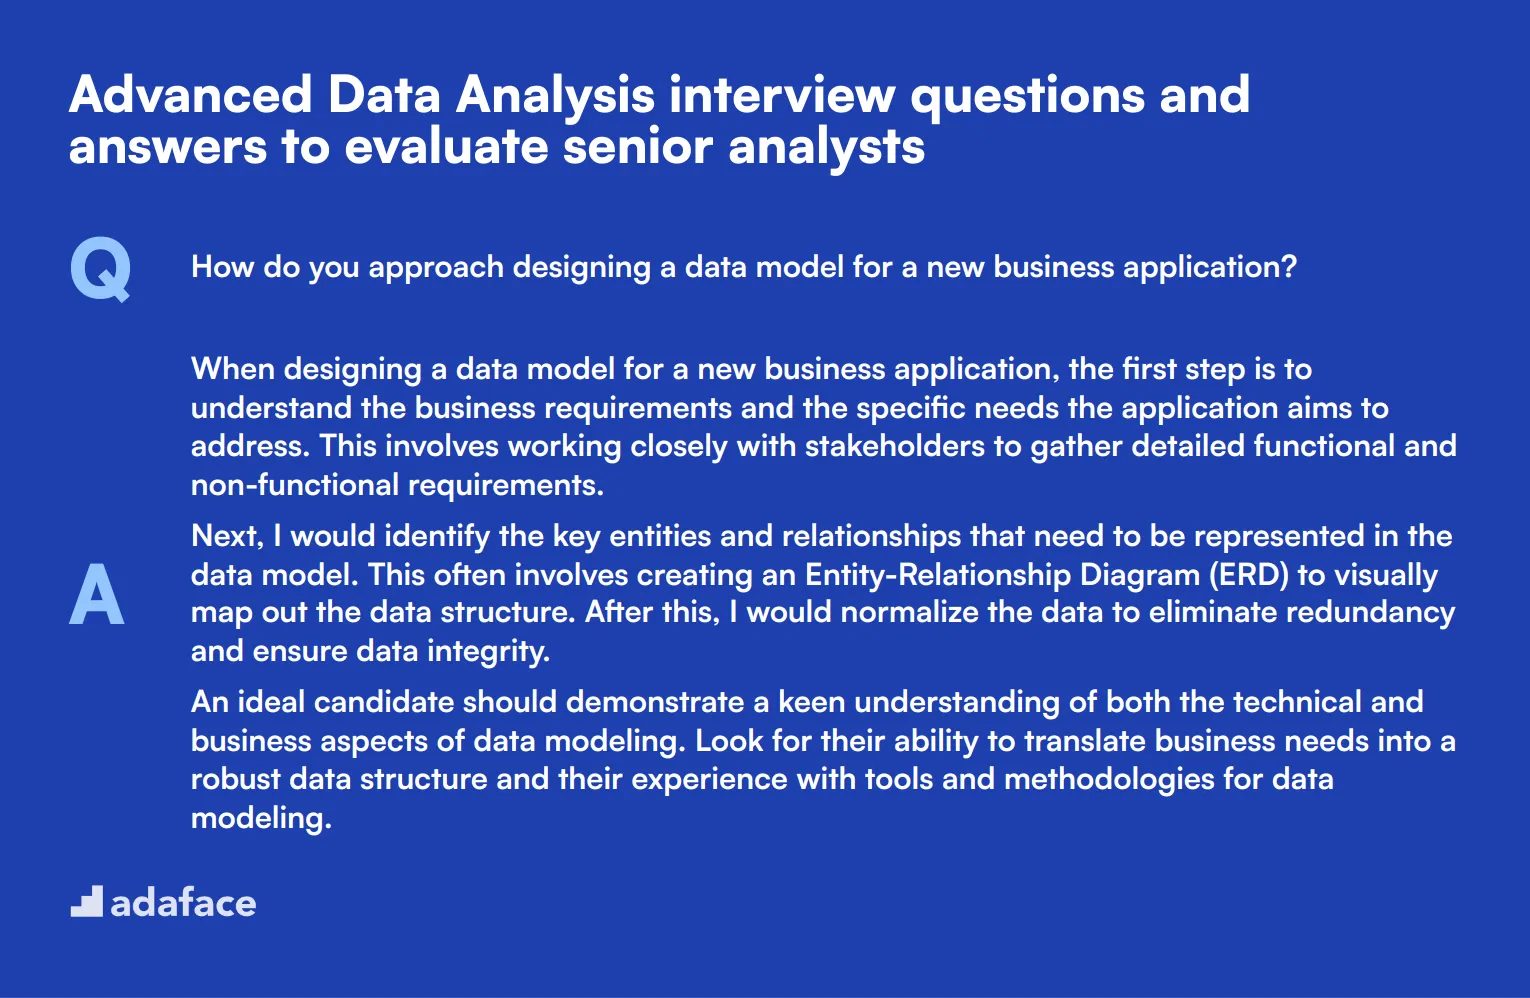
1. How do you approach designing a data model for a new business application?
When designing a data model for a new business application, the first step is to understand the business requirements and the specific needs the application aims to address. This involves working closely with stakeholders to gather detailed functional and non-functional requirements.
Next, I would identify the key entities and relationships that need to be represented in the data model. This often involves creating an Entity-Relationship Diagram (ERD) to visually map out the data structure. After this, I would normalize the data to eliminate redundancy and ensure data integrity.
An ideal candidate should demonstrate a keen understanding of both the technical and business aspects of data modeling. Look for their ability to translate business needs into a robust data structure and their experience with tools and methodologies for data modeling.
2. Can you describe your experience with A/B testing and how you use it to inform business decisions?
A/B testing is a method of comparing two versions of a webpage or app against each other to determine which one performs better. My experience with A/B testing involves setting up experiments to test changes in user experience, such as layout changes or new features, and measuring their impact on key metrics like conversion rates or user engagement.
I follow a rigorous process that includes defining a hypothesis, selecting a control and a test group, running the test for a statistically significant period, and analyzing the results using appropriate statistical methods. The insights gained from A/B testing help inform decisions by providing data-driven evidence on what works best for our users.
Candidates should highlight their experience with the practical aspects of A/B testing, including hypothesis formulation, experiment design, and result analysis. Look for evidence of their ability to derive actionable insights that drive business improvements.
3. How do you handle and analyze time-series data?
Analyzing time-series data involves several steps, starting with data preprocessing to handle any missing values or outliers. After ensuring data quality, I typically visualize the data to identify trends, seasonality, and any anomalies.
For analysis, I use techniques such as decomposition, smoothing methods, and forecasting models like ARIMA or exponential smoothing. These help in understanding the underlying patterns and making predictions based on historical data.
Ideal candidates should demonstrate proficiency in time-series analysis techniques and tools. They should also be able to explain how their analysis has led to meaningful insights or business decisions in past projects.
4. What strategies do you use to ensure your data analysis is ethically sound?
Ensuring ethical data analysis involves several strategies. Firstly, I adhere to data privacy laws and regulations, ensuring that any personally identifiable information (PII) is anonymized or handled with the utmost care. Secondly, I practice transparency by clearly communicating the methods and assumptions used in the analysis to stakeholders.
I also consider the potential impact of my analysis on different groups of people and aim to avoid biases that could lead to unfair or discriminatory outcomes. Regularly reviewing and auditing my work with a focus on ethical standards is also crucial.
Look for candidates who understand the importance of ethical considerations in data analysis. They should provide examples of how they have navigated ethical dilemmas and maintained integrity in their work.
5. Explain your approach to conducting a root cause analysis when identifying a data quality issue.
Conducting a root cause analysis for data quality issues starts with identifying and defining the problem. I then gather all relevant data and use tools like data profiling and validation checks to pinpoint where the issue originates.
Next, I employ techniques like the 5 Whys or Fishbone Diagram to drill down to the root cause. Once identified, I work on formulating and implementing a plan to address the root cause and prevent future occurrences.
Candidates should be able to articulate a structured approach to root cause analysis and provide examples of how they have successfully resolved data quality issues. Look for their problem-solving skills and attention to detail.
6. How do you balance between delivering quick insights and conducting thorough analysis?
Balancing quick insights with thorough analysis involves prioritizing tasks based on business impact and urgency. For quick insights, I rely on exploratory data analysis (EDA) and simple visualization techniques to provide immediate value.
For more thorough analysis, I allocate time for deeper dives into the data, using advanced statistical methods, data modeling, and validation techniques to ensure accuracy and reliability.
Ideal candidates should demonstrate their ability to manage time effectively and balance short-term deliverables with long-term analytical projects. They should provide examples of how they have successfully delivered insights at different levels of depth based on business needs.
7. Can you discuss a time when you had to integrate data from multiple sources? What challenges did you face and how did you overcome them?
Integrating data from multiple sources often involves handling different data formats, inconsistent data types, and potential data quality issues. One project I worked on required integrating sales data from CRM systems, website analytics, and customer support databases.
The challenges included dealing with schema mismatches and ensuring data consistency across all sources. I addressed these by developing a robust ETL (Extract, Transform, Load) process, using data transformation tools to harmonize the data formats, and performing thorough data validation checks.
Candidates should discuss the specific challenges they faced and how they overcame them. Look for their ability to handle complex data integration tasks and their experience with ETL tools and methodologies.
8. Describe your experience with predictive analytics and how you use it to drive business decisions.
Predictive analytics involves using historical data and statistical algorithms to forecast future outcomes. My experience includes building predictive models to anticipate customer behavior, such as churn prediction or sales forecasting.
I use techniques like regression analysis, decision trees, and machine learning algorithms to create these models. The insights gained from predictive analytics help in making proactive business decisions, such as targeted marketing campaigns or inventory management.
Candidates should highlight their experience with predictive modeling techniques and tools. Look for examples of how their predictive analytics work has led to concrete business actions and improved outcomes.
12 Data Analysis questions related to statistical methods
To evaluate whether candidates possess a strong grasp of statistical methods in data analysis, ask some of these 12 essential interview questions. These questions can help hiring managers and recruiters identify candidates with the necessary statistical expertise to excel in roles like data analyst.
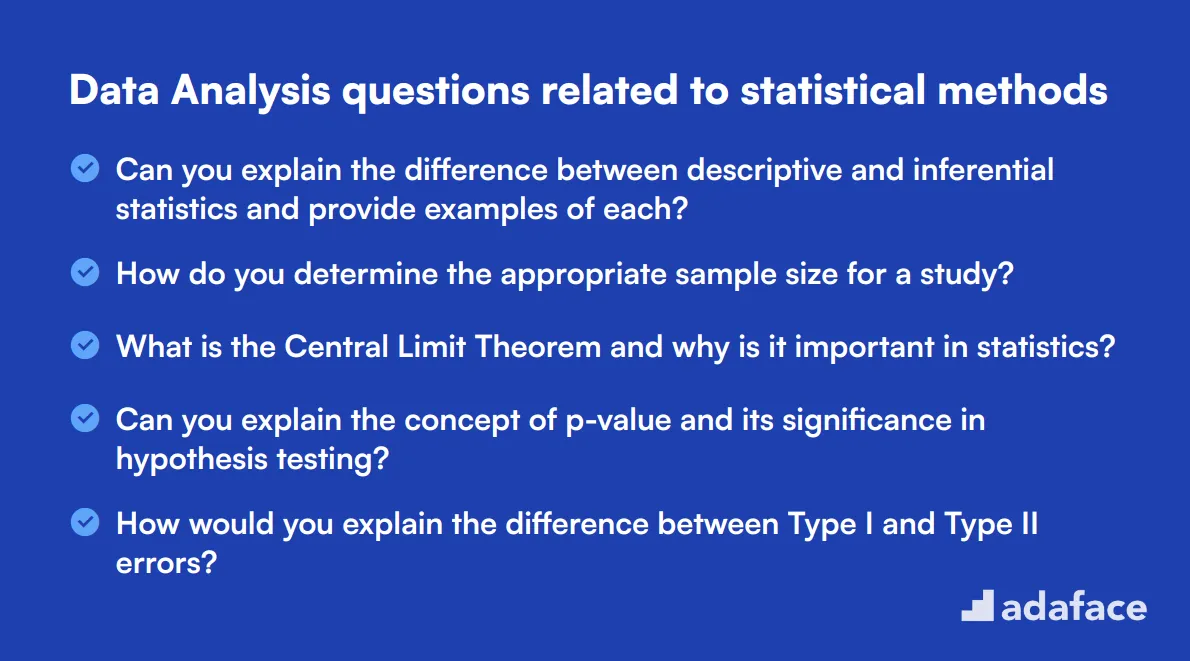
- Can you explain the difference between descriptive and inferential statistics and provide examples of each?
- How do you determine the appropriate sample size for a study?
- What is the Central Limit Theorem and why is it important in statistics?
- Can you explain the concept of p-value and its significance in hypothesis testing?
- How would you explain the difference between Type I and Type II errors?
- What is a confidence interval and how do you interpret it?
- How do you handle multicollinearity in a regression model?
- Can you describe a situation where you used chi-square tests in your analysis?
- What is the purpose of using ANOVA (Analysis of Variance) in statistical analysis?
- How would you explain the concept of statistical power to a non-technical stakeholder?
- Can you discuss your experience with logistic regression and its applications?
- What is the difference between parametric and non-parametric tests, and when would you use each?
7 Data Analysis interview questions and answers related to data visualization
To gauge whether your candidates can effectively present data insights through visualizations, these data visualization interview questions come in handy. Use these questions to assess how adept they are at making complex data comprehensible and visually engaging.
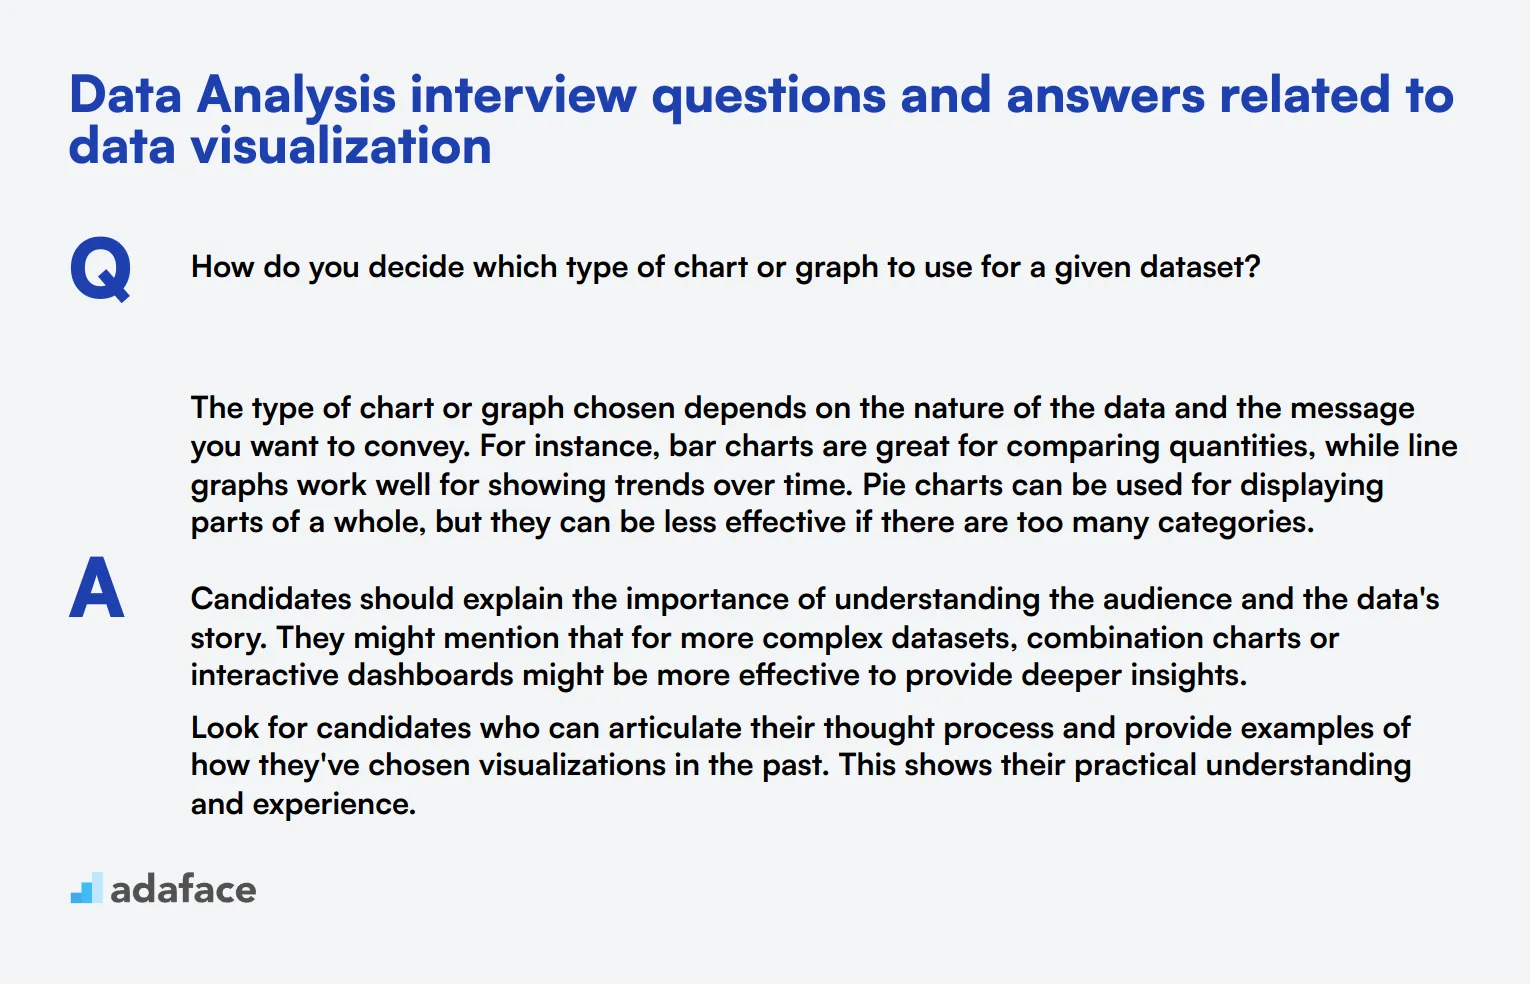
1. How do you decide which type of chart or graph to use for a given dataset?
The type of chart or graph chosen depends on the nature of the data and the message you want to convey. For instance, bar charts are great for comparing quantities, while line graphs work well for showing trends over time. Pie charts can be used for displaying parts of a whole, but they can be less effective if there are too many categories.
Candidates should explain the importance of understanding the audience and the data's story. They might mention that for more complex datasets, combination charts or interactive dashboards might be more effective to provide deeper insights.
Look for candidates who can articulate their thought process and provide examples of how they've chosen visualizations in the past. This shows their practical understanding and experience.
2. What are some best practices for designing a data visualization?
Some best practices for designing data visualizations include keeping the design simple and avoiding clutter, using colors effectively to highlight key data points, and ensuring that the visualization is accessible and easy to understand. It's also important to provide clear labels and legends.
Effective data visualization should tell a story. Candidates might talk about the importance of focusing on the most critical data, using consistent scales, and avoiding misleading representations.
An ideal candidate should be able to explain these practices clearly and provide examples of how they've applied them in their previous work. Look for attention to detail and a strong understanding of design principles.
3. Can you explain the difference between a heat map and a choropleth map?
A heat map uses color shading to represent data intensity or frequency in a specific area, such as web page clicks or temperature variations. It's a good choice for showing density or patterns within a confined space.
A choropleth map, on the other hand, represents data through varying shades or colors across predefined regions, such as countries or states. It's often used to show demographic data or election results.
Look for candidates who not only understand these differences but can also give examples of when each type of map would be appropriate. This demonstrates their ability to choose the right visualization tool for the job.
4. How do you ensure that your data visualizations are accessible to a broad audience?
Ensuring accessibility in data visualizations involves using color schemes that are distinguishable to those with color blindness, including text descriptions and labels, and ensuring that charts are readable even when printed in black and white. It's also important to provide alternate text for screen readers.
Candidates might discuss the importance of user testing and gathering feedback to identify accessibility issues. They should be aware of tools and guidelines, such as WCAG (Web Content Accessibility Guidelines).
An ideal candidate will show a commitment to inclusivity and demonstrate practical steps they've taken to make their visualizations accessible. Look for examples from their past work to assess their experience.
5. How do you handle large datasets when creating visualizations?
Handling large datasets requires techniques such as aggregation, filtering, and sampling to make the data manageable. Aggregating data can help by summarizing it into more digestible pieces, while filtering can remove irrelevant data points.
Candidates might mention the use of tools and technologies that can handle big data efficiently, such as data warehousing solutions or specialized software.
Look for candidates who demonstrate a strategic approach to managing large datasets and who can provide examples of how they've successfully created visualizations with large volumes of data. This shows their problem-solving skills and technical know-how.
6. What strategies do you use to tell a compelling story with data?
Telling a compelling story with data involves identifying the key message you want to convey and structuring your visualization to highlight that message. This can be achieved through a clear narrative structure, using annotations to guide the viewer, and focusing on the most relevant data points.
Candidates might discuss the importance of context and how they use supporting data to provide a comprehensive view. They might also talk about the role of interactivity in engaging the audience.
An ideal response will show the candidate's ability to think beyond just presenting data and focus on how to make that data meaningful. Look for examples where they successfully used storytelling in their visualizations.
7. How do you incorporate feedback when creating or refining data visualizations?
Incorporating feedback is crucial for creating effective data visualizations. This process involves actively seeking input from stakeholders, making iterative improvements, and being open to suggestions.
Candidates might explain their process for gathering feedback, such as user testing sessions or presenting drafts for review. They should also talk about how they balance feedback with their own expertise and design principles.
Look for candidates who demonstrate a collaborative mindset and can provide examples of how feedback has improved their visualizations. This shows their ability to work well in a team and their commitment to continuous improvement.
Which Data Analysis skills should you evaluate during the interview phase?
While it's challenging to assess every aspect of a candidate in a single interview, focusing on key Data Analysis skills is crucial. These core competencies form the foundation of a successful analyst's toolkit.
Statistical Analysis
Statistical analysis is at the heart of data analysis. It enables analysts to draw meaningful insights from data sets and make informed decisions based on quantitative evidence.
To evaluate this skill, consider using an assessment test with relevant MCQs. This can help filter candidates based on their statistical knowledge efficiently.
During the interview, you can ask targeted questions to gauge the candidate's understanding of statistical concepts. Here's an example:
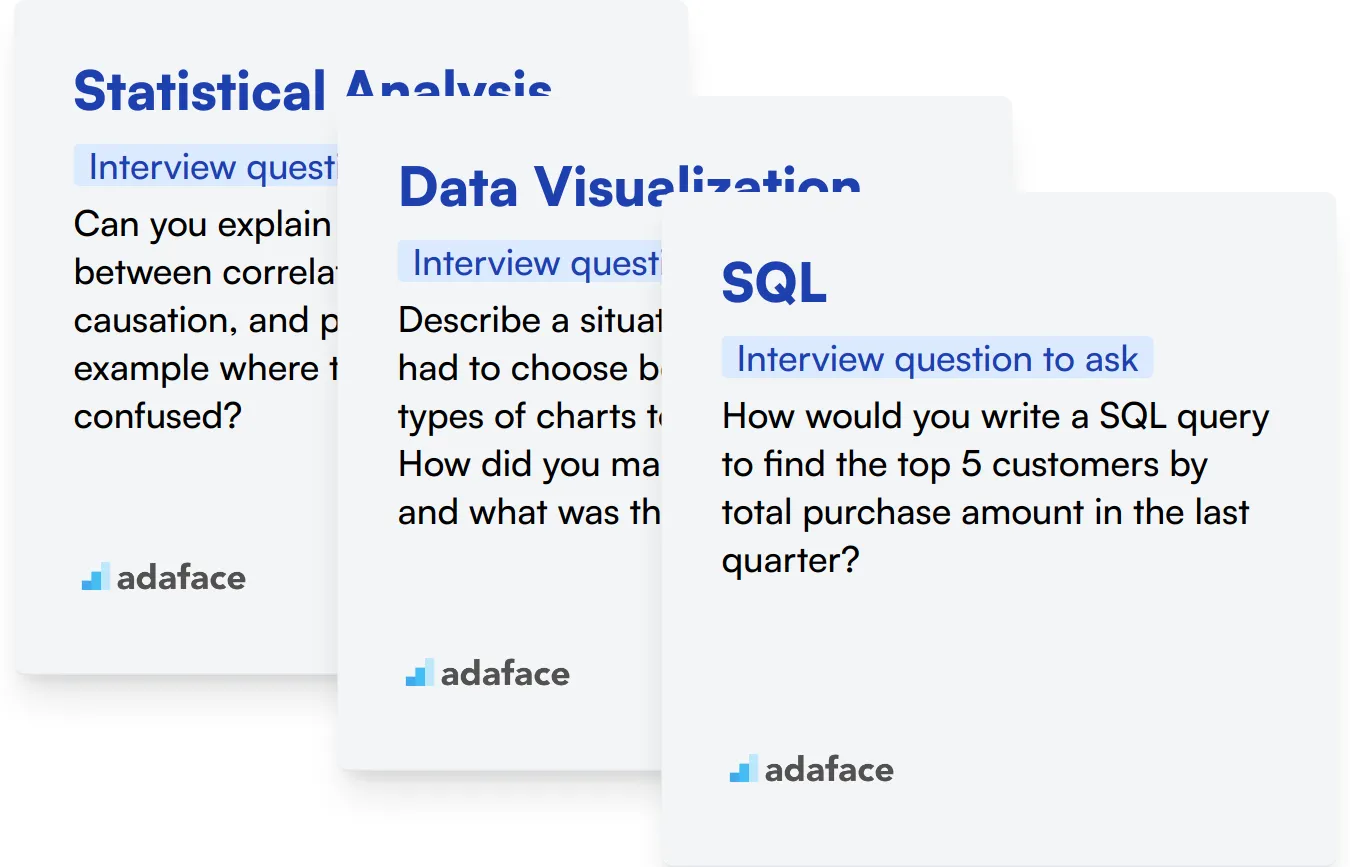
Can you explain the difference between correlation and causation, and provide an example where they might be confused?
Look for answers that clearly distinguish between correlation (a relationship between variables) and causation (one variable directly influencing another). A strong candidate will provide a relevant example and explain potential pitfalls in interpretation.
Data Visualization
Data visualization skills are essential for presenting complex information in an accessible format. Effective visualizations can communicate insights quickly and support decision-making processes.
Consider using an assessment test that includes questions on various chart types and their appropriate uses. This can help identify candidates with strong visualization skills.
To further evaluate this skill during the interview, you might ask:
Describe a situation where you had to choose between different types of charts to represent data. How did you make your decision, and what was the outcome?
Listen for responses that demonstrate the candidate's ability to select appropriate visualization types based on the data and audience. A strong answer will include considerations of data complexity, intended message, and target audience.
SQL
SQL is a fundamental tool for data analysts, enabling them to extract, manipulate, and analyze data from databases. Proficiency in SQL is often required for handling large datasets efficiently.
To assess SQL skills, you might use a SQL coding test that includes practical problems. This can help evaluate candidates' ability to write queries and solve real-world data challenges.
During the interview, you can ask a question to gauge the candidate's SQL knowledge and problem-solving skills:
How would you write a SQL query to find the top 5 customers by total purchase amount in the last quarter?
Look for answers that demonstrate understanding of SQL syntax, including JOINs, aggregation functions, and ordering. A strong candidate will also consider potential complexities like handling null values or ties in the ranking.
Leverage Data Analysis Skills Tests and Interview Questions to Identify Top Candidates
When aiming to hire individuals with proficient data analysis skills, it's important to verify these skills accurately.
The most reliable way to assess these competencies is through targeted skills tests. Consider using Adaface's Data Analysis Test or our Statistical Methods Test to gauge candidates effectively.
After deploying these tests, you can efficiently shortlist the top applicants, making them ideal candidates to invite for an in-depth interview.
To move forward, streamline your recruitment process by signing up on Adaface where you can access a suite of specialized assessment tools.
Data Analysis Test
30 mins | 15 MCQs
The Data Analysis Test assesses a candidate's ability to handle, modify, analyze and interpret data. The test uses scenario-based MCQ questions to screen for experience with analyzing data to find possible outcomes, detect anomalies, extract meaningful insights, project estimates and visualize data using charts and graphs. The test has 15 MCQ questions on data analysis, business analysis, data interpretation and SQL. The test will be customized according to your data analyst job description so that the questions and topics are relevant to your company.
Try Data Analysis Test
Download Data Analysis interview questions template in multiple formats
Data Analysis Interview Questions FAQs
What skills should I look for in a Data Analyst?
Look for skills in statistical analysis, data visualization, problem-solving, and proficiency in tools like SQL, Excel, and Python.
How can I assess a candidate's practical Data Analysis skills?
You can use skills tests, practical assignments, and technical questions during the interview to evaluate their abilities.
What are common pitfalls to avoid during Data Analysis interviews?
Avoid asking overly theoretical questions and ensure your questions are relevant to the actual job tasks.
How important is experience with specific tools and software for Data Analysts?
Experience with specific tools is important but not crucial; focus on their ability to learn and adapt to new technologies.
Should I include questions about data ethics and privacy in my interviews?
Yes, it's important to understand a candidate's knowledge and stance on data ethics and privacy to ensure they handle data responsibly.
How can I gauge a candidate's problem-solving ability during the interview?
Present them with real-world data problems and assess their approach to solving them, including the methods and tools they use.
40 min skill tests.
No trick questions.
Accurate shortlisting.
We make it easy for you to find the best candidates in your pipeline with a 40 min skills test.
Try for freeRelated posts
Free resources

Join 1200+ companies in 80+ countries.
Try the most candidate friendly skills assessment tool today.

40 min tests.
No trick questions.
Accurate shortlisting.
No trick questions.
Accurate shortlisting.