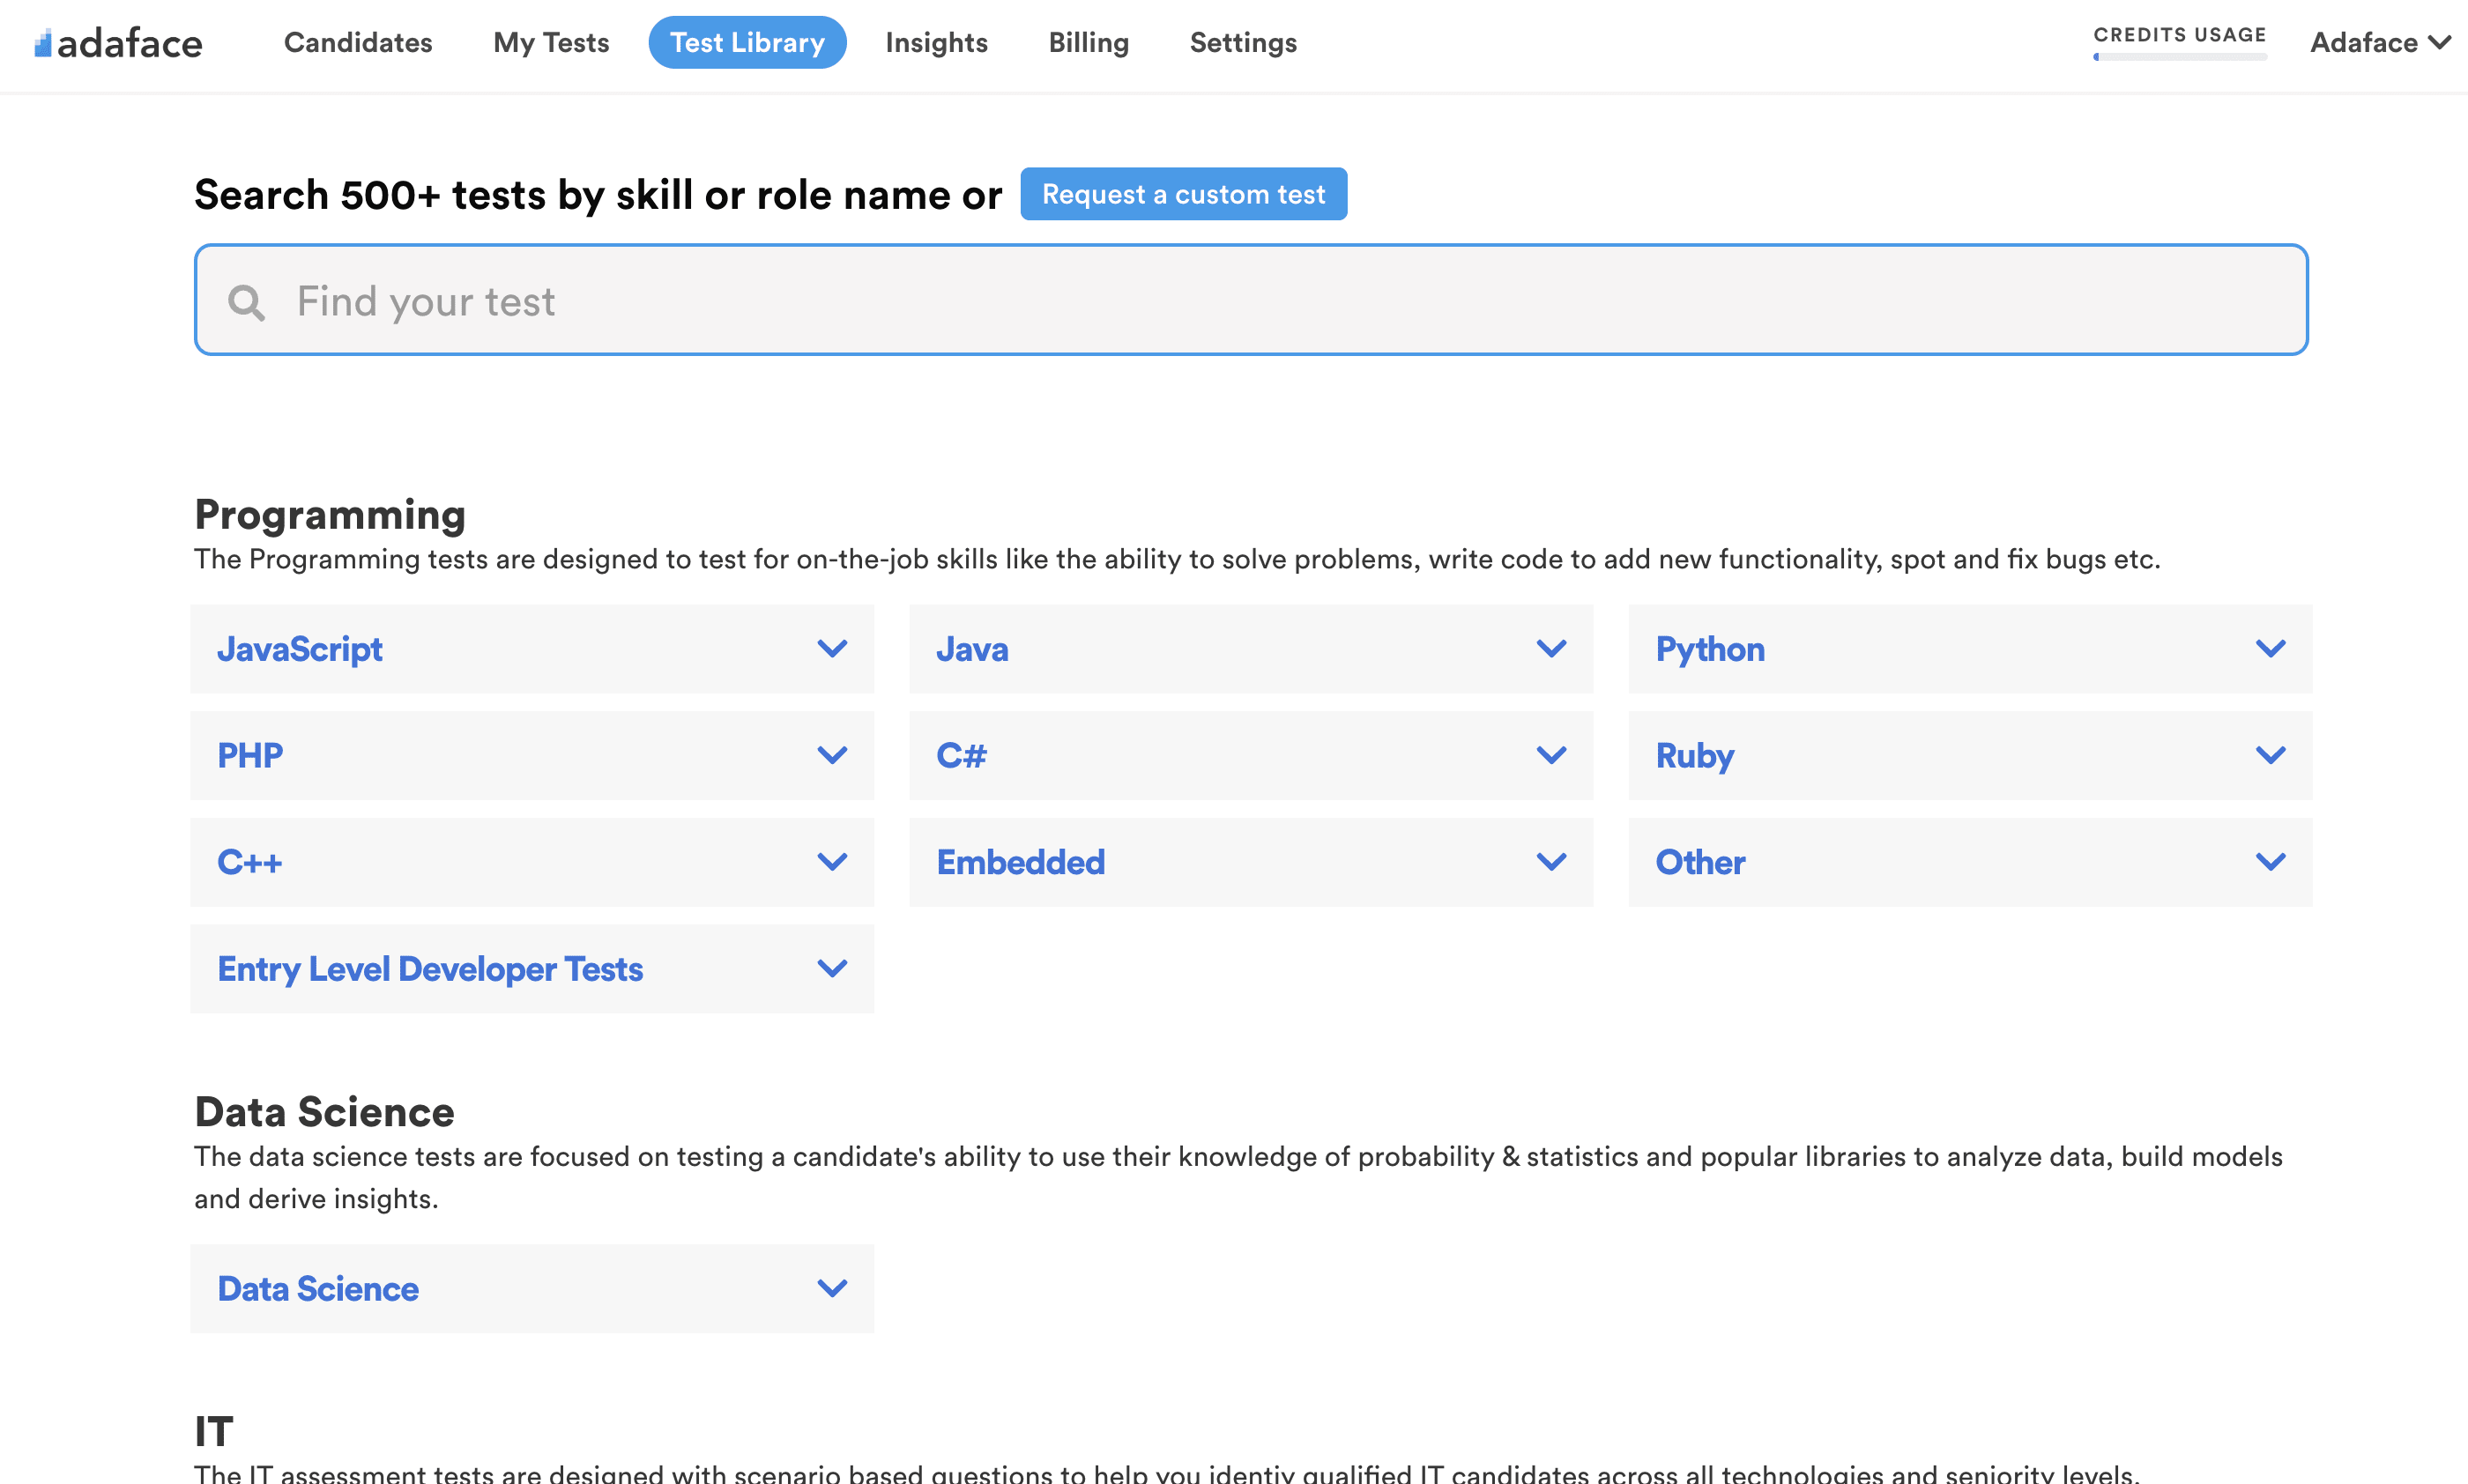
Search test library by skills or roles
⌘ K

About the test:

Obiee -online -testen evaluerer en kandidats viden og færdigheder i Oracle Business Intelligence Enterprise Edition (OBIEE). Den vurderer deres forståelse af forretningsinformationskoncepter, datavisualisering, rapportering, oprettelse af dashboard, metadatasstyring og datasikkerhed.

Covered skills:

  • Obiee
  • Datavisualisering
  • Dashboards
  • Analytics
  • Metadata -styring
  • Business Intelligence
  • Rapportering
  • Datamodellering
  • Datalagring
  • Datasikkerhed

9 reasons why
9 reasons why

Adaface OBIEE Test is the most accurate way to shortlist Obiee -udviklers


Reason #1

Tests for on-the-job skills

The OBIEE Online Test helps recruiters and hiring managers identify qualified candidates from a pool of resumes, and helps in taking objective hiring decisions. It reduces the administrative overhead of interviewing too many candidates and saves time by filtering out unqualified candidates at the first step of the hiring process.

The test screens for the following skills that hiring managers look for in candidates:

  • Evne til at analysere data effektivt
  • Evne til at fortolke data nøjagtigt
  • Evne til at modellere data effektivt
  • Forståelse af datalagringskoncepter
  • Færdighed i Obiee
  • Evne til at oprette og administrere rapporter
  • Kompetence til design af dashboards
  • Kendskab til datavisualiseringsteknikker
  • Forståelse af metadatasstyring
  • Bevidsthed om datasikkerhedspraksis
  • Evne til at udføre analyser på data
  • Kapacitet til at håndtere komplekse datamodeller
Reason #2

No trick questions

no trick questions

Traditional assessment tools use trick questions and puzzles for the screening, which creates a lot of frustration among candidates about having to go through irrelevant screening assessments.

View sample questions

The main reason we started Adaface is that traditional pre-employment assessment platforms are not a fair way for companies to evaluate candidates. At Adaface, our mission is to help companies find great candidates by assessing on-the-job skills required for a role.

Why we started Adaface
Reason #3

Non-googleable questions

We have a very high focus on the quality of questions that test for on-the-job skills. Every question is non-googleable and we have a very high bar for the level of subject matter experts we onboard to create these questions. We have crawlers to check if any of the questions are leaked online. If/ when a question gets leaked, we get an alert. We change the question for you & let you know.

How we design questions

Dette er kun en lille prøve fra vores bibliotek med 10.000+ spørgsmål. De faktiske spørgsmål om dette Obiee -test vil være ikke-gåbart.

🧐 Question

Medium

Hiring Developer
Skewed Data
Graph
Solve
Two companies A and B hired developers from the year 2001 to 2005. The given bar graph shows the hiring details. 
 image
 image
Now select the statements that are true based on the given details.

A: The data given for Company A is skewed to the left.
B: The data given for Company B is skewed to the right.
C: The data given for Company A is skewed to the right.
D: For Company B, mean and mode are equal.
E: For Company B, mean is equal to median but less than mode.
F: For Company A, median is less than mode but greater than mean.

Medium

Negative correlation
Solve
Saffi, one of the popular schools in San Francisco did a school wide study of the students in middle school. The study found that there is a negative correlation between the time spent on Facebook per day by students and their academic achievement. How can we understand the results of this study?
A: An increase in time spent on Facebook per day causes a drop in the academic achievement of students at the middle school level.

B: There is an association between an increase in time spent on Facebook per day and the drop in the academic achievement of students at Saffi. 

C: An increase in the time spent on Facebook per day causes a drop in the academic achievement of students at Saffi. 

D: There is an association between an increase in time spent on Facebook per day and the drop in the academic achievement of students at the middle school level.

Medium

Dividends
Financial Analysis
Percentage and Average Calculations
Solve
Consider the following line chart which shows the money invested by a company in production each year and the sales made by the company each year. If the pie chart shows the shareholding pattern of the company and the company gives 10% of the profit as dividends to its share holders then what is the average dividend received by retail investors from 2000 to 2004?
 image
 image

Medium

Laptop Brands
Proportions and Percentages
Financial Reasoning
Solve
Given below is the list of laptop brands and their details in which some data is missing. If the cost price of Dell is 3/5 of the cost price of Lenovo, then what will be the %profit of Dell?
 image

Hard

Median
Trend Analysis
Statistical Reasoning
Solve
 Consider the following line chart which shows the sales of five different companies from 2000 to 2009. Which of the following companies has the maximum percentage increase in the median from 2000 to 2004 and 2005 to 2009.
 image

Easy

Healthcare System
Data Integrity
Normalization
Referential Integrity
Solve
You are designing a data model for a healthcare system with the following requirements:
 image
A: A separate table for each entity with foreign keys as specified, and a DoctorPatient table linking Doctors to Patients.
B: A separate table for each entity with foreign keys as specified, without additional tables.
C: A combined PatientDoctor table replacing Patient and Doctor, and separate tables for Appointment and Prescription.
D: A separate table for each entity with foreign keys, and a PatientPrescription table to track prescriptions directly linked to patients.
E: A single table combining Patient, Doctor, Appointment, and Prescription into one.
F: A separate table for each entity with foreign keys as specified, and an AppointmentDetails table linking Appointments to Prescriptions.

Hard

ER Diagram and minimum tables
ER Diagram
Solve
Look at the given ER diagram. What do you think is the least number of tables we would need to represent M, N, P, R1 and R2?
 image
 image
 image

Medium

Normalization Process
Normalization
Database Design
Anomaly Elimination
Solve
Consider a healthcare database with a table named PatientRecords that stores patient visit information. The table has the following attributes:

- VisitID
- PatientID
- PatientName
- DoctorID
- DoctorName
- VisitDate
- Diagnosis
- Treatment
- TreatmentCost

In this table:

- Each VisitID uniquely identifies a patient's visit and is associated with one PatientID.
- PatientID is associated with exactly one PatientName.
- Each DoctorID is associated with a unique DoctorName.
- TreatmentCost is a fixed cost based on the Treatment.

Evaluating the PatientRecords table, which of the following statements most accurately describes its normalization state and the required actions for higher normalization?
A: The table is in 1NF. To achieve 2NF, remove partial dependencies by separating Patient information (PatientID, PatientName) and Doctor information (DoctorID, DoctorName) into different tables.
B: The table is in 2NF. To achieve 3NF, remove transitive dependencies by creating separate tables for Patients (PatientID, PatientName), Doctors (DoctorID, DoctorName), and Visits (VisitID, PatientID, DoctorID, VisitDate, Diagnosis, Treatment, TreatmentCost).
C: The table is in 3NF. To achieve BCNF, adjust for functional dependencies such as moving DoctorName to a separate Doctors table.
D: The table is in 1NF. To achieve 3NF, create separate tables for Patients, Doctors, and Visits, and remove TreatmentCost as it is a derived attribute.
E: The table is in 2NF. To achieve 4NF, address any multi-valued dependencies by separating Visit details and Treatment details.
F: The table is in 3NF. To achieve 4NF, remove multi-valued dependencies related to VisitID.

Medium

University Courses
ER Diagrams
Complex Relationships
Integrity Constraints
Solve
 image
Based on the ER diagram, which of the following statements is accurate and requires specific knowledge of the ER diagram's details?
A: A Student can major in multiple Departments.
B: An Instructor can belong to multiple Departments.
C: A Course can be offered by multiple Departments.
D: Enrollment records can link a Student to multiple Courses in a single semester.
E: Each Course must be associated with an Enrollment record.
F: A Department can offer courses without having any instructors.

Medium

Marketing Database
Columnar Storage
Data Warehousing
Analytical Queries
Solve
You are a data warehouse engineer at a marketing agency, managing a large-scale database that stores extensive data on customer interactions, campaign metrics, and market research. The database is used predominantly for complex analytical queries, such as segment analysis, trend identification, and campaign performance evaluation. These queries often involve aggregations, filtering, and joining over large datasets.

The existing setup, using traditional row-oriented storage, is struggling with performance issues, particularly for ad-hoc analytical queries that span multiple tables and require aggregating large volumes of data.

The main tables in the database are:

- Customer_Interactions (millions of rows): Stores individual customer interaction data.
- Campaign_Metrics (hundreds of thousands of rows): Contains detailed metrics for each marketing campaign.
- Market_Research (tens of thousands of rows): Holds market research data and findings.

Considering the nature of the queries and the structure of the data, which of the following changes would most effectively optimize the query performance for analytical purposes?
A: Normalize the database further by splitting large tables into smaller, more focused tables and creating indexes on frequently joined columns.
B: Implement an in-memory database system to facilitate faster data retrieval and processing.
C: Convert the database to use columnar storage, optimizing for the types of analytical queries performed in the marketing context.
D: Create a series of materialized views to pre-aggregate data for common query patterns.
E: Increase the hardware capacity of the server, focusing on faster CPUs and more RAM.
F: Implement partitioning on the main tables based on commonly filtered attributes, such as campaign IDs or time periods.

Medium

Multidimensional Data Modeling
Multidimensional Modeling
OLAP Operations
Data Warehouse Design
Solve
As a senior data warehouse engineer at a large retail company, you are tasked with designing a multidimensional data model to support complex OLAP (Online Analytical Processing) operations for retail analytics. The company operates in multiple countries and deals with a wide range of products. The primary requirement is to enable efficient analysis of sales performance across various dimensions such as time, geography, product categories, and sales channels.

The source data resides in a transactional system with the following tables:

- Transactions (Transaction_ID, Date, Store_ID, Product_ID, Quantity, Unit_Price)
- Stores (Store_ID, Store_Name, Country, Region)
- Products (Product_ID, Product_Name, Category, Supplier_ID)
- Suppliers (Supplier_ID, Supplier_Name, Country)

You need to design a schema in the data warehouse that facilitates fast querying for aggregations and comparisons along the mentioned dimensions. Which of the following schemas would best serve this purpose?
A: A star schema with a central fact table linking to dimension tables for Time, Store, Product, and Supplier.
B: A snowflake schema where dimension tables for Store, Product, and Supplier are normalized.
C: A galaxy schema with separate fact tables for Transactions, Inventory, and Supplier Orders, linked to shared dimension tables.
D: A flat schema combining all source tables into a single wide table to avoid joins during querying.
E: An OLTP-like normalized schema to maintain data integrity and minimize redundancy.
F: A hybrid schema using a star schema for frequently queried dimensions and a snowflake schema for less queried, more detailed dimensions.

Medium

Optimizing Query Performance
Query Optimization
Indexing Strategies
Data Partitioning
Solve
As a senior data warehouse developer, you are tasked with optimizing query performance in a large-scale data warehouse that primarily stores transactional data for a global retail company. The data warehouse is facing significant performance issues, particularly with certain types of queries that are crucial for business operations. After analysis, you identify that the most problematic queries are those that involve filtering and aggregating transaction data based on time periods (e.g., monthly sales) and specific product categories.

The main transaction table (Transactions) in the data warehouse has the following structure and characteristics:

- Columns: Transaction_ID (bigint), Transaction_Date (date), Product_ID (int), Quantity (int), Price (decimal), Category_ID (int)
- Row count: Approximately 2 billion rows
- Most common query pattern: Aggregating Quantity and Price by Category_ID and Transaction_Date (e.g., total sales per category per month)
- Current indexing: Primary key index on Transaction_ID, no other indexes

Based on this information, which of the following approaches would most effectively optimize the query performance for the given use case?
A: Add a non-clustered index on Transaction_Date and Category_ID.
B: Normalize the Transactions table by splitting Transaction_Date and Category_ID into separate dimension tables.
C: Implement partitioning on the Transactions table by Transaction_Date, and add a bitmap index on Category_ID.
D: Convert the Transactions table to use a columnar storage format.
E: Create a materialized view that pre-aggregates data by Category_ID and Transaction_Date.
F: Increase the hardware capacity of the data warehouse server, focusing on CPU and memory upgrades.
🧐 Question🔧 Skill

Medium

Hiring Developer
Skewed Data
Graph

3 mins

Data Analysis
Solve

Medium

Negative correlation

2 mins

Data Analysis
Solve

Medium

Dividends
Financial Analysis
Percentage and Average Calculations

3 mins

Data Interpretation
Solve

Medium

Laptop Brands
Proportions and Percentages
Financial Reasoning

2 mins

Data Interpretation
Solve

Hard

Median
Trend Analysis
Statistical Reasoning

3 mins

Data Interpretation
Solve

Easy

Healthcare System
Data Integrity
Normalization
Referential Integrity

2 mins

Data Modeling
Solve

Hard

ER Diagram and minimum tables
ER Diagram

2 mins

Data Modeling
Solve

Medium

Normalization Process
Normalization
Database Design
Anomaly Elimination

3 mins

Data Modeling
Solve

Medium

University Courses
ER Diagrams
Complex Relationships
Integrity Constraints

2 mins

Data Modeling
Solve

Medium

Marketing Database
Columnar Storage
Data Warehousing
Analytical Queries

2 mins

Data Warehouse
Solve

Medium

Multidimensional Data Modeling
Multidimensional Modeling
OLAP Operations
Data Warehouse Design

2 mins

Data Warehouse
Solve

Medium

Optimizing Query Performance
Query Optimization
Indexing Strategies
Data Partitioning

2 mins

Data Warehouse
Solve
🧐 Question🔧 Skill💪 Difficulty⌛ Time
Hiring Developer
Skewed Data
Graph
Data Analysis
Medium3 mins
Solve
Negative correlation
Data Analysis
Medium2 mins
Solve
Dividends
Financial Analysis
Percentage and Average Calculations
Data Interpretation
Medium3 mins
Solve
Laptop Brands
Proportions and Percentages
Financial Reasoning
Data Interpretation
Medium2 mins
Solve
Median
Trend Analysis
Statistical Reasoning
Data Interpretation
Hard3 mins
Solve
Healthcare System
Data Integrity
Normalization
Referential Integrity
Data Modeling
Easy2 mins
Solve
ER Diagram and minimum tables
ER Diagram
Data Modeling
Hard2 mins
Solve
Normalization Process
Normalization
Database Design
Anomaly Elimination
Data Modeling
Medium3 mins
Solve
University Courses
ER Diagrams
Complex Relationships
Integrity Constraints
Data Modeling
Medium2 mins
Solve
Marketing Database
Columnar Storage
Data Warehousing
Analytical Queries
Data Warehouse
Medium2 mins
Solve
Multidimensional Data Modeling
Multidimensional Modeling
OLAP Operations
Data Warehouse Design
Data Warehouse
Medium2 mins
Solve
Optimizing Query Performance
Query Optimization
Indexing Strategies
Data Partitioning
Data Warehouse
Medium2 mins
Solve
Reason #4

1200+ customers in 75 countries

customers in 75 countries
Brandon

Med Adaface var vi i stand til at optimere vores indledende screeningsproces med op mod 75 %, hvilket frigjorde kostbar tid for både ansættelsesledere og vores talentanskaffelsesteam!


Brandon Lee, Leder af mennesker, Love, Bonito

Reason #5

Designed for elimination, not selection

The most important thing while implementing the pre-employment Obiee -test in your hiring process is that it is an elimination tool, not a selection tool. In other words: you want to use the test to eliminate the candidates who do poorly on the test, not to select the candidates who come out at the top. While they are super valuable, pre-employment tests do not paint the entire picture of a candidate’s abilities, knowledge, and motivations. Multiple easy questions are more predictive of a candidate's ability than fewer hard questions. Harder questions are often "trick" based questions, which do not provide any meaningful signal about the candidate's skillset.

Science behind Adaface tests
Reason #6

1 click candidate invites

Email invites: You can send candidates an email invite to the Obiee -test from your dashboard by entering their email address.

Public link: You can create a public link for each test that you can share with candidates.

API or integrations: You can invite candidates directly from your ATS by using our pre-built integrations with popular ATS systems or building a custom integration with your in-house ATS.

invite candidates
Reason #7

Detailed scorecards & benchmarks

Se prøvescorekort
Reason #8

High completion rate

Adaface tests are conversational, low-stress, and take just 25-40 mins to complete.

This is why Adaface has the highest test-completion rate (86%), which is more than 2x better than traditional assessments.

test completion rate
Reason #9

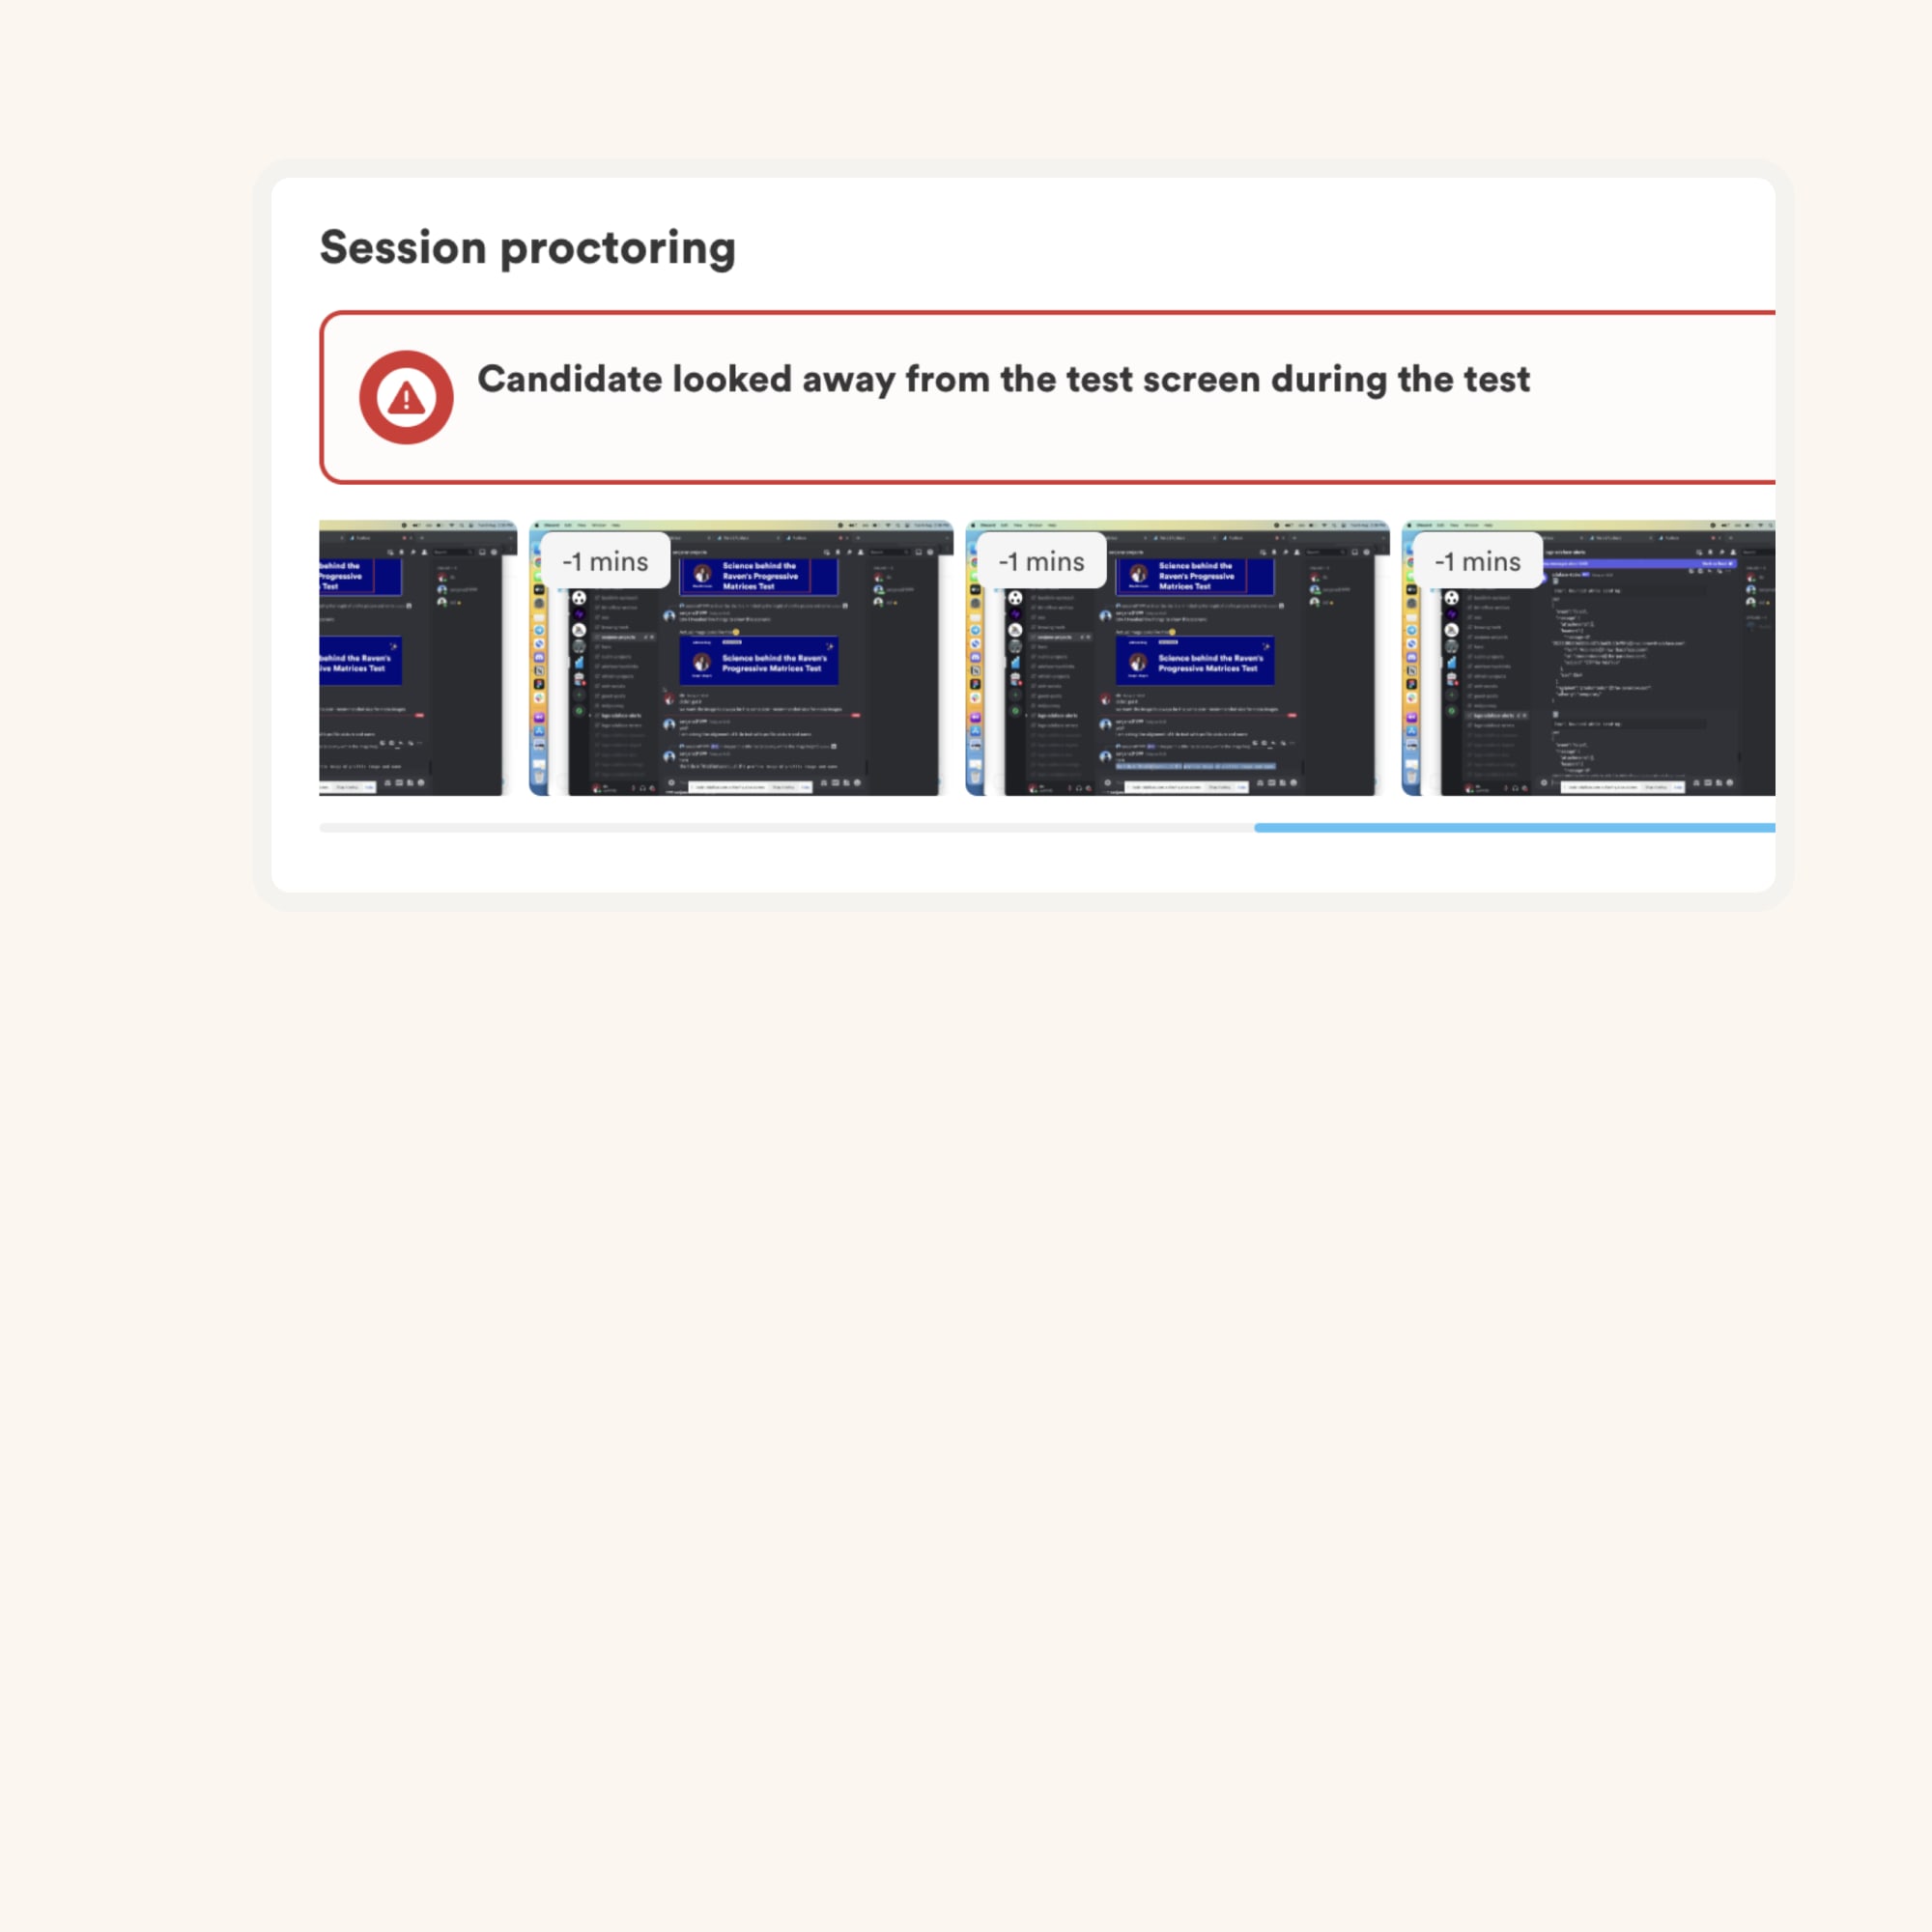
Advanced Proctoring


Learn more

About the OBIEE Assessment Test

Why you should use Pre-employment OBIEE Online Test?

The Obiee -test makes use of scenario-based questions to test for on-the-job skills as opposed to theoretical knowledge, ensuring that candidates who do well on this screening test have the relavant skills. The questions are designed to covered following on-the-job aspects:

  • Udførelse af dataanalyse for at identificere tendenser og mønstre i store datasæt
  • Fortolkning af data for at give indsigt og anbefalinger til forbedret forretningsresultater
  • Udvikling af datamodeller til at strukturere og organisere data til effektiv analyse
  • Implementering af datavarehusløsninger til centralt butik og administration af data
  • Oprettelse af visuelt overbevisende rapporter og dashboards til at præsentere data på en meningsfuld måde
  • Design og implementering af analyseløsninger til understøttelse af beslutningsprocesser
  • Forståelse og anvendelse af datalagringskoncepter og principper
  • Håndtering af metadata for at sikre nøjagtige og konsistente datarinitioner
  • Implementering af datasikkerhedsforanstaltninger for at beskytte følsomme oplysninger
  • Udvikling af ekspertise i Obiee og dets forskellige komponenter

Once the test is sent to a candidate, the candidate receives a link in email to take the test. For each candidate, you will receive a detailed report with skills breakdown and benchmarks to shortlist the top candidates from your pool.

What topics are covered in the OBIEE Online Test?

  • obiee

    obiee står for Oracle Business Intelligence Enterprise Edition. Det er en forretningsinformationsplatform, der giver et sæt værktøjer og muligheder til dataanalyse, rapportering og beslutningstagning. Måling af denne færdighed i testen gør det muligt for rekrutterere at vurdere en kandidats færdigheder i at bruge OBIEE til at indsamle indsigt fra data og træffe informerede forretningsbeslutninger.

  • forretningsinformation

    Business Intelligence refererer til processen med Indsamling, analyse og præsentation af data for at støtte forretningsbeslutning. Måling af denne færdighed i testen giver rekrutterere mulighed for at evaluere en kandidats evne til at bruge forskellige teknikker og værktøjer til at omdanne rå data til meningsfuld indsigt, der driver strategiske handlinger.

  • datavisualisering

    Datavisualisering involverer Repræsenterer data i visuelle formater såsom diagrammer, grafer og dashboards for effektivt at kommunikere indsigt til interessenter. Evaluering af denne færdighed i testen hjælper rekrutterere med at måle en kandidats dygtighed til at skabe visuelt tiltalende og informative datavisualiseringer, der understøtter datadrevet beslutningstagning.

  • Rapportering

    Rapportering involverer at generere struktureret og formateret Oplysninger fra rå data, der normalt præsenteres i form af tabeller, diagrammer eller resume. Måling af denne færdighed i testen giver rekrutterere mulighed for at vurdere en kandidats evne til at designe og generere nøjagtige og relevante rapporter, der hjælper interessenter med at forstå og analysere centrale forretningsmetrics.

  • dashboards

    Dashboards er visuelle skærme af nøgleprestationsindikatorer og andre vigtige målinger, der giver et øjeblik i realtid af en organisations præstation. Evaluering af denne færdighed i testen gør det muligt for rekrutterere at bestemme en kandidats evne til at designe og opbygge interaktive og brugervenlige dashboards, der letter dataudforskning og beslutningstagning.

  • datamodellering

    Datamodellering er processen med at skabe en konceptuel repræsentation af datastrukturer og relationer. Måling af denne færdighed i testen giver rekrutterere mulighed for at vurdere en kandidats dygtighed til at definere og designe datamodeller, der nøjagtigt fanger og organiserer forretningsdata, hvilket sikrer effektiv datastyring og hentning.

  • analyse

    Analytics involverer anvendelse af statistiske teknikker og algoritmer til at analysere data og udtrække meningsfulde mønstre og indsigt. Evaluering af denne færdighed i testen gør det muligt for rekrutterere at evaluere en kandidats evne til at anvende analysemetoder og værktøjer til at identificere tendenser, foretage forudsigelser og få dybere forståelse af forretningspræstationer og muligheder.

  • datalager </h4> < P> datalagring henviser til processen med at konsolidere, organisere og lagre store mængder data fra forskellige kilder til effektiv rapportering og analyse. Måling af denne færdighed i testen giver rekrutterere mulighed for at bestemme en kandidats færdigheder i at designe, udvikle og styre datalager, der understøtter effektiv dataintegration, opbevaring og hentning Ledelsen involverer indsamling, organisering og vedligeholdelse af metadata, der giver kontekstuelle oplysninger om data. Evaluering af denne færdighed i testen hjælper rekrutterere med at vurdere en kandidats evne til effektivt at håndtere metadata, hvilket sikrer datakvalitet, konsistens og nøjagtighed i forretningsinformationsinitiativer. </p> <h4> datasikkerhed

    Datasikkerhed omfatter mål og teknikker, der sigter mod at beskytte data mod uautoriseret adgang, brug, afsløring, forstyrrelse, ændring eller ødelæggelse. Evaluering af denne færdighed i testen gør det muligt for rekrutterere at evaluere en kandidats forståelse af datasikkerhedsprincipper og deres evne til at implementere passende sikkerhedskontrol og politikker for at beskytte følsomme forretningsoplysninger.

  • Full list of covered topics

    The actual topics of the questions in the final test will depend on your job description and requirements. However, here's a list of topics you can expect the questions for Obiee -test to be based on.

    Obiee -arkitektur
    Dataanalyse
    Datatolkning
    Datamodellering
    Datalagringskoncepter
    Metadata -styring
    Dimensionel modellering
    Stjerneskema
    Snowflake -skema
    Fakta og dimensionstabeller
    Hierarkier og niveauer
    Aggregater og foranstaltninger
    Obiee rapporterer
    Oracle BI -administrationsværktøj
    Dashboard Design
    Datavisualiseringsteknikker
    KPI'er og scorecards
    Drejning og se filtre
    Brugeradministration og sikkerhed
    Obiee -integration med andre værktøjer
    Obiee Performance Tuning
    SQL for Obiee
    ETL -koncepter
    Datalagerdesign
    Data -styring
    Datakvalitetsstyring
    Forespørgseloptimering
    Data mining og forudsigelig analyse
    Business Intelligence bedste praksis
    Obiee -fejlfinding

What roles can I use the OBIEE Online Test for?

  • Obiee -udvikler
  • Oracle BI -udvikler
  • Senior Oracle Developer
  • BI -udvikler

How is the OBIEE Online Test customized for senior candidates?

For intermediate/ experienced candidates, we customize the assessment questions to include advanced topics and increase the difficulty level of the questions. This might include adding questions on topics like

  • Anvendelse af forretningsinformationskoncepter og metodologier
  • Brug af datavisualiseringsteknikker til effektivt at kommunikere information
  • Forståelse og anvendelse af bedste praksis inden for rapportering og instrumentbrætdesign
  • Analyse og optimering af datamodeller for ydeevne og effektivitet
  • Bygning og vedligeholdelse af datalager til opbevaring og hentning af data
  • Sikring af dataintegritet og kvalitet i hele datilivscyklussen
  • Anvendelse af avancerede analyseteknikker såsom forudsigelig modellering og datamining
  • Konfiguration og tilpasning af OBIEE til at imødekomme forretningskrav
  • Samarbejde med tværfunktionelle teams for at indsamle og analysere datakrav
  • Fejlfinding og løsning af problemer relateret til Obiee -implementering
  • Design og implementering af ETL -processer til at udtrække, transformere og indlæse data
Singapore government logo

Ansættelseslederne mente, at de gennem de tekniske spørgsmål, som de stillede under panelinterviewene, var i stand til at fortælle, hvilke kandidater der havde bedre score og differentieret med dem, der ikke scorede så godt. De er meget tilfreds med kvaliteten af ​​de kandidater, der er nomineret med Adaface-screeningen.


85%
Reduktion i screeningstid

OBIEE Hiring Test Ofte stillede spørgsmål

Kan jeg kombinere flere færdigheder i en brugerdefineret vurdering?

Ja absolut. Brugerdefinerede vurderinger er oprettet baseret på din jobbeskrivelse og vil omfatte spørgsmål om alle must-have-færdigheder, du angiver.

Har du nogen anti-cheating eller proctoring-funktioner på plads?

Vi har følgende anti-cheating-funktioner på plads:

  • Ikke-gåbare spørgsmål
  • IP Proctoring
  • Webproctoring
  • Webcam Proctoring
  • Detektion af plagiering
  • Sikker browser

Læs mere om Proctoring Features.

Hvordan fortolker jeg testresultater?

Den primære ting at huske på er, at en vurdering er et elimineringsværktøj, ikke et udvælgelsesværktøj. En færdighedsvurdering er optimeret for at hjælpe dig med at eliminere kandidater, der ikke er teknisk kvalificerede til rollen, den er ikke optimeret til at hjælpe dig med at finde den bedste kandidat til rollen. Så den ideelle måde at bruge en vurdering på er at beslutte en tærskelværdi (typisk 55%, vi hjælper dig med benchmark) og inviterer alle kandidater, der scorer over tærsklen for de næste interviewrunder.

Hvilken oplevelsesniveau kan jeg bruge denne test til?

Hver Adaface -vurdering tilpasses til din jobbeskrivelse/ ideel kandidatperson (vores emneeksperter vælger de rigtige spørgsmål til din vurdering fra vores bibliotek på 10000+ spørgsmål). Denne vurdering kan tilpasses til ethvert erfaringsniveau.

Får hver kandidat de samme spørgsmål?

Ja, det gør det meget lettere for dig at sammenligne kandidater. Valgmuligheder for MCQ -spørgsmål og rækkefølgen af ​​spørgsmål randomiseres. Vi har anti-cheating/proctoring funktioner på plads. I vores virksomhedsplan har vi også muligheden for at oprette flere versioner af den samme vurdering med spørgsmål om lignende vanskelighedsniveauer.

Jeg er kandidat. Kan jeg prøve en øvelsestest?

Nej. Desværre understøtter vi ikke praksisforsøg i øjeblikket. Du kan dog bruge vores eksempler på spørgsmål til praksis.

Hvad er omkostningerne ved at bruge denne test?

Du kan tjekke vores prisplaner.

Kan jeg få en gratis prøve?

Ja, du kan tilmelde dig gratis og forhåndsvise denne test.

Jeg flyttede lige til en betalt plan. Hvordan kan jeg anmode om en brugerdefineret vurdering?

Her er en hurtig guide til hvordan man anmoder om en brugerdefineret vurdering på adaface.

customers across world
Join 1200+ companies in 75+ countries.
Prøv det mest kandidatvenlige færdighedsvurderingsværktøj i dag.
g2 badges
Ready to use the Adaface Obiee -test?
ada
Ada
● Online
Previous
Score: NA
Next
✖️