
Basic Splunk interview questions
1. What is Splunk, in simple terms?
2. Can you describe the typical Splunk workflow?
3. What are the main components of Splunk's architecture?
4. What types of data can Splunk ingest?
5. How do you add data to Splunk?
6. What is an index in Splunk?
7. Explain the difference between a forwarder and an indexer.
8. What is a search head?
9. What is the purpose of Splunk's search processing language (SPL)?
10. Give a basic example of an SPL search query.
11. What is a field in Splunk?
12. How can you extract fields from your data in Splunk?
13. What are tags and how are they useful?
14. What are event types, and why would you use them?
15. What is a dashboard in Splunk?
16. How do you create a simple dashboard?
17. What are reports in Splunk?
18. Can you explain the difference between real-time search and historical search?
19. How can you schedule a report to run automatically?
20. What is a Splunk app?
21. How do you install an app in Splunk?
22. What are lookups in Splunk?
23. How can you use lookups to enrich your data?
24. What is the purpose of the Splunk Common Information Model (CIM)?
25. What is the difference between transforming and non-transforming commands?
26. What is the purpose of using wildcards in Splunk searches?
27. What are some best practices for writing efficient Splunk searches?
28. How can you troubleshoot common Splunk issues, like data not being ingested?
29. Explain what role-based access control means in Splunk.
Intermediate Splunk interview questions
1. How would you handle a situation where Splunk is ingesting duplicate logs, and what steps would you take to identify the source of the duplication and prevent it from happening again?
2. Can you explain the difference between a transforming search and a non-transforming search in Splunk, and provide an example of when you would use each?
3. Describe your experience with creating and managing Splunk knowledge objects such as field extractions, event types, and tags. How do these objects improve the search experience and data quality?
4. Explain how you would use Splunk's Common Information Model (CIM) to normalize data from different sources, and what are the benefits of doing so?
5. How do you monitor the health and performance of a Splunk environment, including indexers, search heads, and forwarders? What metrics are most important to track?
6. Describe a time when you had to troubleshoot a slow-running Splunk search. What steps did you take to identify the bottleneck and improve performance?
7. Explain how you would use Splunk's alerting capabilities to detect security threats or operational issues, and what best practices do you follow when creating alerts?
8. Can you describe the process of setting up a distributed Splunk environment, including considerations for indexer clustering and search head pooling?
9. How would you use Splunk to analyze network traffic data, such as NetFlow or packet captures, to identify potential security threats or performance bottlenecks?
10. Describe your experience with using Splunk's Machine Learning Toolkit (MLTK) to build predictive models or detect anomalies in data.
11. Explain how you would use Splunk to audit user activity and access to sensitive data, and what compliance requirements can Splunk help address?
12. Can you describe the different types of Splunk licenses and how they impact the functionality and performance of the platform?
13. How would you use Splunk to analyze web server logs to identify website performance issues, security threats, or user behavior patterns?
14. Describe your experience with integrating Splunk with other security tools, such as SIEMs, firewalls, or intrusion detection systems.
15. Explain how you would use Splunk to create dashboards and reports to visualize key performance indicators (KPIs) and trends for different stakeholders.
16. How do you approach optimizing Splunk search queries for efficiency, especially when dealing with large datasets or complex logic?
17. Explain your understanding of data retention policies in Splunk and how you would implement them to manage storage costs and compliance requirements.
18. Describe a situation where you had to create a custom Splunk app. What were the challenges, and how did you overcome them?
19. Explain the importance of using field extractions and how they contribute to more efficient searching and analysis in Splunk.
20. How would you use Splunk to monitor and troubleshoot issues related to cloud-based infrastructure, such as AWS or Azure?
Advanced Splunk interview questions
1. How would you optimize a Splunk search that is running slowly, and what tools would you use to identify the bottleneck?
2. Describe a complex Splunk search you've built, detailing the problem it solved, the techniques you used, and any challenges you overcame.
3. Explain how you would implement a data retention policy in Splunk to manage storage costs and ensure compliance.
4. What are the key considerations when designing a Splunk deployment for high availability and disaster recovery?
5. How can you use Splunk's machine learning capabilities to detect anomalies in your data, and what are the limitations?
6. Discuss your experience with Splunk's Common Information Model (CIM) and how it can be used to normalize data from different sources.
7. How would you troubleshoot a situation where Splunk is not indexing data as expected, and what steps would you take to resolve the issue?
8. Explain how you can use Splunk's REST API to integrate with other systems and automate tasks.
9. Describe how you would set up role-based access control in Splunk to ensure that users only have access to the data they need.
10. How can you use Splunk dashboards to visualize key performance indicators (KPIs) and track trends over time?
11. Discuss your experience with Splunk's alerting capabilities and how you would configure alerts to respond to critical events.
12. How would you use Splunk to investigate a security incident, and what types of searches would you run to identify the root cause?
13. Explain how you can use Splunk's transaction command to group related events together and analyze them as a single unit.
14. Describe how you would use Splunk to monitor the performance of a web application, and what metrics would you track?
15. How can you use Splunk's lookup tables to enrich your data with additional information, and what are the benefits?
16. Discuss your experience with Splunk's data onboarding process, including how you would configure inputs and sourcetypes.
17. How would you use Splunk to comply with regulatory requirements, such as GDPR or HIPAA?
18. Explain how you can use Splunk's correlation searches to identify complex patterns of behavior across multiple data sources.
19. Describe how you would use Splunk to monitor the health and performance of your Splunk deployment itself.
20. How can you use Splunk's SDKs to develop custom applications that integrate with Splunk?
21. Discuss your experience with Splunk's cloud platform, including its advantages and disadvantages compared to on-premises deployments.
22. Explain how you would use Splunk to predict future trends based on historical data, and what techniques would you use?
Expert Splunk interview questions
1. How would you optimize a Splunk search that is performing poorly, and what tools or techniques would you use to identify the bottleneck?
2. Describe a complex Splunk deployment scenario you've designed, considering factors like high availability, disaster recovery, and scalability.
3. Explain how you would implement a custom alert in Splunk that triggers based on a specific anomaly detected in the data.
4. What are the key considerations when designing a data onboarding strategy for a large, diverse set of data sources in Splunk?
5. How would you troubleshoot a Splunk indexer cluster that is experiencing performance issues or data loss?
6. Describe your experience with using the Splunk REST API to automate tasks or integrate with other systems.
7. Explain how you would use Splunk's machine learning capabilities to detect and predict security threats or anomalies.
8. What are the best practices for managing Splunk knowledge objects, such as dashboards, reports, and saved searches, in a large organization?
9. How would you implement a role-based access control (RBAC) model in Splunk to ensure that users only have access to the data they need?
10. Describe your experience with using Splunk's Common Information Model (CIM) to normalize data from different sources.
11. How would you design a Splunk dashboard to provide real-time insights into the performance of a critical application or system?
12. Explain how you would use Splunk to investigate a security incident, such as a data breach or malware infection.
13. What are the key considerations when upgrading a Splunk environment to a newer version, and how would you mitigate potential risks?
14. How would you use Splunk to monitor the health and performance of your own Splunk infrastructure?
15. Describe your experience with using Splunk's SDKs to develop custom applications or integrations.
16. Explain how you would use Splunk to comply with regulatory requirements, such as PCI DSS or HIPAA.
17. What are the best practices for writing efficient and effective Splunk search queries?
18. How would you design a Splunk solution to address a specific business problem or use case?
19. Describe your experience with using Splunk's data enrichment capabilities to add context to your data.
20. Explain how you would use Splunk to monitor and analyze network traffic data.
21. What are the different types of Splunk licenses, and how do they impact your deployment?
22. How would you troubleshoot a Splunk search that is returning incorrect or incomplete results?
23. Describe your experience with using Splunk's modular inputs to collect data from custom sources.
24. Explain how you would use Splunk to monitor and analyze cloud-based infrastructure and services.
25. What are the key considerations when choosing between different Splunk deployment options, such as on-premises, cloud, or hybrid?
26. How would you use Splunk to predict future trends or events based on historical data?
27. Describe your experience with using Splunk's advanced search commands and functions.
28. Explain how you would use Splunk to automate incident response workflows.
29. What are the best practices for securing a Splunk environment against unauthorized access and data breaches?
30. How would you use Splunk to measure and improve the performance of your organization's IT operations?

Evaluating candidates for Splunk roles can be tough, as it requires a blend of technical expertise and practical application. Recruiters can struggle to gauge a candidate's true proficiency without structured interview questions.
This blog post provides a curated list of Splunk interview questions, categorized by experience level from basic to expert, including a set of Splunk MCQs. These questions cover a spectrum of topics, ensuring a review of a candidate’s abilities.
By using these questions, interviewers can identify candidates who truly understand Splunk and its applications. To ensure a candidate is truly skilled, use our Splunk online test before the interview to filter out unsuitable candidates.
Table of contents
Basic Splunk interview questions
Intermediate Splunk interview questions
Advanced Splunk interview questions
Expert Splunk interview questions
Splunk MCQ
Which Splunk skills should you evaluate during the interview phase?
Hire Splunk Experts with Targeted Skills Assessments
Download Splunk interview questions template in multiple formats
Basic Splunk interview questions
1. What is Splunk, in simple terms?
Splunk is like a powerful search engine for machine data. Think of it as Google, but instead of searching the internet, it searches logs, metrics, and other data produced by computers, applications, and devices. This data is often messy and unstructured, but Splunk helps to make sense of it, allowing you to monitor systems, troubleshoot problems, detect security threats, and gain business insights.
Essentially, it takes raw machine data, indexes it, and provides a user interface to search, analyze, and visualize that data. It helps turn machine data into actionable intelligence.
2. Can you describe the typical Splunk workflow?
The typical Splunk workflow involves several key stages: First, data is inputted into Splunk, either through direct connections to data sources, file uploads, or forwarders. Next, Splunk indexes this data, parsing it into events and extracting fields for searching. This indexing process creates a searchable repository. Users then search and analyze the indexed data using Splunk's Search Processing Language (SPL) to identify trends, patterns, and anomalies. Finally, users can create reports, dashboards, and alerts based on their search results to visualize data, monitor critical events, and proactively respond to issues.
In summary:
- Data Input: Collect data from various sources.
- Indexing: Parse and store data in a searchable format.
- Searching & Analyzing: Use SPL to query and examine data.
- Reporting & Alerting: Visualize insights and set up notifications.
3. What are the main components of Splunk's architecture?
Splunk's architecture mainly comprises these components:
- Splunk Forwarders: These agents collect data from various sources and forward it to Splunk indexers. There are different types of forwarders like Universal Forwarder (UF) and Heavy Forwarder (HF).
- Splunk Indexers: They process, parse, and index the data received from forwarders. Indexed data is stored for searching and analysis.
- Splunk Search Heads: These provide the user interface for searching, analyzing, and visualizing the indexed data. They distribute search requests to indexers and consolidate the results.
- Deployment Server: This central instance manages and distributes configurations, apps, and updates to forwarders in the Splunk environment.
- License Master: Manages Splunk licenses.
4. What types of data can Splunk ingest?
Splunk can ingest a wide variety of data types. It essentially handles any data that can be represented as a timestamped event. This includes structured data like CSV files and databases, semi-structured data such as JSON and XML, and unstructured data like application logs and network traffic. Essentially if you can get the data into a file, or stream it, Splunk can probably ingest it.
Specific examples include server logs, application logs, network packets (via tools like Wireshark or tcpdump), security events, system metrics, sensor data, and configuration files. Splunk achieves this through various input methods like file monitoring, network ports (TCP/UDP), APIs, and scripts.
5. How do you add data to Splunk?
Data can be added to Splunk using several methods. One common way is through forwarders, which are lightweight agents installed on systems that collect data and forward it to Splunk indexers. Alternatively, data can be ingested directly using the HTTP Event Collector (HEC) endpoint, often used for application logs or programmatic data ingestion. You can also upload files directly via the Splunk web interface or use scripted inputs to pull data from various sources.
Specifically, here are a few methods:
- Forwarders: Install a Splunk forwarder on the machine generating the data.
- HTTP Event Collector (HEC): Send data via HTTP requests to a specific endpoint.
- Splunk Web Interface: Upload files directly through the web UI.
- Scripted Inputs: Use scripts to collect data and pipe it to Splunk.
- Network Ports: Configure Splunk to listen on specific network ports (e.g., syslog).
6. What is an index in Splunk?
In Splunk, an index is a repository for storing and managing data. It's where Splunk stores the indexed events from your data sources. Think of it as a database optimized for fast searching and analysis of machine data.
Key aspects of a Splunk index include: Data is stored in time-based buckets, which aids in efficient searching within specific time ranges. Splunk can have multiple indexes, allowing you to segregate data based on source, type, or retention requirements. This separation can be very useful when applying role based access control (RBAC) as well.
7. Explain the difference between a forwarder and an indexer.
A forwarder in Splunk is responsible for collecting data from various sources and sending it to an indexer. Its primary job is data acquisition and routing. It can perform minimal parsing and filtering, but its main purpose is to get the data to the indexer efficiently. There are different types of forwarders like universal forwarder(UF), heavy forwarder(HF), and light forwarder(LF).
An indexer, on the other hand, receives the data from forwarders, parses it, transforms it, and then indexes it. Indexing makes the data searchable. The indexer also manages data storage and retention policies. Essentially, the indexer is where the heavy lifting of data processing and organization happens.
8. What is a search head?
A search head is a Splunk Enterprise component that handles search management and reporting. It serves as the central point for users to interact with Splunk, providing an interface to run searches, create reports, dashboards, and alerts across indexed data.
In essence, the search head distributes search requests to indexers, consolidates the results, and presents them to the user. It doesn't store indexed data itself; instead, it relies on indexers to perform the actual data retrieval. Search heads also manage user authentication, authorization, and search-time knowledge objects like lookups, saved searches, and event types. Search head clusters can be implemented for high availability and scalability.
9. What is the purpose of Splunk's search processing language (SPL)?
The purpose of Splunk's Search Processing Language (SPL) is to enable users to search, analyze, and visualize machine-generated data. It acts as the primary interface for interacting with Splunk's data indexing and retrieval capabilities. SPL allows users to extract meaningful insights from raw data, identify patterns, and generate reports.
Essentially, SPL provides a powerful and flexible way to transform raw data into actionable intelligence. It uses a pipeline-based approach, where each command processes the output of the previous command. This enables complex operations to be performed by chaining together a series of commands.
10. Give a basic example of an SPL search query.
A basic SPL search query searches for events containing a specific keyword. For example:
index=_internal error
This query searches the _internal index for events containing the word error. The index=_internal part specifies the index to search, and error is the search term. More complex queries can chain commands using the pipe | character for filtering, transforming, and reporting on the results.
11. What is a field in Splunk?
In Splunk, a field is a name-value pair that represents a specific piece of information extracted from your data. Fields are crucial for searching, reporting, and analyzing data within Splunk. Splunk automatically extracts default fields like host, source, and sourcetype but you can also define custom fields to capture specific data points relevant to your logs or events.
Fields are what enable you to filter your search results, perform statistical calculations, and build dashboards. They essentially provide the structure for making sense of the raw, unstructured data that Splunk ingests.
12. How can you extract fields from your data in Splunk?
Splunk offers several ways to extract fields from data during search time or index time. Common methods include using the rex command with regular expressions, the extract command for field extractions based on delimiters, and field extractions through Splunk Web using interactive field extractor (IFX). Index-time field extractions involve configuring props.conf and transforms.conf to define how fields are extracted during the indexing process, optimizing search performance.
For example:
- rex command:
| rex field=_raw "(?<myfield>\d+)" - extract command:
| extract pairdelim="," kvdelim="=" limit=10 - IFX: Using Splunk Web's interactive field extractor, you can visually select data and define field names.
13. What are tags and how are they useful?
Tags are labels or keywords assigned to resources (e.g., files, images, cloud resources, database records) to categorize and organize them. They are metadata that provide additional context and make it easier to find, manage, and automate actions on these resources.
Tags are useful for several reasons:
- Organization: Group related resources together, regardless of their location or type.
- Search and Filtering: Quickly locate specific resources based on their tags.
- Automation: Trigger actions based on tags (e.g., automatically backing up resources with a specific tag).
- Cost Management: Track costs associated with specific projects or departments by tagging related resources. For example in AWS you could tag EC2 instances:
"Project":"MyProject" - Access Control: Control access to resources based on their tags.
14. What are event types, and why would you use them?
Event types are classifications or categories of events that occur within a system or application. They provide a way to differentiate between various actions, occurrences, or state changes, allowing specific responses to be triggered based on what kind of event happened. Examples include click events, mouseover events, data_received events, or custom-defined events specific to an application's domain. Using event types is crucial for building responsive and decoupled systems.
You would use event types to:
- Decouple components: Different parts of the system can react to events without needing to know the specifics of the event's origin.
- Implement asynchronous behavior: Allows processing events as they occur, rather than in a rigid, sequential manner.
- Create modular and extensible architectures: New event handlers can be added without modifying existing code.
- Improve code maintainability: Event-driven designs often lead to more organized and easier-to-understand code.
- Example:
# Define an event type
event_type = "user_logged_in"

# Dispatch an event of that type
dispatch_event(event_type, user_data)

# Handler function
def handle_user_login(user_data):
    print(f"User logged in: {user_data}")

# Register the handler for the event type
register_handler(event_type, handle_user_login)
15. What is a dashboard in Splunk?
A Splunk dashboard is a visual representation of data, typically used to monitor key performance indicators (KPIs) and gain insights into system behavior. It's composed of panels, each displaying data in a specific format, such as charts, tables, or single values.
Dashboards provide a centralized view of critical information, allowing users to quickly identify trends, anomalies, and potential issues. They are configurable and can be tailored to meet the specific needs of different users or teams.
16. How do you create a simple dashboard?
Creating a simple dashboard involves several key steps. First, define the purpose and audience to determine which metrics are most relevant. Next, gather the necessary data from your data sources. This often involves querying databases or APIs. Then, choose a visualization tool (e.g., Google Sheets, Tableau Public, Grafana for technical dashboards).
With your tool selected, design the layout focusing on clarity and ease of understanding. Use appropriate chart types (e.g., line charts for trends, bar charts for comparisons). Finally, regularly update the data to keep the dashboard current and relevant.
17. What are reports in Splunk?
Reports in Splunk are saved searches that provide a snapshot of data at a specific point in time. They help users monitor trends, identify anomalies, and gain insights from their data without repeatedly running the same searches.
Reports can be scheduled to run automatically, and their results can be displayed in dashboards, emailed to users, or used to trigger alerts. They essentially streamline data analysis by automating search execution and result presentation.
18. Can you explain the difference between real-time search and historical search?
Real-time search focuses on providing results about current events or information that is changing rapidly. The index is constantly updated to reflect the latest data, and results aim to be near-instantaneous. Think of searching for trending news topics or live stock prices. Historical search, on the other hand, deals with retrieving information from a static or less frequently updated dataset. It's used for finding past events, archived documents, or data that doesn't change rapidly. Think of searching through historical records or research papers. The key difference is the freshness and volatility of the data being searched.
19. How can you schedule a report to run automatically?
The method to schedule a report to run automatically depends on the reporting tool being used. Common approaches include using the built-in scheduling features of the reporting software itself, or leveraging an external scheduler like cron (on Linux/Unix systems) or the Windows Task Scheduler.
For example, tools like Tableau, Power BI, and SSRS (SQL Server Reporting Services) have integrated scheduling functionalities. You can define the report, the desired frequency (daily, weekly, monthly), and the time of execution directly within the report's configuration. The system then automatically generates and distributes the report according to the specified schedule.
20. What is a Splunk app?
A Splunk app is a pre-packaged collection of configurations, dashboards, reports, alerts, and other knowledge objects that extends Splunk's functionality for a specific use case or data source. Think of it as a plugin that provides a tailored experience for analyzing and visualizing a particular type of data.
Apps simplify the process of onboarding and analyzing new data sources by providing pre-built tools and configurations. They reduce the need for users to manually create dashboards, reports, and alerts from scratch, saving time and effort. Apps can focus on specific technologies (e.g., Cisco security), industries (e.g., retail analytics), or use cases (e.g., IT operations).
21. How do you install an app in Splunk?
To install an app in Splunk, the most common method is through the Splunk Web interface. Navigate to the 'Apps' section, usually found on the left-hand navigation bar. Then, click on 'Install app from file' or 'Find More Apps'. If you have the app package (a .spl file), use the 'Install app from file' option and upload the file. For apps available on Splunkbase, use the 'Find More Apps' option, search for the desired app, and click 'Install'. You might be prompted for your Splunk.com credentials to proceed.
Alternatively, you can manually install an app. Extract the contents of the .spl file into the $SPLUNK_HOME/etc/apps directory. After extracting, Splunk needs to be restarted for the app to be recognized. Keep in mind that manual installation might require adjusting file permissions to ensure Splunk can access the app's files.
22. What are lookups in Splunk?
Lookups in Splunk are a way to enrich your event data with external information. They essentially map fields in your events to fields in an external source, adding new fields to your events during the search process. This allows you to correlate your data with additional context like user attributes, geographical locations, or threat intelligence data.
There are several types of lookups:
- CSV lookups: Use CSV files to map values.
- External lookups: Use scripts or executables to perform the lookup.
- KV Store lookups: Use Splunk's Key Value Store for lookups.
- Geographic lookups: Map IP addresses to geographical locations.
| lookup <lookup_table> <lookup_field> AS <event_field> OUTPUT <new_field> is the basic syntax for using the lookup command in Splunk.
23. How can you use lookups to enrich your data?
Lookups enrich data by adding relevant context from external sources, enhancing analysis and decision-making. For example, you might use a lookup table to add customer demographic information (age, location) based on customer IDs in your transaction data. This allows you to analyze sales trends by demographic groups.
Specifically, consider IP addresses. A lookup service can provide the geographical location (country, city) and possibly the organization associated with that IP. If you have web server logs with IP addresses, using a lookup dramatically enriches that data. In Python, this could be done with:
import geoip2.database

def enrich_ip(ip_address):
    reader = geoip2.database.Reader('GeoLite2-City.mmdb')
    try:
        response = reader.city(ip_address)
        return {
            'city': response.city.name,
            'country': response.country.name
        }
    except Exception as e:
        return None
24. What is the purpose of the Splunk Common Information Model (CIM)?
The Splunk Common Information Model (CIM) serves as a shared semantic model focused on extracting value from data. Its primary purpose is to normalize data from different sources into a common structure, allowing users to analyze and correlate events across diverse datasets more easily. This abstraction simplifies searching, reporting, and creating dashboards because you can use the same queries regardless of the original data source. It ensures consistency, enabling faster investigation and better insights.
The CIM achieves this by defining a set of fields and tags for various event types (e.g., authentication, network traffic, malware). When data conforms to the CIM, analysts can leverage pre-built dashboards, reports, and correlation searches. The CIM also provides a framework for developing new content that works across all CIM-compliant datasets.
25. What is the difference between transforming and non-transforming commands?
Transforming commands modify the original data source, while non-transforming commands do not. For example, in Linux, mv (move) is a transforming command because it physically moves the file, altering the filesystem. cp (copy) is non-transforming as it creates a new file leaving the original untouched.
In the context of data processing (like with Spark or Pandas), transforming operations create a new dataset based on the original, leaving the original dataset unchanged. Non-transforming operations typically involve actions like reading data, displaying summaries (e.g., describe() in Pandas), or writing data to a destination, without altering the source data. Understanding this difference is crucial for data integrity and debugging pipelines.
26. What is the purpose of using wildcards in Splunk searches?
Wildcards in Splunk searches serve as placeholders, enabling you to match multiple terms without specifying each one exactly. They are useful when you don't know the exact term you're looking for, or when you want to broaden your search to include variations of a term. The primary wildcards are * (matches zero or more characters) and ? (matches a single character).
For example, searching for error* will match "error", "error_message", "error_code", etc., whereas err?r would match "error" and "error".
27. What are some best practices for writing efficient Splunk searches?
When writing Splunk searches, focus on filtering data as early as possible in the search pipeline. Use specific indexes and where clauses to reduce the amount of data that subsequent commands need to process. Leverage field extractions at index time to avoid runtime extractions. Using fields command to select only necessary fields improves performance.
Avoid using wildcard characters at the beginning of your search terms, as they can significantly slow down the search. Instead of using *error*, consider error. Use tstats for statistical summaries as it uses indexed data, improving speed, instead of the stats command which searches the events. timechart can be more efficient for time-series data visualization. Be mindful of using eval and regex commands, as they can be resource-intensive; explore alternative methods like case or pre-extracted fields where possible. Use dedup to remove redundant events, but make sure to place it at appropriate place in search to limit data set.
28. How can you troubleshoot common Splunk issues, like data not being ingested?
To troubleshoot data ingestion issues in Splunk, start by checking the Splunk logs (splunkd.log) for errors related to the input configuration or connectivity problems. Verify that the input is properly configured, the forwarder is running and correctly configured to forward data to the Splunk indexers or heavy forwarders. Network connectivity between the data source, forwarder, and indexer should be tested using tools like ping or telnet. Ensure firewall rules are not blocking the traffic on the configured port.
Further investigation involves examining the input configuration file (e.g., inputs.conf) for syntax errors, incorrect source types, or missing required fields. Confirm that the indexer is running and has sufficient resources, and that the index exists and is properly configured. Check the monitoring console in Splunk for any health alerts related to the forwarders or indexers and make sure the data source is actually producing data. For example, if monitoring logs, check the target application to see if the log file is being updated.
29. Explain what role-based access control means in Splunk.
Role-Based Access Control (RBAC) in Splunk is a security mechanism that restricts system access to authorized users based on their roles within an organization. It allows administrators to define roles with specific permissions, determining what actions users assigned to those roles can perform within Splunk. This controls access to data, capabilities, and configurations.
RBAC in Splunk works by assigning capabilities (specific permissions) to roles. Users are then assigned to one or more roles. When a user logs in, Splunk evaluates the roles assigned to them and grants them the combined set of permissions associated with those roles. This enables a least-privilege approach, where users only have access to the resources and actions necessary for their job functions, improving security and compliance.
Intermediate Splunk interview questions
1. How would you handle a situation where Splunk is ingesting duplicate logs, and what steps would you take to identify the source of the duplication and prevent it from happening again?
To handle duplicate logs in Splunk, I'd first identify the extent of the problem using a search like index=* | stats count by _raw | where count > 1. This helps determine the scope and frequency of the duplication. Next, I'd investigate potential sources:
- Forwarder Configuration: Check for misconfigured forwarders sending the same logs multiple times. Look for overlapping inputs or incorrectly configured filters in
inputs.conf. Also, investigate if the forwarder is configured to send data to multiple Splunk indexers unintentionally. - Input Configuration: Examine the input configuration on the Splunk indexers. Multiple inputs might be inadvertently configured to monitor the same log files.
- Network Issues: Transient network problems can sometimes cause forwarders to resend data. Review forwarder logs for connection errors or timeouts.
- Splunk Clustering: In a clustered environment, ensure that data is not being indexed multiple times due to replication issues.
To prevent recurrence, I would implement deduplication techniques such as using the dedup command in search queries for reporting, or configure the crcSalt attribute in inputs.conf to prevent the same data from being indexed multiple times. Monitoring forwarder and indexer logs regularly is also key.
2. Can you explain the difference between a transforming search and a non-transforming search in Splunk, and provide an example of when you would use each?
A transforming search in Splunk changes the underlying data structure, typically to create statistics or visualizations. It uses commands like stats, chart, timechart, and top. These commands aggregate or manipulate the events, altering the raw data into a tabular format suitable for analysis. For example, index=web | stats count by status_code transforms raw web server logs to a table showing the count of each HTTP status code. You'd use this to generate a dashboard panel showing website status over time.
A non-transforming search, on the other hand, retrieves events that match specific criteria without changing their basic structure. Commands like search, where, head, tail, sort, and regex are typically used. For example, index=web error returns all web server events containing the word "error" without changing the data. This is useful for identifying specific errors in your logs. You'd use this for incident investigations or debugging issues.
3. Describe your experience with creating and managing Splunk knowledge objects such as field extractions, event types, and tags. How do these objects improve the search experience and data quality?
I have extensive experience creating and managing Splunk knowledge objects. I've defined field extractions using both the Splunk Web interface and configuration files (props.conf, transforms.conf), utilizing regular expressions to accurately parse key data from various log sources. I've also created event types to categorize events based on common characteristics, allowing for more targeted searching and reporting. Furthermore, I've implemented tagging strategies to classify events based on specific attributes or contexts, improving searchability and correlation across different data sources.
These knowledge objects significantly enhance the search experience by simplifying complex queries. Users can search using event types and tags instead of intricate search processing language (SPL). They also improve data quality by ensuring consistent field naming and data categorization, which in turn enables more accurate reporting and analysis. Field extractions ensure that data is properly parsed and indexed, making it searchable and actionable. Consistent application of these objects ensures data is uniform and searchable.
4. Explain how you would use Splunk's Common Information Model (CIM) to normalize data from different sources, and what are the benefits of doing so?
Splunk's Common Information Model (CIM) is used to normalize data from diverse sources by mapping fields from various logs to a common set of fields and tags. This is done by installing and configuring the appropriate CIM add-ons for the data sources. These add-ons contain the knowledge objects (field extractions, event types, tags, etc.) necessary to normalize the data to the CIM. Data from different sources is mapped to the CIM's predefined fields (e.g., src_ip, dest_ip, user) using these knowledge objects.
The benefits include: simplified searching and reporting across different data sources, improved correlation of events, standardized dashboards and alerts that work across different data types, and easier knowledge sharing within an organization. Essentially, CIM enables you to treat data from different vendors (e.g., Cisco, CrowdStrike, Okta) consistently, making analysis and security operations more efficient and effective. This simplifies data management, enhances security posture, and accelerates incident response.
5. How do you monitor the health and performance of a Splunk environment, including indexers, search heads, and forwarders? What metrics are most important to track?
Monitoring Splunk health and performance involves tracking key metrics across indexers, search heads, and forwarders. Important metrics include: Indexing rate (events/second), search concurrency, CPU utilization, memory usage, disk I/O, network latency, and license usage. For forwarders, monitor connection status, data throughput, and error rates.
Tools like Splunk Monitoring Console, Distributed Management Console (DMC), and custom dashboards can be used to visualize these metrics. Setting up alerts for critical thresholds is crucial for proactive issue detection. Log files (splunkd.log) are also vital for troubleshooting and deeper analysis. For optimal resource utilization, proactively monitor the Splunk environment's search concurrency, indexing volume, and hardware capacity.
6. Describe a time when you had to troubleshoot a slow-running Splunk search. What steps did you take to identify the bottleneck and improve performance?
During a recent project, users reported slow performance with a Splunk search used for monitoring application errors. Initially, I examined the search query itself using the Splunk Search Job Inspector. This helped identify that the search was scanning a large volume of data unnecessarily. I then focused on optimizing the query.
My approach involved several steps:
- Refined the time range: I narrowed the search to only the relevant time window when the issue was reported.
- Optimized the indexes: I made sure that the search was using only the relevant indexes and that the indexes were properly configured for the specific data being searched.
- Used filtering early: I moved filtering criteria (using
whereorsearchcommands) to the beginning of the search pipeline to reduce the amount of data processed downstream. - Leveraged field extractions: Ensured field extractions were efficient and used field aliases where appropriate to avoid repeated string parsing.
- Summarization: For recurring searches I created summary indexes. Scheduled searches populated these indexes with pre-calculated aggregates, dramatically speeding up reporting.
7. Explain how you would use Splunk's alerting capabilities to detect security threats or operational issues, and what best practices do you follow when creating alerts?
To detect security threats or operational issues using Splunk's alerting, I'd define searches that look for specific events or patterns indicative of a problem. For example, I might create an alert that triggers when there are multiple failed login attempts from a single IP address within a short timeframe, indicating a potential brute-force attack, or alert if a server's CPU usage exceeds a threshold. Splunk's real-time alerting lets me take immediate action when these events happen.
Best practices include: making alerts specific to reduce false positives, using appropriate severity levels, defining clear trigger conditions, using throttling to avoid alert storms, and including runbooks with alerts so responders know what action to take. For example, I would ensure that the search is optimized for speed and efficiency by using proper indexing and filters. I also always document the alert's purpose, trigger conditions, and recommended actions.
8. Can you describe the process of setting up a distributed Splunk environment, including considerations for indexer clustering and search head pooling?
Setting up a distributed Splunk environment involves several key steps. First, you need to plan your deployment based on your data volume and search requirements. This includes deciding on the number of indexers and search heads. For indexer clustering, you'll designate one indexer as the master node and others as peer nodes. The master node manages the cluster configuration and replication. To configure this, you'll modify the server.conf file on each node, specifying the master node's details and setting up replication factors. This configuration ensures data redundancy and availability. Search head pooling involves configuring multiple search heads to share the search workload. This is achieved by designating a deployer, which pushes configurations to the search heads. You'll configure the search heads to point to the indexer cluster. Configuration of search head clustering also goes in server.conf.
Key considerations include network bandwidth, storage capacity, and security. Ensure sufficient bandwidth between indexers for replication. Use fast storage for the indexers to optimize performance. Implement appropriate authentication and authorization mechanisms to secure your Splunk environment. Monitoring the health and performance of each component is also crucial for maintaining a stable and efficient distributed Splunk setup.
9. How would you use Splunk to analyze network traffic data, such as NetFlow or packet captures, to identify potential security threats or performance bottlenecks?
To analyze network traffic with Splunk, I'd first ingest NetFlow or packet capture data using a Splunk forwarder or a technology add-on tailored for the specific data source. Then, I would use Splunk's search processing language (SPL) to extract relevant fields like source/destination IP, ports, protocols, and traffic volume. To identify security threats, I would correlate network traffic with threat intelligence feeds, looking for communication with known malicious IPs or domains. I would also look for anomalous traffic patterns, like unusual port usage, spikes in traffic volume, or connections to unfamiliar geographical locations.
For performance bottlenecks, I would analyze network latency, packet loss, and bandwidth utilization. I'd create dashboards and visualizations to monitor key performance indicators (KPIs) such as round-trip time (RTT) and throughput. By analyzing these metrics, I can pinpoint areas where network performance is degraded and take corrective actions. Splunk's alerting capabilities can be configured to notify administrators when certain thresholds are exceeded, enabling proactive identification and resolution of network issues.
10. Describe your experience with using Splunk's Machine Learning Toolkit (MLTK) to build predictive models or detect anomalies in data.
I have experience using Splunk's Machine Learning Toolkit (MLTK) for both predictive modeling and anomaly detection. In a previous role, I utilized MLTK to predict server downtime based on historical performance metrics. This involved using algorithms like linear regression and time series forecasting models available within MLTK. I used the Smart Forecasting assistant and customized the underlying SPL queries for specific business needs. I also experimented with different algorithms and feature engineering to improve the model's accuracy.
Furthermore, I've leveraged MLTK for anomaly detection in network traffic data. I employed clustering algorithms, specifically k-means, to identify unusual patterns and deviations from normal behavior. The detected anomalies were then used to trigger alerts and initiate investigations. The process involved using SPL to preprocess the data, selecting relevant features, training the model, and then using the apply command to score new events and flag them as potential anomalies. I have also used outlier detection models within MLTK like DensityFunction and Quantile for identifying rare events.
11. Explain how you would use Splunk to audit user activity and access to sensitive data, and what compliance requirements can Splunk help address?
To audit user activity and access to sensitive data using Splunk, I would first configure Splunk to ingest logs from various sources like operating systems (Windows Event Logs, Linux auth logs), databases (audit logs), applications, and network devices. Then, I would create specific searches and dashboards focused on user authentication events (logins, logouts, failed attempts), data access patterns (read/write operations on sensitive files or databases), and privileged user activity (sudo commands, changes to access control lists). These searches could trigger alerts when anomalous or suspicious activity is detected, such as unusual login locations, unauthorized data access, or privilege escalation attempts. Field extractions and lookups can be used to normalize and enrich the data to make it easier to correlate events and identify patterns.
Splunk can help address various compliance requirements such as HIPAA (by monitoring access to protected health information), PCI DSS (by tracking access to cardholder data), GDPR (by auditing data access and modification), and SOX (by monitoring financial system activity). By providing a centralized platform for log management, security monitoring, and reporting, Splunk enables organizations to demonstrate compliance to auditors and regulatory bodies. Pre-built compliance apps and dashboards in Splunk Enterprise Security can further streamline the compliance process by providing templates and reports tailored to specific regulations.
12. Can you describe the different types of Splunk licenses and how they impact the functionality and performance of the platform?
Splunk licenses govern the amount of data you can index per day. Several types exist, each affecting functionality differently. The primary ones are: Enterprise License (full functionality, data limits enforced), Free License (limited features, very small daily data limit, often 500MB), Forwarder License (allows forwarders to send data without consuming the indexing license), Developer License (for development/testing, restricted use). Exceeding your licensed daily volume typically results in search results being suppressed or warnings being shown. Functionality wise, the free license lacks user authentication, alerting, and distributed search capabilities, impacting the overall usability of the platform for larger deployments. Performance is primarily affected by data volume, but incorrect license allocation might also lead to throttling and slower search speeds.
13. How would you use Splunk to analyze web server logs to identify website performance issues, security threats, or user behavior patterns?
To analyze web server logs using Splunk, I would first ingest the logs into Splunk. Then, I would use Splunk's search processing language (SPL) to extract relevant fields like timestamp, client IP address, HTTP status code, URI, user agent, and response time. For performance issues, I'd focus on slow response times, high error rates (5xx status codes), and resource utilization (e.g., requests per second). I'd create visualizations like time charts and dashboards to monitor these metrics. For security threats, I'd look for unusual activity, such as multiple failed login attempts from a single IP address, requests for suspicious URLs, or large amounts of data being downloaded. I'd create alerts to notify me of potential threats. To understand user behavior, I would analyze page views, session duration, navigation paths, and geographic locations. Using Splunk's stats command, I can aggregate data to identify popular pages, common user flows, and areas where users are dropping off.
Specific examples using SPL might include index=webserver status=500 | stats count by uri to identify error-prone URLs, or index=webserver action=login failed | stats count by src_ip | where count > 10 to flag potential brute-force attacks. I'd also use Splunk's field extractions and lookups to enrich the log data with additional information, such as user demographics or threat intelligence data.
14. Describe your experience with integrating Splunk with other security tools, such as SIEMs, firewalls, or intrusion detection systems.
I have experience integrating Splunk with various security tools to enhance threat detection and incident response capabilities. Specifically, I've integrated Splunk with SIEM platforms like QRadar and ArcSight to forward logs and alerts, enabling centralized monitoring and analysis. This involved configuring forwarders to collect data from the SIEM and transforming it into a Splunk-compatible format using configurations like props.conf and transforms.conf.
Furthermore, I've integrated Splunk with firewalls (e.g., Palo Alto Networks, Cisco ASA) and intrusion detection systems (IDS) like Suricata and Snort. These integrations involved configuring the firewalls and IDS to send syslog data to Splunk forwarders, then parsing and normalizing the data within Splunk to create meaningful dashboards and alerts. I also leveraged Splunk's API to create automated response actions, such as blocking malicious IP addresses based on IDS alerts, effectively strengthening the security posture.
15. Explain how you would use Splunk to create dashboards and reports to visualize key performance indicators (KPIs) and trends for different stakeholders.
To create dashboards and reports in Splunk for visualizing KPIs and trends, I'd start by identifying the specific KPIs relevant to each stakeholder group. Next, I would craft Splunk queries using SPL (Search Processing Language) to extract the necessary data from relevant log sources or indexed events. These queries would perform calculations and aggregations to derive the KPI values. Finally, I would use Splunk's dashboarding and reporting features to present the data visually. Dashboards would contain charts, tables, and gauges, each visualizing a specific KPI. Reports could be scheduled to automatically generate and distribute visualizations of trends over time to specific stakeholders via email or other means. For example, a Sales KPI dashboard would track revenue growth, deal closing rates, and pipeline value. A Security KPI dashboard would show security incidents, vulnerabilities, and compliance status.
16. How do you approach optimizing Splunk search queries for efficiency, especially when dealing with large datasets or complex logic?
When optimizing Splunk search queries, especially with large datasets, I focus on several key areas. First, I try to reduce the amount of data Splunk needs to process early in the search pipeline by using specific indexes and time ranges. For example, index=web sourcetype=access_* earliest=-1h is better than searching all time across all indexes. Then, I leverage filtering commands like where and search efficiently. For instance, using search status_code=200 is generally faster than using where status_code==200. Also, I prioritize using the fields command to extract only the necessary fields as soon as possible, thus reducing memory usage. Finally, I would use the stats command effectively for aggregations and use summarize command when possible, avoiding inefficient commands like dedup when other commands suffice.
Further optimization involves understanding Splunk's search processing order. For complex logic, breaking down the search into smaller, manageable subsearches can improve performance. It's crucial to avoid using append or appendcols if a join command can be used instead, as these commands can be very inefficient. Furthermore, it is good to optimize knowledge objects (like saved searches, data models, etc.) which could have downstream benefits.
17. Explain your understanding of data retention policies in Splunk and how you would implement them to manage storage costs and compliance requirements.
Data retention policies in Splunk are crucial for managing storage costs and meeting compliance requirements. They define how long Splunk keeps indexed data before it's archived or deleted. Implementing these policies typically involves configuring indexes.conf with settings like frozenTimePeriodInSecs which determines how long data is kept in the hot/warm buckets before being moved to cold/frozen buckets. We can also use the maxTotalDataSizeMB parameter to define the maximum size of an index, triggering data deletion or archival once the limit is reached.
To implement data retention, I would first analyze data usage patterns and compliance needs to determine appropriate retention periods for different data types. Then, I'd configure indexes.conf accordingly, setting retention periods based on index. For example, I might retain security logs for a longer period than application logs. I would also use Splunk's built-in archiving capabilities to move older data to cheaper storage, such as Amazon S3 or Glacier, while still maintaining the ability to search it if needed. Regularly monitoring index sizes and retention settings is essential to ensure compliance and optimize storage costs.
18. Describe a situation where you had to create a custom Splunk app. What were the challenges, and how did you overcome them?
In a previous role, I needed to create a custom Splunk app to monitor a legacy application's performance, as no existing app adequately addressed its specific data format and requirements. The biggest challenge was parsing the application's unusual log structure. I overcame this by using Splunk's regex capabilities to create custom field extractions.
Specifically, I utilized the rex command and created several new search-time field extractions in props.conf to properly structure the data. I also built custom dashboards and alerts within the app using Splunk's Simple XML to visualize the application's key performance indicators. I also wrote a few python scripts for some custom lookups. This app gave the team far better visibility into the legacy application's health.
19. Explain the importance of using field extractions and how they contribute to more efficient searching and analysis in Splunk.
Field extractions in Splunk are crucial because they transform unstructured data into structured, searchable information. By parsing raw events and assigning meaningful names to specific data points, they dramatically improve search efficiency. Without field extractions, you'd have to rely on less efficient keyword searches within the entire raw event data, slowing down queries and making analysis cumbersome.
Field extractions enable you to directly target specific fields in your search queries. This means faster search times, as Splunk can index and retrieve data more efficiently. Furthermore, extracted fields allow you to use Splunk's more powerful analytical features, such as statistical calculations, reporting, and visualizations, which are difficult or impossible to perform effectively on unstructured data. For example, instead of searching for "error code 500", you can extract a field called error_code and then search for error_code=500 which is much faster and more accurate.
20. How would you use Splunk to monitor and troubleshoot issues related to cloud-based infrastructure, such as AWS or Azure?
To monitor and troubleshoot cloud infrastructure with Splunk, I'd start by ingesting relevant data sources using Splunk Connect for AWS/Azure or similar. This includes logs from services like EC2, Lambda, S3 (AWS), or Virtual Machines, Azure Functions, Blob Storage (Azure), as well as metrics from CloudWatch or Azure Monitor. Dashboards would be created to visualize key performance indicators (KPIs) such as CPU utilization, memory usage, network traffic, and error rates.
For troubleshooting, I'd use Splunk's search processing language (SPL) to correlate events across different services, identify root causes of issues, and set up alerts for anomalies or critical events. For example, I'd create alerts that trigger when CPU utilization exceeds a certain threshold or when error rates spike. Splunk's machine learning capabilities could be used to detect unusual patterns and predict potential problems before they impact the system. I would also configure distributed tracing using tools like Jaeger or Zipkin, and integrate that data into Splunk for end-to-end visibility across microservices.
Advanced Splunk interview questions
1. How would you optimize a Splunk search that is running slowly, and what tools would you use to identify the bottleneck?
To optimize a slow Splunk search, I would first identify the bottleneck using tools like the Job Inspector. The Job Inspector provides detailed performance metrics about each stage of the search, highlighting areas consuming the most resources (CPU, memory, I/O). I would look for events scanned, CPU utilization and the duration of different search phases.
Based on the bottleneck, I would apply optimization techniques like:
- Using indexes effectively: Ensure the search uses the most relevant index. Use
index=to specify indexes. - Filtering early: Filter out irrelevant events as early as possible in the search using
whereorsearchcommands with specific criteria. - Optimizing subsearches: Evaluate the efficiency of any subsearches. Sometimes rewriting them as joins or lookups can improve performance.
- Using field extractions at index time: If possible, extract fields at index time rather than search time.
- Summarization: Consider using summary indexes to pre-calculate aggregates for common searches.
- Limit result set: Use head and tail, or a time range to limit the amount of data being returned in the search.
- Using tstats: To create statistical reports,
tstatsuses accelerated data stores, and offers much faster performance.
2. Describe a complex Splunk search you've built, detailing the problem it solved, the techniques you used, and any challenges you overcame.
I once built a complex Splunk search to identify anomalous user behavior indicative of potential data exfiltration attempts. The problem was that simple threshold alerts based on login counts or data access volumes generated too many false positives. I needed to correlate several factors to paint a more accurate picture. My search correlated login times, accessed file types, geographic locations, and network traffic volume for each user over a specific time window. I used several advanced techniques, including transaction to group related events, geostats to visualize login locations, and statistical functions like stdev and avg to identify deviations from normal behavior.
The main challenge was performance. Initial searches were slow due to the large volume of data. I optimized the search by using field extractions at index time, limiting the time range to only what was necessary, and using summarize to reduce the amount of data processed in subsequent stages. I also created lookup tables to store user's typical access patterns which drastically reduced search time. The final search significantly reduced false positives and provided a prioritized list of users for investigation.
3. Explain how you would implement a data retention policy in Splunk to manage storage costs and ensure compliance.
To implement a data retention policy in Splunk, I'd primarily use indexes and their associated configurations. Splunk allows setting a maximum age for events stored in each index using the maxDataAge attribute in indexes.conf. When data exceeds this age, Splunk automatically archives or deletes it, helping manage storage costs. I would also consider using data roll policies where hot buckets roll to warm, then cold, and eventually are archived/deleted. For compliance, I'd ensure the retention period aligns with regulatory requirements and implement audit logging to track data deletion activities, providing a clear record of compliance efforts.
Furthermore, I'd leverage Splunk's bucket lifecycle management features. We can define the sizes of hot, warm, and cold buckets. When a bucket reaches a certain size or age threshold, it rolls to the next stage. Cold buckets can then be archived to cheaper storage or deleted based on the frozenTimePeriodInSecs setting. Regular monitoring of index sizes and retention policy effectiveness is crucial to proactively address potential storage issues and maintain compliance.
4. What are the key considerations when designing a Splunk deployment for high availability and disaster recovery?
When designing a Splunk deployment for high availability (HA) and disaster recovery (DR), several key considerations come into play. For HA, focus on eliminating single points of failure through redundancy. This includes using search head clustering for distributed search and user interface access, indexer clustering for data replication and management (ensuring multiple copies of data across different indexers), and deploying load balancers to distribute traffic across search heads and indexers. A monitoring solution is also critical for proactive detection of failures.
For DR, the goal is to maintain business continuity in the event of a complete site outage. This involves replicating data to a secondary DR site, typically using a mechanism like storage replication or Splunk's built-in features for site recovery. Define a clear Recovery Point Objective (RPO) and Recovery Time Objective (RTO) to guide the design and implementation. Regularly test the DR plan to ensure it works as expected and to identify potential issues. This includes automating the failover and failback processes as much as possible to minimize downtime. Also, consider the network bandwidth and latency between the primary and DR sites, as they can impact replication performance and recovery time.
5. How can you use Splunk's machine learning capabilities to detect anomalies in your data, and what are the limitations?
Splunk's Machine Learning Toolkit (MLTK) and associated apps provide several ways to detect anomalies. You can use pre-built algorithms like AnomalyDetection which models historical data and identifies deviations from the norm. Other methods include clustering algorithms to group similar events and flag outliers, or using forecasting to predict future values and compare them against actual values. Custom searches leveraging statistical commands like stdev, mean, and relative_deviation can also pinpoint unusual spikes or drops. These methods require properly formatted and indexed data, and often necessitate fine-tuning thresholds or model parameters to avoid false positives or negatives.
Limitations include the need for sufficient historical data to train models effectively; models are only as good as the data they are trained on. Also, algorithms may struggle with seasonality or trends, requiring specific handling or feature engineering. Complex anomalies or those dependent on multiple variables can be challenging to capture with simpler methods, potentially needing more advanced or custom ML models. Finally, explaining anomaly detections to non-technical stakeholders can sometimes prove difficult.
6. Discuss your experience with Splunk's Common Information Model (CIM) and how it can be used to normalize data from different sources.
I have experience using Splunk's Common Information Model (CIM) to normalize data from diverse sources. The CIM provides a standardized schema for representing data, allowing for consistent searching, reporting, and correlation across different data types. My experience involves mapping fields from various data sources (e.g., firewall logs, web server logs, endpoint data) to the corresponding CIM fields. This enables me to use CIM-compliant searches and dashboards to analyze data uniformly, regardless of its original source. This makes it easier to identify trends, investigate security incidents, and generate reports across the entire IT infrastructure.
Specifically, I've worked with CIM acceleration and knowledge objects like tags and aliases to ensure efficient search performance. This involves validating that data conforms to the CIM schema by using the CIM validation dashboard and field extractions, as well as leveraging CIM-aware apps and add-ons to accelerate analysis and improve overall data usability within Splunk. My data onboarding workflows invariably include steps to ensure data aligns with CIM.
7. How would you troubleshoot a situation where Splunk is not indexing data as expected, and what steps would you take to resolve the issue?
When Splunk isn't indexing data, I'd start by checking the basics: Is the Splunk instance running? Is the forwarder configured correctly and sending data to the right indexers? Next, I'd examine Splunk's internal logs (index=_internal) for errors related to data ingestion, license violations, or connectivity problems with forwarders. I'd also verify that the inputs are properly configured (e.g., correct file paths, sourcetypes), and that there are no issues with transformations (props.conf, transforms.conf) preventing indexing.
8. Explain how you can use Splunk's REST API to integrate with other systems and automate tasks.
Splunk's REST API allows integration with other systems and automation of tasks by providing programmatic access to Splunk's functionalities. You can use it to perform searches, retrieve data, manage configurations, and trigger alerts externally. For example, you can use curl or a programming language like Python to interact with the API. Using it one can automate tasks like:
- Data Ingestion: Automatically forward data from external sources into Splunk.
- Configuration Management: Programmatically update Splunk configurations, such as adding new inputs or modifying existing ones.
- Alerting and Notifications: Integrate Splunk alerts with other systems, such as ticketing systems or notification platforms. For example, when a Splunk alert is triggered, the REST API can be used to automatically create a ticket in ServiceNow.
- Report Generation: Schedule and automate the generation of reports and dashboards.
9. Describe how you would set up role-based access control in Splunk to ensure that users only have access to the data they need.
To implement role-based access control (RBAC) in Splunk, I would first define roles based on job functions and the data they require. For example, a security analyst role might need access to security logs, while a marketing analyst role needs access to web server logs related to marketing campaigns. Next, I would create these roles in Splunk, specifying the capabilities they possess, such as the ability to search specific indexes or use particular commands. I would then assign users to the appropriate roles. Specifically:
- Create Splunk roles (e.g., security_analyst, marketing_analyst).
- Define capabilities for each role (index access, allowed commands).
- Assign users to roles. This ensures that users only have access to the data and functionalities relevant to their roles, enhancing security and compliance. I can use the Splunk UI or the command-line interface (CLI) to manage roles and users. For example,
splunk add role <role_name> -capability <capability_name>to add capabilities to a role.
10. How can you use Splunk dashboards to visualize key performance indicators (KPIs) and track trends over time?
Splunk dashboards are powerful for visualizing KPIs and tracking trends. You can create panels displaying key metrics using search queries. These queries can aggregate data, calculate rates, averages, or other relevant performance indicators. Splunk offers various chart types (line, bar, pie, etc.) to represent the data effectively. For trend analysis, use time-based charts displaying KPIs over specific periods.
To track trends, configure the time range picker to allow users to dynamically adjust the displayed timeframe. Use timechart command in your SPL queries for time-series visualizations. Alerts can also be set up based on KPI thresholds to proactively identify deviations from expected trends. For example, index=myindex sourcetype=mysourcetype | timechart count by category will generate a time series chart showing the count of events by category over time. Furthermore, you can use drilldowns to navigate from summary KPIs to more detailed dashboards for deeper analysis.
11. Discuss your experience with Splunk's alerting capabilities and how you would configure alerts to respond to critical events.
I have experience configuring Splunk alerts for various critical events. I've used both scheduled searches and real-time alerts, depending on the immediacy required. My typical workflow involves defining a search query that identifies the critical event, setting a threshold for triggering the alert, and configuring the appropriate actions. Actions can include sending email notifications, creating tickets in a ticketing system via scripts, or triggering webhooks to initiate automated remediation processes.
To configure alerts for critical events, I prioritize clear and actionable alerts. This includes crafting meaningful subject lines and message bodies that provide context about the event and its potential impact. I also configure appropriate severity levels (e.g., critical, high, medium) to prioritize responses. Furthermore, I consider alert suppression techniques, such as using "throttle" settings or correlation searches, to prevent alert fatigue from recurring events. For example, for monitoring error logs, I might set an alert to trigger if the count of 'ERROR' messages exceeds a certain threshold within a specific time window.
12. How would you use Splunk to investigate a security incident, and what types of searches would you run to identify the root cause?
To investigate a security incident using Splunk, I'd start by identifying the affected systems and users, and the timeframe of the incident. I would correlate logs from various sources like firewalls, intrusion detection systems, endpoint security tools, and application servers using Splunk's search processing language (SPL). I would begin by normalizing the data so as to avoid any incorrect assumptions/correlations.
Specific searches could include looking for unusual network traffic patterns (e.g., large data transfers to unknown IPs), failed login attempts followed by successful logins, suspicious process executions on endpoints, or changes to critical system files. Examples of SPL searches would be: index=firewall src_ip=* dst_ip=* bytes_out>1000000 | stats sum(bytes_out) by src_ip, dst_ip | sort - sum(bytes_out) to find large data transfers. Another example index=windows EventCode=4625 | stats count by Account_Name | sort -count | head 10 to find the accounts with the most failed login attempts. The goal is to identify the initial point of entry, lateral movement, and the scope of the compromise to determine the root cause, which might be a vulnerability, misconfiguration, or compromised credentials.
13. Explain how you can use Splunk's transaction command to group related events together and analyze them as a single unit.
The transaction command in Splunk groups events based on criteria like a common field (e.g., user ID, session ID) and time constraints. It allows you to treat a series of related events as a single transaction for analysis. This is useful for identifying patterns, calculating durations, and understanding event sequences.
For example, if you have web server logs with user IDs, you could use transaction user_id maxspan=10m to group all events for a specific user within a 10-minute window into a single transaction. You can then use functions like duration (to find total session duration) or eventcount to count events within the transaction. The start and end times are captured. You can also specify starting and ending events. Without a startswith or endswith parameter, any event can begin or end a transaction.
14. Describe how you would use Splunk to monitor the performance of a web application, and what metrics would you track?
To monitor a web application's performance using Splunk, I would first configure the application servers and any relevant infrastructure (databases, load balancers, etc.) to forward their logs to Splunk. I would then create dashboards and alerts based on specific metrics extracted from these logs.
Key metrics to track include: HTTP response codes (e.g., 200, 400, 500), response times for different URLs/endpoints, request rates (requests per second), error rates, CPU utilization on the servers, memory usage, database query performance, and network latency. I'd also monitor application-specific logs for exceptions or errors. Using Splunk's search processing language, I'd create queries to calculate these metrics, visualize them on dashboards, and set up alerts to notify me of any anomalies or performance degradations. For example, a query like index="web_logs" status_code>=500 | stats count by status_code can highlight server errors. Also, Splunk's Machine Learning Toolkit could be leveraged to establish baseline performance and detect deviations.
15. How can you use Splunk's lookup tables to enrich your data with additional information, and what are the benefits?
Splunk lookup tables enrich data by adding fields from external sources based on matching values in your indexed data. You define a lookup that maps a field in your events to a field in the lookup table. When Splunk processes an event, it checks the lookup table for a matching value and appends the corresponding fields to the event.
Benefits include: * Data Enrichment: Adding context like geographic locations or user roles. * Data Normalization: Standardizing data formats (e.g., converting country codes to full names). * Improved Search and Reporting: Facilitating more targeted searches and creating more informative reports by using the added fields. * Simplified Queries: Reducing the need for complex search commands by pre-joining data.
16. Discuss your experience with Splunk's data onboarding process, including how you would configure inputs and sourcetypes.
My experience with Splunk's data onboarding involves using Splunk Web, command-line interface (CLI), and configuration files to configure inputs. I've worked with various input types like files & directories, network ports (TCP/UDP), scripts, and APIs. When configuring inputs, I define the host, source, and most importantly, the sourcetype. I ensure data is properly indexed and searchable by assigning the appropriate sourcetype, leveraging Splunk's automatic sourcetype recognition where possible or defining custom sourcetypes using props.conf and transforms.conf when necessary. This involves specifying how Splunk should parse the data, including timestamp recognition, field extractions, and line breaking rules. Proper sourcetype configuration is key to accurate data analysis and reporting within Splunk.
When defining a custom sourcetype, I analyze the data format, identify key fields to extract, and determine the appropriate timestamp format. Then, I create or modify entries in props.conf to define the sourcetype and specify settings such as TIME_FORMAT, TIME_PREFIX, LINE_BREAKER, and FIELD_DELIMITER. Furthermore, I use transforms.conf to define regular expressions for field extractions via EXTRACT or REPORT stanzas, directing the data into properly named fields for improved searching and dashboarding. Example: in props.conf [mysourcetype] TIME_FORMAT = %Y-%m-%d %H:%M:%S,%3N and in transforms.conf [myextraction] REGEX = myfield=(.*?) REPORT = myextractionfields. This allows for clean structured data.
17. How would you use Splunk to comply with regulatory requirements, such as GDPR or HIPAA?
Splunk helps comply with GDPR and HIPAA by providing tools for data visibility, monitoring, and reporting, which are crucial for meeting regulatory requirements. For GDPR, Splunk can identify and track personal data across systems, enabling organizations to respond to data subject requests (e.g., right to access, right to be forgotten). It monitors data access and modifications, alerting on suspicious activities indicating potential breaches. For HIPAA, Splunk monitors access to protected health information (PHI), tracks user activity within healthcare systems, and generates audit trails to demonstrate compliance. Reports can be customized to show adherence to specific HIPAA requirements, like access controls and data security measures. We would configure alerts for unauthorized access and data exfiltration, use data masking techniques to protect sensitive data in logs and dashboards, and establish role-based access control within Splunk to limit who can view and interact with PHI or PII.
18. Explain how you can use Splunk's correlation searches to identify complex patterns of behavior across multiple data sources.
Splunk's correlation searches identify complex patterns by searching for related events across different data sources, then grouping these events into a single notable event. These searches use a scheduled search that triggers when specific conditions are met, indicating a potential security threat or operational issue. For example, a correlation search could detect a user logging in from an unusual location (identified through firewall logs) shortly after a failed login attempt (recorded in authentication logs).
Key elements include defining the search query, specifying the time window, and setting conditions for triggering a notable event. You can use commands like transaction to group related events based on common fields (e.g., user ID, session ID) and stats to identify statistical anomalies. Once a correlation search identifies a pattern, it generates a notable event that can be further investigated and acted upon using Splunk's incident response features.
19. Describe how you would use Splunk to monitor the health and performance of your Splunk deployment itself.
To monitor the health and performance of my Splunk deployment using Splunk, I'd leverage Splunk's built-in monitoring capabilities. Primarily, I'd use the Monitoring Console app (which is now integrated in Splunk Enterprise). This gives me dashboards and alerts for key metrics like indexing rate, search performance, resource utilization (CPU, memory, disk I/O), license usage, and replication status. I would focus on setting alerts for critical thresholds, such as high CPU usage on indexers, exceeding license quota, or delayed replication.
Furthermore, I would also configure alerts based on Splunk's internal logs ( _internal index). For example, I would create alerts that trigger on error messages related to search head clustering, indexer clustering, or data ingestion issues. Finally, I'd examine the 'splunkd_access.log' to identify potential security threats and performance bottlenecks related to user access and API calls. I can also use the Distributed Management Console for centralized monitoring in a distributed environment.
20. How can you use Splunk's SDKs to develop custom applications that integrate with Splunk?
Splunk's SDKs (available for languages like Python, Java, JavaScript, and others) allow developers to build custom applications that interact with Splunk programmatically. You can use the SDKs to perform tasks such as: searching Splunk data, creating and managing saved searches, ingesting data, and managing Splunk configurations. The general process involves installing the appropriate SDK for your chosen language, authenticating with a Splunk instance, and then using the SDK's methods to interact with Splunk's API.
For example, using the Python SDK, you might use code like this to search Splunk:
import splunklib.client as client

HOST = "localhost"
PORT = 8089
USERNAME = "admin"
PASSWORD = "changeme"

service = client.connect(host=HOST, port=PORT, username=USERNAME, password=PASSWORD)

kwargs_oneshot = {"earliest_time": "-1h", "latest_time": "now"}

oneshotsearch_results = service.jobs.oneshot("search index=_internal | head 10", **kwargs_oneshot)

for event in oneshotsearch_results:
    print(event)
This code authenticates, performs a simple search, and prints the results. Similar operations are available in other SDKs, allowing for integration tailored to your specific needs.
21. Discuss your experience with Splunk's cloud platform, including its advantages and disadvantages compared to on-premises deployments.
I have experience utilizing Splunk Cloud Platform for centralized log management, security monitoring, and application performance analysis. A significant advantage of Splunk Cloud is the reduced operational overhead, as Splunk handles infrastructure maintenance, upgrades, and scaling. This allows my team to focus on data analysis and deriving insights rather than managing servers. Another advantage is its scalability and flexibility; it's easy to increase resources as data volumes grow, and Splunk Cloud offers various deployment options to meet specific needs.
Compared to on-premises deployments, Splunk Cloud offers faster deployment and reduced upfront costs. However, a potential disadvantage is less direct control over the underlying infrastructure, which might be a concern for organizations with strict compliance requirements or very specific customization needs. Security is often cited as a potential concern, though Splunk Cloud offers robust security features, some organizations may prefer the perceived control of managing their own infrastructure. Network latency can also be a concern if logs originate from many locations.
22. Explain how you would use Splunk to predict future trends based on historical data, and what techniques would you use?
To predict future trends in Splunk, I would leverage its machine learning capabilities in conjunction with historical data. First, I'd ingest relevant historical data into Splunk and ensure proper field extraction. Then, I'd use the Machine Learning Toolkit (MLTK) to build predictive models. Specifically, time series forecasting algorithms like ARIMA or Prophet would be suitable for trend prediction. I would train the model on the historical data, evaluate its performance using metrics like Mean Absolute Error (MAE) or Root Mean Squared Error (RMSE), and iteratively refine the model by adjusting parameters or incorporating additional features.
Beyond MLTK, Splunk's search processing language (SPL) can be used for basic trend analysis. For example, I might use the timechart command to visualize trends over time, or the predict command (though MLTK provides more robust options) for simple forecasting. I would also consider using anomaly detection techniques to identify deviations from established trends, which could signal upcoming shifts. Finally, I'd schedule saved searches and alerts to proactively monitor for predicted trends and notify stakeholders of significant deviations, visualizing the results using dashboards.
Expert Splunk interview questions
1. How would you optimize a Splunk search that is performing poorly, and what tools or techniques would you use to identify the bottleneck?
To optimize a poorly performing Splunk search, I'd start by identifying the bottleneck. I'd use the Job Inspector (accessible from the search job's page) to examine search execution phases, resource utilization (CPU, memory, disk I/O), and the events timeline. Key metrics include the search ratio (events scanned vs. events returned), the time spent in each phase (parsing, indexing, searching), and any slow or resource-intensive search commands. I'd also use the splunkd.log file to check for errors or warnings related to the search.
Optimization techniques include: 1. Narrowing the time range. 2. Using specific indexes. 3. Filtering events early in the search pipeline using more precise terms in the base search. 4. Avoiding wildcard searches when possible. 5. Using transforming commands (e.g., stats, chart, timechart) efficiently, placing filtering conditions before them where appropriate. 6. Optimizing knowledge objects like lookups and event types. 7. Leveraging accelerated data models. 8. Avoiding subsearches where joins might be more efficient. For example, instead of index=A [search index=B ... | fields field1], consider a join command. Finally, reviewing and optimizing custom search commands or scripts is critical if they are involved.
2. Describe a complex Splunk deployment scenario you've designed, considering factors like high availability, disaster recovery, and scalability.
I designed a complex Splunk deployment for a large e-commerce company with strict uptime requirements. We implemented a clustered indexer layer with a search head cluster on top. For high availability, we deployed multiple indexers per site with replication factor 3 to ensure data redundancy, and the search head cluster had a minimum of three search heads behind a load balancer. For disaster recovery, we set up indexer clustering across two geographically separate data centers, using asynchronous replication from the primary to the DR site, enabling us to failover search and indexing operations in case of a site outage.
To ensure scalability, we implemented a hot/warm/cold/frozen architecture for the indexers and used smartstore for cost effective storage. We monitored the system using the Monitoring Console and configured alerts to proactively identify potential issues before they impacted the production environment. We also regularly reviewed the search head cluster's resource utilization and added search heads as needed to accommodate increased search load. Index lifecycle management was also key, to archive older data to cheaper storage to improve performance.
3. Explain how you would implement a custom alert in Splunk that triggers based on a specific anomaly detected in the data.
To implement a custom alert in Splunk for anomaly detection, I would first define the specific anomaly using Splunk's Search Processing Language (SPL). This involves crafting a search query that identifies the anomalous events based on statistical functions like avg, stdev, or trendline, or potentially utilizing machine learning commands like anomalydetection. For example, to detect a sudden spike in error counts I might use a query like index=my_index sourcetype=my_sourcetype ERROR | timechart count | trendline sma5 | where abs(trend-sma5) > 2* stdev.
Next, I would save this search as a scheduled alert. In the alert configuration, I'd define the trigger condition (e.g., "number of results is greater than 0"), the schedule (how often the search runs), and the actions to take when the alert triggers. Actions might include sending an email notification, creating a ticket in a ticketing system, or running a custom script to remediate the issue. I can also adjust the severity level of the alert based on the magnitude of the anomaly to prioritize responses.
4. What are the key considerations when designing a data onboarding strategy for a large, diverse set of data sources in Splunk?
When designing a data onboarding strategy for a large, diverse set of data sources in Splunk, key considerations include: Data Identification and Classification: Understanding the data's type, sensitivity, and compliance requirements is crucial. Scalability and Performance: Plan for the volume and velocity of incoming data, ensuring Splunk can handle the load. Consider using distributed deployment, heavy forwarders, and proper indexing strategies. Data Transformation and Enrichment: Determine if data needs cleaning, normalization, or enrichment before indexing. This might involve using props.conf, transforms.conf, or a dedicated data pipeline.
Other important aspects are: Security: Implement appropriate access controls and data masking techniques. Monitoring and Alerting: Set up dashboards and alerts to track data ingestion, identify errors, and ensure data quality. Data Governance: Establish policies and procedures for data retention, archiving, and deletion. Cost Optimization: Optimize data indexing and storage to minimize Splunk licensing and infrastructure costs. For example, consider using data summaries, filtering unwanted data, or routing specific data to cheaper storage tiers.
5. How would you troubleshoot a Splunk indexer cluster that is experiencing performance issues or data loss?
Troubleshooting Splunk indexer cluster performance or data loss involves several steps. First, check the health of each indexer using the monitoring console, focusing on CPU, memory, and disk I/O. Examine the splunkd.log files on each indexer for errors or warnings. Use the search command | dbinspect index=* to identify potential issues with individual indexes. Check replication factors and search factors to ensure proper redundancy.
If data loss is suspected, verify that the replication process is functioning correctly and that buckets are being replicated as expected. Examine the peer nodes connectivity and its logs. Use splunk show cluster-status to confirm connectivity between the cluster master and peers. For performance issues, profile search performance using the Search Processing Language (SPL) commands such as | profiler to identify slow-running searches. Consider increasing resources like CPU, memory or disk space if consistently bottlenecked. Review search head configurations and dispatch settings to optimize overall search performance. Also, check for network latency between the cluster components and the data sources.
6. Describe your experience with using the Splunk REST API to automate tasks or integrate with other systems.
I've used the Splunk REST API extensively to automate various tasks and integrate Splunk with other systems. For example, I've automated the creation and management of Splunk knowledge objects, like saved searches and dashboards, using Python scripts and the requests library. This allowed us to deploy standardized configurations across multiple Splunk environments consistently. I have also used the API to retrieve data from Splunk programmatically for use in external reporting tools and custom applications.
Specifically, I've worked with endpoints such as /services/saved/searches to create, modify, and delete saved searches. I also used the /services/search/jobs endpoint to trigger searches, monitor their progress, and retrieve results in formats like JSON or CSV. Error handling and authentication were crucial aspects of these integrations. I have used Splunk's token authentication and also implemented retry mechanisms to handle transient network issues. Below is an example of how I create a saved search.
import requests
import json

url = "https://splunk_server:8089/services/saved/searches"
headers = {
    'Authorization': 'Bearer <splunk_token>'
}
data = {
    'name': 'My Automated Search',
    'search': 'index=_internal | head 10',
    'description': 'This saved search was created via API'
}

response = requests.post(url, headers=headers, data=data, verify=False)

if response.status_code == 201:
    print("Saved search created successfully!")
else:
    print(f"Error creating saved search: {response.status_code} - {response.text}")
7. Explain how you would use Splunk's machine learning capabilities to detect and predict security threats or anomalies.
To detect and predict security threats using Splunk's machine learning, I'd leverage the Machine Learning Toolkit (MLTK). First, I'd identify relevant data sources (e.g., firewall logs, intrusion detection system alerts) and extract features indicative of malicious activity. Then, using MLTK algorithms like clustering (e.g., k-means) or anomaly detection (e.g., Robust Statistical Outlier Detection), I'd establish a baseline of normal behavior. Deviations from this baseline, exceeding a defined threshold, would trigger alerts indicating potential security threats or anomalies.
For predictive analysis, I would use forecasting algorithms (e.g., ARIMA) on time-series data to predict future resource utilization or threat occurrences. I'd then use Splunk's alerting mechanisms to notify security teams of predicted events, enabling proactive threat mitigation. Furthermore, I can use supervised learning algorithms, training them on labeled datasets of past attacks to identify similar threats in real-time. Continuous model retraining using new data ensures the model remains accurate and adapts to evolving attack patterns. Finally, visualize anomalies using Splunk dashboards.
8. What are the best practices for managing Splunk knowledge objects, such as dashboards, reports, and saved searches, in a large organization?
In large organizations, managing Splunk knowledge objects efficiently involves several key practices. Version control using a system like Git is crucial for tracking changes and enabling collaboration on dashboards, reports, and saved searches. Consistent naming conventions are essential for easy identification and searchability. Establish clear ownership for each knowledge object to ensure accountability for maintenance and updates.
Furthermore, implement a well-defined lifecycle management process for knowledge objects, including creation, testing, deployment, and retirement. Utilize Splunk's built-in roles and permissions to control access and prevent unauthorized modifications. Regular reviews of knowledge objects are necessary to identify outdated or redundant content, ensuring the Splunk environment remains streamlined and performant. Consider using Splunk's app packaging for easier deployment and management across multiple Splunk instances.
9. How would you implement a role-based access control (RBAC) model in Splunk to ensure that users only have access to the data they need?
Splunk RBAC can be implemented using roles, users, and capabilities. First, define roles based on job functions, like 'security_analyst' or 'network_engineer'. Each role is assigned specific capabilities that grant permissions, such as read access to certain indexes or the ability to run specific searches. Then, assign users to one or more roles, thereby granting them the combined permissions of those roles.
To restrict access, configure index-based access control by specifying which roles can read or write to specific indexes. For example, give 'security_analyst' read access to the 'security_logs' index while denying access to other indexes like 'financial_data'. You can further restrict access at the search level by using search filters to limit the data users can see, even within an index. For example, a search filter could limit the 'network_engineer' to only see logs related to network devices.
10. Describe your experience with using Splunk's Common Information Model (CIM) to normalize data from different sources.
I've used Splunk's Common Information Model (CIM) extensively to normalize data from diverse sources, such as firewalls, web servers, and operating systems. My experience involves mapping raw data fields to the CIM data models like Authentication, Network Traffic, and Change Analysis. This ensures consistency across different data sources, allowing for effective searching, reporting, and correlation. I've worked with CIM-compliant add-ons and created custom field extractions and lookups to align data with the CIM standard when necessary.
Specifically, I’ve implemented CIM to standardize firewall logs, which originally varied greatly in format. By mapping fields like src_ip, dest_ip, and action to the corresponding CIM fields, I enabled unified searches and dashboards across different firewall vendors. I've also used the CIM to build correlation searches that identify potentially malicious activity by correlating events from multiple data sources like endpoint security and network traffic logs.
11. How would you design a Splunk dashboard to provide real-time insights into the performance of a critical application or system?
To design a Splunk dashboard for real-time insights, I'd focus on key performance indicators (KPIs) and visualization. The dashboard would include panels displaying metrics like response time, error rates, CPU utilization, memory usage, and network latency. These KPIs would be visualized using charts (line, bar, single value) to provide immediate understanding of the application/system health.
Specifically, I'd utilize Splunk queries to extract these metrics from relevant logs and system data. For example, a query for average response time might use transaction command. Real-time updates would be achieved using scheduled searches running frequently (e.g., every 1-5 minutes), feeding data into the dashboard panels. Alerts would be configured to trigger based on predefined thresholds for critical metrics, ensuring proactive identification of potential issues. Consider drill-down capabilities to investigate issues.
12. Explain how you would use Splunk to investigate a security incident, such as a data breach or malware infection.
To investigate a security incident with Splunk, I'd start by defining the scope and timeline. I would then use Splunk's search processing language (SPL) to aggregate relevant logs from various sources like firewalls, servers, and endpoint detection systems, focusing on the identified timeframe. Specifically, I'd look for patterns indicating unusual activity, such as spikes in network traffic, unauthorized access attempts, or the presence of suspicious processes. I would then start to correlate these events. Splunk's dashboards and reporting features could be used to visualize the data and identify trends.
Following the initial investigation, I'd pivot to deeper analysis of specific events. For example, I might examine logs associated with a compromised user account or analyze the behavior of a identified malicious file using Splunk's event drill-down capabilities. I would also leverage Splunk's alerting capabilities to proactively identify similar incidents in the future. Finally, the insights gained from the investigation would be used to refine security policies and controls to prevent future breaches.
13. What are the key considerations when upgrading a Splunk environment to a newer version, and how would you mitigate potential risks?
Key considerations for Splunk upgrades include compatibility checks (apps, add-ons, OS), capacity planning to handle new features and increased data volume, thorough testing in a non-production environment, and a well-defined rollback plan. It's crucial to review the Splunk release notes for deprecated features and any required configuration changes.
Mitigating risks involves creating a detailed upgrade plan with specific timelines and responsibilities, performing a phased rollout starting with a small subset of the environment, closely monitoring system performance and logs during and after the upgrade, and having a readily available backup of the pre-upgrade environment for quick restoration if needed. Also, ensure the Splunk license is valid for the new version.
14. How would you use Splunk to monitor the health and performance of your own Splunk infrastructure?
I would use Splunk's monitoring console and pre-built dashboards to gain immediate insights into the health of my Splunk deployment. This includes monitoring key metrics like indexing latency, search performance, resource utilization (CPU, memory, disk I/O), and license usage. I would also set up alerts based on thresholds for these metrics to proactively identify and address potential issues before they impact users. For example, I'd create alerts for high CPU usage on indexers or exceeding license limits.
Furthermore, I would configure Splunk to monitor its own logs, including splunkd.log, to identify errors, warnings, and performance bottlenecks. I'd use Splunk's search processing language (SPL) to analyze these logs and create custom dashboards that provide a more granular view of Splunk's internal operations. Examples are Splunk's internal indexes (_internal, _audit, _introspection), performance reports and health check dashboards, which are essential for maintaining a stable and efficient Splunk environment.
15. Describe your experience with using Splunk's SDKs to develop custom applications or integrations.
I have used Splunk's Python SDK to automate tasks such as data ingestion, search scheduling, and report generation. For example, I built a script that dynamically creates Splunk saved searches based on user input, allowing non-technical users to define and schedule complex searches without needing to directly interact with Splunk's configuration files. This involved using the SDK to authenticate with Splunk, create and modify search objects, and schedule those searches to run at specific intervals.
While my experience is primarily with the Python SDK, I'm familiar with the general concepts of Splunk SDKs and how they abstract the Splunk REST API. I understand how to use them to programmatically interact with Splunk instances for various operational and data management purposes. I'm also comfortable learning new SDKs as needed based on project requirements. My exposure has been to automate and streamline the Splunk search, report and data ingestion process.
16. Explain how you would use Splunk to comply with regulatory requirements, such as PCI DSS or HIPAA.
To comply with regulatory requirements like PCI DSS or HIPAA, Splunk can be used for several key functions. First, Splunk's data ingestion capabilities allow for the centralized collection and indexing of all relevant security logs, access logs, and system events from across the environment. This comprehensive data repository is critical for auditability.
Second, Splunk's search and reporting capabilities facilitate the creation of custom alerts and dashboards that monitor for specific compliance-related events, such as unauthorized access attempts, data breaches, or policy violations. For example, for PCI DSS, Splunk can monitor file integrity, track user access to cardholder data, and detect suspicious network activity. For HIPAA, it can monitor access to ePHI, detect anomalies in patient data access patterns, and track changes to security configurations. Splunk's alerting mechanism enables proactive responses to potential compliance breaches. Splunk also maintains an audit trail of who accessed the system and what actions they performed within Splunk itself, further aiding in compliance efforts.
17. What are the best practices for writing efficient and effective Splunk search queries?
To write efficient and effective Splunk search queries, start by filtering as early as possible using indexes and time ranges. This minimizes the amount of data Splunk has to process. Use specific field names and wildcards wisely; avoid broad wildcards that can slow down the search. Leverage commands like index=, source=, and host= in the initial part of your search.
Also, use transforming commands like stats, chart, and timechart to aggregate data after filtering, not before. Optimize subsearches by ensuring they return only the necessary fields. Be mindful of expensive commands like regex and eval; when possible, use alternatives like cidrmatch or case to improve performance. Remember to test and profile your searches to identify bottlenecks and refine them accordingly.
18. How would you design a Splunk solution to address a specific business problem or use case?
To design a Splunk solution, I'd first clearly define the business problem and expected outcomes. Then, I'd identify the relevant data sources containing information related to the problem (e.g., server logs, application logs, network traffic). Next step is data ingestion, focusing on proper parsing and field extraction during data onboarding, followed by creation of knowledge objects such as lookups, tags, and event types to normalize and enrich the data. I would then develop dashboards and reports to visualize key metrics and insights related to the business problem. Finally, I would create alerts that trigger when specific thresholds are breached, enabling proactive responses. The dashboards and alerts should be iteratively refined based on user feedback and the evolving business needs.
For example, if the problem is identifying fraudulent transactions, I'd ingest transaction logs, user activity logs, and potentially threat intelligence feeds. Splunk would then be used to correlate this data, identify unusual patterns (like multiple transactions from the same IP address in a short period), and trigger alerts to security teams to investigate. Dashboards would display key metrics like number of flagged transactions, associated user accounts, and potential financial impact.
19. Describe your experience with using Splunk's data enrichment capabilities to add context to your data.
I've used Splunk's data enrichment capabilities extensively to enhance the value of my data. A common approach involves using lookups (CSV and KV Store) to add contextual information like user roles, geographic locations based on IP addresses, or asset details based on hostnames. For example, I might use a CSV lookup to map user IDs from event logs to their corresponding department and manager, providing a more complete picture of user activity. I've also leveraged Splunk's lookup command in search queries and within dashboards to dynamically enrich events as they are being analyzed.
Another enrichment method I've used is with calculated fields and eventtypes. I might create calculated fields to extract specific information from events, or I could create eventtypes that adds tags, allowing quick classifications of events which is useful for creating summary dashboards. Enriching data makes it easier to correlate events, identify trends, and gain actionable insights, leading to more effective security monitoring and operational analysis. I've also used external APIs to pull in reputation data based on IP addresses or URLs which provides even more context when investigating security incidents.
20. Explain how you would use Splunk to monitor and analyze network traffic data.
To monitor and analyze network traffic data using Splunk, I would first configure Splunk to ingest network traffic data from various sources like network devices (routers, switches, firewalls) or packet capture tools (e.g., Wireshark, tcpdump) by installing relevant technology add-ons (TAs). The TAs help Splunk understand and parse the data. Then, I would create dashboards and alerts based on specific network metrics and events. For example, I could track bandwidth usage, identify unusual traffic patterns indicating potential security threats (like port scanning or DDoS attacks), and monitor network latency. I would use Splunk's search processing language (SPL) to query and transform the data to extract meaningful insights.
Specifically, example SPL commands I would use are stats to calculate aggregated metrics (like average bandwidth per host), top to identify top talkers, rare to find infrequent events, and transaction to correlate events into meaningful sessions. The use of correlation searches will allow me to identify potential security breaches. For example, if there are failed login attempts from multiple ip addresses followed by a successful login, that might be an indication of brute-force attack. The alerts could trigger emails, scripts, or integrations with other security tools to respond to these events in real-time.
21. What are the different types of Splunk licenses, and how do they impact your deployment?
Splunk offers several license types that significantly impact deployment capabilities. Common types include:
- Enterprise License: This is the standard paid license for most organizations. It offers the full range of Splunk features and capabilities, subject to a data ingestion limit (usually GB per day). Exceeding the limit can trigger warnings or license violations, potentially impacting search functionality. Splunk Cloud licenses are very similar to enterprise licenses.
- Free License: This license provides basic search and indexing functionality but is limited to a low daily data ingestion volume (e.g., 500MB). It lacks features like user authentication, alerting, and distributed search. It's suitable for small deployments or personal use.
- Forwarder License: This is a free license applied to forwarders. It does not have any data limits. It only allows the indexers to which the forwarders send data to be licensed.
- Developer License: Typically used in non-production environments, allowing exploration and testing of Splunk features without data limits.
- Other specialized licenses: Such as those for specific Splunk apps or solutions, are available that may impact deployment in that they unlock particular feature sets.
Choosing the right license is crucial. The type and volume of data ingested determine the license required. License violations can degrade performance and compliance.
22. How would you troubleshoot a Splunk search that is returning incorrect or incomplete results?
Troubleshooting incorrect or incomplete Splunk search results involves several steps. First, verify the search query's syntax and logic. Ensure the correct index is being searched and the timeframe is appropriate. Check for typos or errors in field names or keywords. Use the search inspector to examine the search's job properties, including the number of events scanned and returned, as well as any warnings or errors. Also, confirm that the data is being ingested into Splunk correctly and that there are no data gaps or parsing issues impacting the search results.
Next, consider limitations such as the search time range, summary indexing, or data retention policies. Make sure the user has sufficient permissions to access the necessary indexes. You can use the | dbinspect command to check the status of indexes and data. Finally, break down the search into smaller parts to isolate the source of the issue and compare the results of the reduced search with what is expected.
23. Describe your experience with using Splunk's modular inputs to collect data from custom sources.
I have experience developing and using Splunk modular inputs to collect data from various custom sources. I've primarily used Python to create these inputs, leveraging the Splunk SDK for Python to handle tasks such as input validation, configuration, and data submission. For example, I created a modular input to monitor a custom application's log files that were not in a standard format. This involved defining the input's schema in inputs.conf.spec, parsing the custom log format, and then structuring the data into Splunk events. Another use case was to pull data from a REST API that required authentication; the modular input handled the authentication process, fetched the data, and indexed it into Splunk.
My approach typically involves thoroughly testing the modular input locally before deploying it to a Splunk environment. I pay close attention to error handling, logging, and performance optimization to ensure the input is robust and efficient. I also ensure the input adheres to Splunk best practices, such as using checkpoints to avoid data duplication and providing clear documentation for users.
24. Explain how you would use Splunk to monitor and analyze cloud-based infrastructure and services.
To monitor and analyze cloud-based infrastructure and services with Splunk, I would first install Splunk forwarders on cloud instances (EC2, VMs, etc.) to collect logs, metrics, and other relevant data. These forwarders would then send data to a central Splunk instance or Splunk Cloud. I'd configure Splunk to ingest and parse data from various cloud services such as AWS CloudWatch, Azure Monitor, and Google Cloud Logging using Splunk add-ons or the HTTP Event Collector.
I would then create dashboards and alerts to monitor key performance indicators (KPIs) such as CPU utilization, memory usage, network traffic, application response times, and error rates. I'd use Splunk's search processing language (SPL) to correlate data from different sources, identify anomalies, and troubleshoot issues. Examples of alerts would be triggered by excessive error logs, unusual network activity, or threshold breaches on resource utilization. For example a query would be index=cloud_logs sourcetype=aws:cloudwatch error | stats count by region. The goal is to have proactive insights into the health, performance, and security of the cloud environment.
25. What are the key considerations when choosing between different Splunk deployment options, such as on-premises, cloud, or hybrid?
When choosing between Splunk deployment options (on-premises, cloud, or hybrid), several key considerations come into play. Cost is a major factor, encompassing infrastructure, maintenance, and personnel. Cloud deployments often have lower upfront costs but can become expensive long-term, while on-premises require significant initial investment but offer more predictable costs. Another crucial element is scalability and flexibility. Cloud solutions readily scale up or down, while on-premises require manual adjustments and hardware procurement. Hybrid setups offer a balance, but complexity increases.
Other factors include security and compliance, where organizations must evaluate their ability to meet requirements in each environment. On-premises offers greater control, but cloud providers often have robust security certifications. Data residency requirements may also dictate the deployment model. Finally, existing infrastructure and expertise should influence the decision. Leveraging existing on-premises infrastructure can be cost-effective initially, while lack of internal Splunk expertise might make a cloud deployment more appealing. A hybrid approach is often chosen to ease transition into the cloud.
26. How would you use Splunk to predict future trends or events based on historical data?
To predict future trends using Splunk, I would leverage its machine learning capabilities and time series analysis features. First, I'd ingest relevant historical data into Splunk. Then, I'd use the predict command, along with appropriate algorithms like ARIMA or linear regression, to forecast future values based on the historical patterns. The accuracy of the predictions could be improved by incorporating external factors as additional fields, assuming those factors correlate with the event I am trying to predict. I would continuously evaluate the models, retrain, and refine them as new data becomes available to improve prediction accuracy.
27. Describe your experience with using Splunk's advanced search commands and functions.
I have experience using Splunk's advanced search commands and functions to analyze and extract valuable insights from large datasets. I've utilized commands like transaction to group related events, stats for aggregations (such as calculating averages, sums, and counts), and lookup to enrich event data with external sources. I'm also familiar with advanced functions like strftime for time formatting, eval for creating calculated fields, and regular expressions within rex for complex field extractions. For example, I used the following SPL to identify users with multiple failed login attempts:
index=auth sourcetype=security failed_login
| stats count by user
| where count > 3
Furthermore, I've applied knowledge of subsearches and advanced filtering techniques to refine search results and improve performance. I understand how to optimize queries for efficiency when dealing with large volumes of data and use techniques such as field extractions at index time.
28. Explain how you would use Splunk to automate incident response workflows.
I would use Splunk to automate incident response workflows by leveraging its alerting and orchestration capabilities. First, I'd configure Splunk to monitor for specific events or patterns that indicate a potential incident. When an alert is triggered, Splunk can automatically initiate a predefined workflow. This workflow can involve actions such as:
- Sending notifications: Email, Slack, PagerDuty
- Enriching data: Looking up asset information, threat intelligence feeds.
- Executing remediation steps: Isolating compromised systems, blocking malicious IP addresses. This could involve using Splunk's integration with various security tools and APIs to automatically execute scripts or commands on affected systems.
- Creating Tickets: Automatically create tickets to relevant teams for investigation.
Splunk's adaptive response framework enables the creation of flexible and customized incident response plans, reducing manual effort and improving response times.
29. What are the best practices for securing a Splunk environment against unauthorized access and data breaches?
Securing a Splunk environment involves several best practices. Firstly, implement strong authentication and authorization mechanisms. This includes using multi-factor authentication (MFA), role-based access control (RBAC) to limit user privileges, and regularly reviewing user accounts and permissions. Secondly, encrypt data both in transit and at rest using TLS for communication and disk encryption for storage. Keep Splunk software and its dependencies updated with the latest security patches to address known vulnerabilities. Finally, monitor Splunk's internal logs for suspicious activity, configure alerts for potential security incidents, and implement a robust incident response plan.
Additionally, restrict network access to Splunk components by using firewalls and access control lists (ACLs). Regularly audit Splunk configurations and access patterns to identify and address any security weaknesses. Consider using Splunk's Enterprise Security app or other security information and event management (SIEM) solutions to enhance threat detection and response capabilities. Disable or remove any unused apps or configurations to minimize the attack surface.
30. How would you use Splunk to measure and improve the performance of your organization's IT operations?
Splunk can be used to measure and improve IT operations performance by first collecting and indexing all relevant machine data, including logs from servers, applications, network devices, and security systems. This centralized data allows for real-time monitoring of key performance indicators (KPIs) such as server response times, application availability, network latency, and error rates. Dashboards and alerts can then be configured to visualize these KPIs and notify IT staff of any performance degradation or anomalies.
To improve performance, Splunk can be used to identify root causes of issues through its search and analysis capabilities. By correlating events across different systems, IT teams can quickly pinpoint bottlenecks and resolve problems. For example, we can set up searches for specific error codes, correlate them to specific servers, and timeframes to quickly pinpoint the root cause. Over time, trends in the KPIs can be analyzed to identify areas for optimization and proactive improvement efforts, such as capacity planning or infrastructure upgrades. Here's an example search:
index=main sourcetype=syslog "error" | stats count by host, _time
Splunk MCQ
Question 1.
In a Splunk indexer cluster with search affinity enabled, which of the following BEST describes how searches are directed to indexers?
Options:
Question 2.
You are managing a large Splunk deployment and need to update the configuration of hundreds of forwarders. What is the MOST efficient way to accomplish this task?
options:
Options:
Question 3.
In a Splunk Search Head Cluster (SHC), what is the primary role of the Deployer?
Options:
Question 4.
Which of the following methods is MOST efficient for extracting fields from event data during the search process in Splunk, especially when dealing with complex patterns or unstructured data?
Options:
Question 5.
Which configuration file is used on the License Master to define license pools?
Options:
Question 6.
When Splunk processes configuration files, which location has the highest precedence, overriding settings in other locations?
Options:
Question 7.
When multiple stanzas in props.conf match an event, which stanza takes precedence?
Options:
Question 8.
Which configuration file on the Splunk Deployment Server is used to define target forwarder groups and their corresponding app deployments?
Options:
Question 9.
When should you choose to deploy a Heavy Forwarder instead of a Universal Forwarder?
options:
Options:
Question 10.
In Splunk's Search Processing Language (SPL), which of the following statements best differentiates transforming commands from reporting commands?
Options:
Question 11.
Which of the following methods is MOST appropriate for collecting data from a remote system when the data source does NOT support native forwarding and requires minimal resource utilization on the remote system?
Options:
Question 12.
Which of the following methods is NOT a supported built-in option for user authentication in Splunk?
Options:
Question 13.
When configuring a server class in Splunk Deployment Server, which of the following methods is the MOST effective for ensuring that configurations are applied correctly and consistently across all deployment clients within that server class?
options:
Options:
Question 14.
What is the key difference between the transaction and stats commands in Splunk?
Options:
Question 15.
In a Splunk indexer cluster environment, what is the relationship between the replication factor and the search factor in the context of data availability and search integrity?
Options:
Question 16.
Which of the following statements best describes the primary purpose of the lookup command in Splunk?
Options:
Question 17.
Which of the following statements BEST describes the primary benefit of using data model acceleration in Splunk?
Options:
Question 18.
Which statement accurately describes the behavior of the collect command in Splunk?
Options:
Question 19.
In a Splunk indexer cluster, which method is primarily used to synchronize configurations across all peer nodes?
Options:
Question 20.
Which of the following statements best describes the primary function of the tstats command in Splunk?
Options:
Question 21.
Which of the following statements best describes the primary purpose of a subsearch in Splunk?
Options:
Question 22.
What is the key difference between the join and append commands in Splunk SPL?
Options:
Question 23.
In what order does Splunk process events as they are ingested, considering configurations defined in props.conf and transforms.conf? Select the correct sequence.
Options:
Question 24.
Which of the following statements best describes the purpose of the fieldformat command in Splunk?
Options:
Question 25.
Which of the following best describes the function of the mvzip command in Splunk?
Options:
Which Splunk skills should you evaluate during the interview phase?
While a single interview can't reveal everything, focusing on core Splunk skills is key. These skills will help you gauge a candidate's ability to effectively use Splunk for data analysis and problem-solving. Evaluating these skills ensures you hire someone who can contribute meaningfully to your team's success with Splunk.
SPL (Search Processing Language)
Gauge a candidate's SPL proficiency quickly with a skill assessment. Our Splunk online test includes relevant MCQs to filter candidates effectively.
Let’s see how well they know SPL. Here’s a sample interview question to evaluate SPL skills:
Write an SPL query to find the top 5 most frequent error messages in the last 24 hours.
Look for the candidate to use commands like search, stats, top, and timechart. They should demonstrate an understanding of how to filter events, aggregate data, and order results.
Data Ingestion & Indexing
A well-designed test can help you quickly assess data ingestion and indexing knowledge. Look for tests that cover event parsing, source types, and index configuration.
Here is an interview question to see if the candidate knows how to ingest data in Splunk:
Describe the steps you would take to ingest data from a new, custom application log file into Splunk.
The candidate should mention steps like configuring inputs, defining source types, and creating indexes. Also check if they talk about parsing the data fields correctly so it gets indexed correctly.
Alerting and Reporting
You can quickly filter out candidates lacking expertise in setting up alerts and reports using relevant assessment tests. Make sure the test evaluates knowledge of alert conditions, trigger actions, and report scheduling.
Here is an interview question to assess alerting and reporting:
How would you configure an alert in Splunk to notify you when the CPU usage on a server exceeds 90% for 5 minutes?
The candidate should mention using the Alert Manager, setting up a threshold condition, and configuring email notifications. They should also discuss the importance of setting an appropriate timeframe and frequency for the alert.
Hire Splunk Experts with Targeted Skills Assessments
When hiring for Splunk roles, accurately evaluating a candidate's Splunk skills is key. You need to ensure they possess the knowledge and abilities required to effectively manage and analyze data within your Splunk environment.
The most effective way to gauge these skills is through a dedicated skills test. Adaface offers a specialized Splunk Online Test to help you assess candidates' expertise.
Once you've used the skills test to identify top performers, you can confidently shortlist the best applicants for interviews. This targeted approach ensures you focus your interview efforts on the most promising candidates.
Ready to find your next Splunk expert? Head over to Adaface's online assessment platform to get started and streamline your hiring process.
Splunk Test
30 mins | 15 MCQs
The Splunk Test evaluates a candidate's knowledge and skills in using Splunk for data analysis, monitoring, and security purposes. This test assesses the understanding of Splunk basics, search techniques, data indexing, architecture and data visualization.
Try Splunk Test
Download Splunk interview questions template in multiple formats
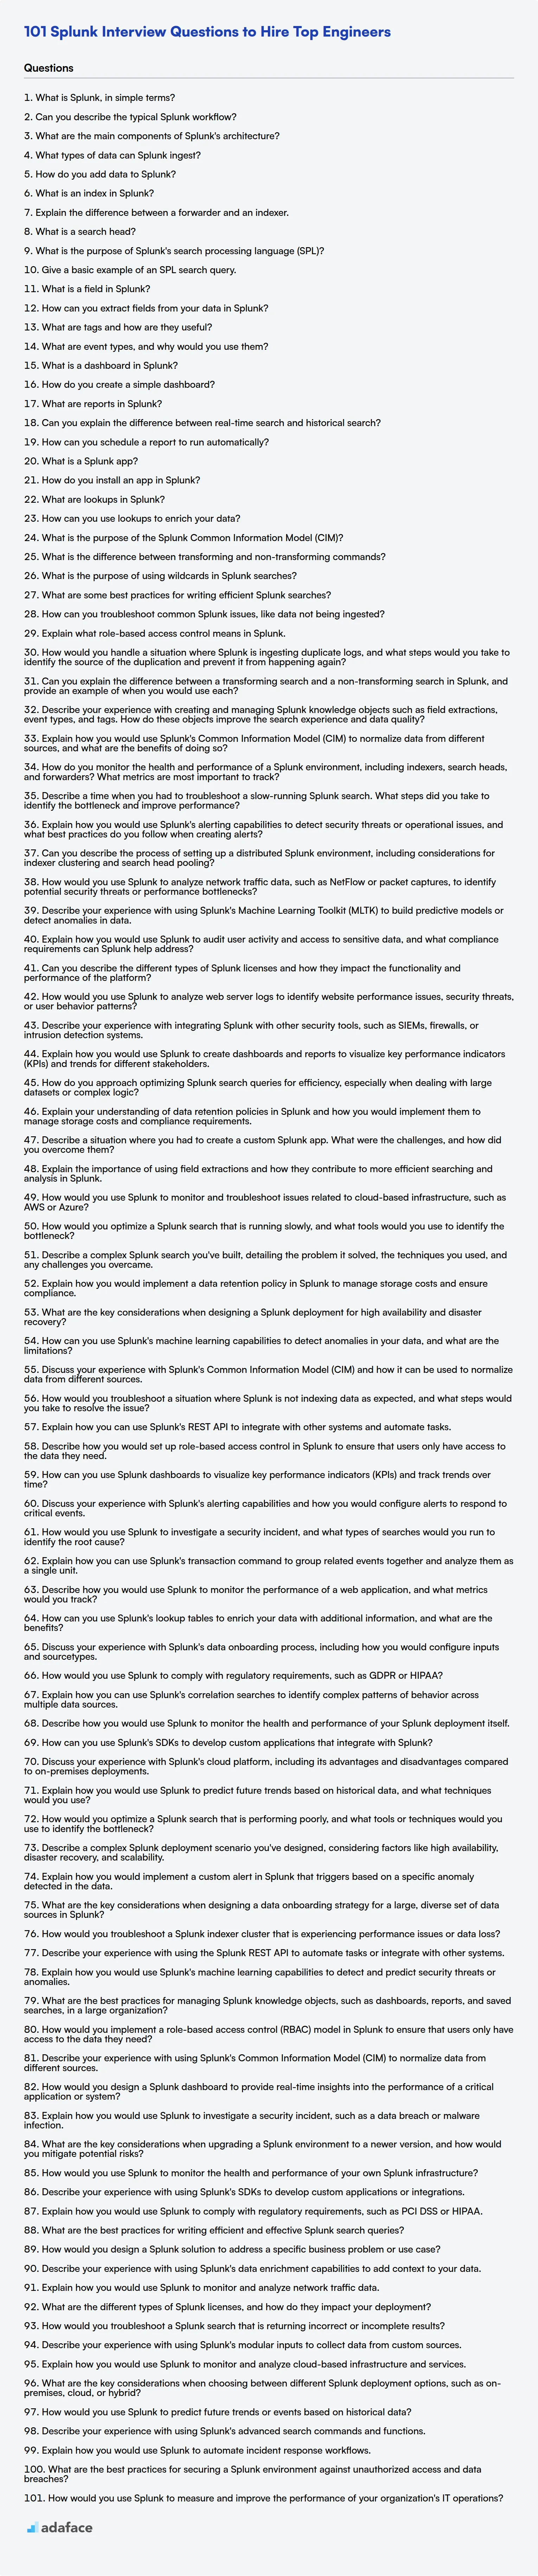
Splunk Interview Questions FAQs
What are some basic Splunk interview questions?
Basic Splunk interview questions cover topics like Splunk's architecture, data ingestion, and basic search commands.
What are some intermediate Splunk interview questions?
Intermediate questions test knowledge of topics like data models, advanced search commands, and Splunk's role-based access control.
What are some advanced Splunk interview questions?
Advanced questions cover complex configurations, troubleshooting, and developing custom apps and dashboards within the Splunk environment.
What are some expert Splunk interview questions?
Expert-level questions assess the candidate's ability to design, implement, and manage large-scale Splunk deployments, optimize performance, and integrate Splunk with other enterprise systems.
Why is it important to assess Splunk skills?
Assessing Splunk skills helps in hiring qualified professionals who can effectively manage, analyze, and derive insights from machine data, leading to better decision-making and improved security posture.
40 min skill tests.
No trick questions.
Accurate shortlisting.
We make it easy for you to find the best candidates in your pipeline with a 40 min skills test.
Try for freeRelated posts
Free resources

Join 1200+ companies in 80+ countries.
Try the most candidate friendly skills assessment tool today.

40 min tests.
No trick questions.
Accurate shortlisting.
No trick questions.
Accurate shortlisting.