
Qlik Sense interview questions for freshers
1. What is Qlik Sense and what is it used for? Explain it like you are explaining to a five-year-old.
2. Can you describe the difference between Qlik Sense and other data visualization tools you might have heard of?
3. What are the basic components of Qlik Sense, such as apps, sheets, and stories?
4. Have you ever connected Qlik Sense to a data source? If so, what kind of data source was it?
5. What is a Qlik Sense Hub, and how do you use it?
6. Can you explain what a dimension and a measure are in Qlik Sense?
7. What are filters in Qlik Sense, and how can you use them to analyze data?
8. Have you ever created a simple chart in Qlik Sense? If so, what type of chart was it?
9. What is the purpose of using bookmarks in Qlik Sense?
10. Can you explain what a Key Performance Indicator (KPI) is and how it's used in Qlik Sense?
11. What is the data load editor in Qlik Sense, and what is it used for?
12. Have you heard about Qlik Sense Cloud? What do you know about it?
13. What is a story in Qlik Sense, and how is it useful?
14. Can you describe a scenario where you would use a bar chart versus a pie chart?
15. What does 'drag and drop' mean in the context of Qlik Sense, and how does it help?
16. What is a 'field' in Qlik Sense, and how does it relate to your data?
17. How can you share a Qlik Sense app with someone else?
18. What is the difference between a selection and a filter in Qlik Sense?
19. What are the benefits of using Qlik Sense over just looking at raw data in a spreadsheet?
20. Explain what a calculated field is in Qlik Sense. Why would you create one?
21. What kind of training resources (online courses, tutorials, etc.) have you used to learn about Qlik Sense?
22. Imagine you have a table with sales data. How would you show the total sales for each region using Qlik Sense?
23. What does the term 'associative model' mean in the context of Qlik Sense?
24. What is the purpose of using 'set analysis' in Qlik Sense? Can you give a simple example?
25. How would you handle missing or incomplete data when loading it into Qlik Sense?
26. If you have a large dataset, what are some strategies you could use to optimize the performance of your Qlik Sense app?
Qlik Sense interview questions for juniors
1. What is Qlik Sense, in your own words?
2. Can you describe a time you used data to make a decision?
3. What are some different types of charts you know?
4. What is data visualization?
5. Have you ever used drag and drop functionality? How would you use it in Qlik Sense?
6. What is a filter in Qlik Sense?
7. Explain what you know about data models.
8. What does it mean to load data into Qlik Sense?
9. What are dimensions and measures in Qlik Sense?
10. Can you describe a simple project where you could use Qlik Sense?
11. What is the purpose of using color in a chart?
12. What is a dashboard?
13. How can you connect to different data sources?
14. What is the Qlik Sense Hub?
15. What is a story in Qlik Sense?
16. What is a calculated field?
17. Why is data quality important?
18. What is the difference between a bar chart and a pie chart, and when would you use each?
19. How can you share a Qlik Sense app with someone else?
20. What is the use of bookmarks in Qlik Sense?
21. What is an extension in Qlik Sense?
22. Can you explain how data is associated in Qlik Sense?
23. What does it mean to 'clean' data?
24. What's the difference between a master item and a regular object?
25. Explain what a KPI is and why is it important to monitor?
26. What are the different types of selections in Qlik Sense?
27. What is Qlik Sense Cloud?
28. What are the advantages of using Qlik Sense over Excel?
29. If you were given a messy spreadsheet, how would you start exploring the data in Qlik Sense?
Qlik Sense intermediate interview questions
1. How do you optimize Qlik Sense dashboards for mobile devices?
2. Explain the difference between a 'Let' statement and a 'Set' statement in Qlik Sense scripting.
3. Can you describe a scenario where you would use a Cyclic Group in Qlik Sense?
4. How would you implement row-level security in a Qlik Sense application?
5. What are the key considerations when designing a Qlik Sense data model for performance?
6. Explain the purpose and benefits of using incremental load in Qlik Sense.
7. How can you handle slowly changing dimensions in Qlik Sense?
8. Describe a situation where you would use the 'ApplyMap' function and explain how it works.
9. What are the different types of Qlik Sense licenses available, and how do they impact functionality?
10. How do you troubleshoot performance issues in a Qlik Sense application?
11. Explain the concept of 'Data Lineage' in Qlik Sense and how you would implement it.
12. How can you embed a Qlik Sense object into a web page or another application?
13. Describe the process of setting up and configuring Qlik Sense Enterprise on Kubernetes.
14. How do you manage and monitor Qlik Sense apps using the Qlik Management Console (QMC)?
15. Explain how you would use variables to control the behavior of a Qlik Sense application.
16. What is the purpose of the 'Where' clause in a Qlik Sense script, and how does it differ from 'If'?
17. How do you create and use custom themes in Qlik Sense?
18. Explain the benefits and drawbacks of using Direct Discovery in Qlik Sense.
19. How would you handle missing or incomplete data in a Qlik Sense application?
20. Describe a scenario where you would use a 'Join' operation in Qlik Sense and explain the different types of joins available.
21. What are the different types of charts available in Qlik Sense, and when would you use each type?
22. How do you create and use bookmarks in Qlik Sense?
23. Explain how you would implement version control for Qlik Sense applications.
24. Describe how you can use Qlik Sense to perform sentiment analysis on text data.
25. What security best practices should be followed while developing Qlik Sense applications?
26. Explain the difference between calculated dimensions and calculated measures.
27. How do you integrate Qlik Sense with other data sources, such as APIs or cloud services?
28. Explain how you would go about optimizing the performance of a Qlik Sense app that is slow to load or respond.
Qlik Sense interview questions for experienced
1. Describe a complex Qlik Sense application you developed, highlighting the challenges you faced and how you overcame them.
2. How have you utilized Set Analysis to solve a specific business problem, and what were the key benefits?
3. Explain your experience with Qlik Sense extensions and provide an example of when you would choose to use one.
4. Discuss your approach to optimizing Qlik Sense performance, including techniques for data modeling and expression design.
5. How do you ensure data quality and accuracy within Qlik Sense applications you develop?
6. Describe your experience with Qlik Sense's security features and how you have implemented them to protect sensitive data.
7. How have you integrated Qlik Sense with other business intelligence or data warehousing tools?
8. Explain your experience with advanced Qlik Sense scripting techniques, such as incremental load or binary load.
9. Describe a situation where you had to troubleshoot a complex Qlik Sense issue, and how you approached the problem.
10. How familiar are you with Qlik Sense's APIs and how have you used them in your projects?
11. Discuss your experience with collaborative development in Qlik Sense, including version control and code management.
12. Explain your understanding of Qlik Sense's data governance capabilities and how you have implemented them.
13. How have you used Qlik Sense to create data-driven stories and presentations for executive audiences?
14. Describe your experience with different Qlik Sense deployment options (e.g., on-premise, cloud) and their considerations.
15. How do you stay up-to-date with the latest Qlik Sense features and best practices?
16. Explain how you handle very large datasets within Qlik Sense, including strategies for efficient data loading and processing.
17. Describe a time when you had to redesign a Qlik Sense application to improve its usability or performance.
18. How do you approach user training and documentation for Qlik Sense applications you develop?
19. Explain your experience with Qlik Sense's mobile capabilities and how you optimize applications for mobile devices.
20. Describe a situation where you had to work with a complex data model in Qlik Sense, and how you simplified it for end-users.
21. How have you leveraged Qlik Sense's advanced analytics features, such as clustering or forecasting, in your projects?
22. Explain your understanding of Qlik Sense's associative engine and how it impacts data discovery and analysis.
23. Describe your experience with Qlik Sense Mashups and when you would choose to implement one.
24. How do you ensure accessibility compliance in Qlik Sense applications, making them usable for people with disabilities?

Recruiting for Qlik Sense roles requires a keen eye for talent capable of transforming raw data into actionable insights. You need candidates who not only understand the tool but can also leverage it to drive business decisions, similar to the skills needed for a business intelligence analyst. This curated list of interview questions will help you identify the best Qlik Sense professionals for your team.
This blog post provides a comprehensive collection of Qlik Sense interview questions, categorized by experience level from freshers to experienced professionals, and also includes MCQs. You'll find questions designed to assess candidates' knowledge and hands-on skills.
By using these questions, you'll be able to confidently evaluate a candidate's expertise and fit for your organization. To streamline your screening process even further, consider using Adaface's Qlik Sense assessment test to objectively measure their skills before the interview.
Table of contents
Qlik Sense interview questions for freshers
Qlik Sense interview questions for juniors
Qlik Sense intermediate interview questions
Qlik Sense interview questions for experienced
Qlik Sense MCQ
Which Qlik Sense skills should you evaluate during the interview phase?
3 Tips for Using Qlik Sense Interview Questions
Evaluate Qlik Sense Skills Accurately and Hire Top Talent
Download Qlik Sense interview questions template in multiple formats
Qlik Sense interview questions for freshers
1. What is Qlik Sense and what is it used for? Explain it like you are explaining to a five-year-old.
Imagine you have a big box of toys, but they are all mixed up! Qlik Sense is like a super-smart helper that can sort your toys and show you fun things about them. It helps grown-ups look at big piles of information, like how many cookies they sold or which toys are the most popular.
It lets them see the information in a colorful and easy way, like showing a picture of all the red cars together or making a chart to show how many dolls each kid has. This helps them understand the information better and make good choices, like ordering more of the favorite toys!
2. Can you describe the difference between Qlik Sense and other data visualization tools you might have heard of?
Qlik Sense differentiates itself through its associative engine, allowing users to explore data freely without pre-defined queries. Unlike many traditional BI tools that rely on query-based exploration, Qlik Sense's associative model highlights relationships between all data points, revealing hidden insights. This encourages a more exploratory and discovery-driven approach to data analysis.
Other tools, while strong in visualization and reporting, often lack this associative capability. For example, tools like Tableau emphasize drag-and-drop interfaces and static dashboards, while Qlik Sense dynamically links data, offering greater flexibility and a wider breadth of analysis. Qlik also has a fully cloud native version which enables easier deployment and scaling in comparison to others.
3. What are the basic components of Qlik Sense, such as apps, sheets, and stories?
Qlik Sense apps are self-contained analytical environments, serving as the primary container for data and visualizations. They comprise multiple sheets, which are individual pages or dashboards within the app, containing charts, tables, and other visualizations.
Stories are guided presentations built from snapshots of sheets and other data, allowing users to create compelling narratives and communicate insights effectively. They are essentially a presentation layer built on top of the data and visualizations found within the app and its sheets.
4. Have you ever connected Qlik Sense to a data source? If so, what kind of data source was it?
Yes, I have connected Qlik Sense to various data sources. These include:
- Databases: MySQL, PostgreSQL, Microsoft SQL Server, and Oracle via their respective connectors.
- Cloud Storage: Amazon S3 and Azure Blob Storage using Qlik's built-in connectors and REST APIs.
- Files: CSV, Excel, and QVD/QVX files loaded directly into Qlik Sense.
- Web APIs: REST APIs to pull data from services like Google Analytics and Salesforce (using the REST connector).
5. What is a Qlik Sense Hub, and how do you use it?
The Qlik Sense Hub is the central web-based interface for accessing and managing Qlik Sense apps. It serves as a launchpad for users to discover, open, and interact with visualizations, dashboards, and stories created within the Qlik Sense environment. It's where users can consume the data and insights that Qlik Sense offers.
To use the Qlik Sense Hub, a user typically logs in with their credentials. Once logged in, they can browse available apps, search for specific content, and organize apps into collections for easier access. Clicking on an app opens it, allowing the user to explore the data through interactive visualizations and analyses. Users with appropriate permissions can also create new apps, edit existing ones, or publish them to the Hub for other users to access.
6. Can you explain what a dimension and a measure are in Qlik Sense?
In Qlik Sense, dimensions and measures are fundamental components used in data visualization and analysis. A dimension is a categorical field that groups data. Think of it as a way to slice and dice your data. Examples include product category, region, or date. Dimensions are typically used to create groups or categories in charts and tables.
A measure, on the other hand, is a numerical field that can be aggregated. It represents a quantitative value that you want to analyze. Examples include sales, profit, or quantity. Measures are used to perform calculations like sum, average, min, or max, and are often displayed as values on charts based on dimension selections. Essentially, dimensions determine what you are analyzing, and measures determine how much or how many.
7. What are filters in Qlik Sense, and how can you use them to analyze data?
Filters in Qlik Sense are selection tools that narrow down the data displayed in your visualizations. They allow you to focus on specific subsets of your data to gain deeper insights. By selecting values in a filter, you exclude all other values from the current selection, updating charts and tables to reflect only the chosen data.
Filters can be applied in a variety of ways. You can use field selections, where you choose specific values from a field to include. You can also use search to find and select values that match a particular pattern. Alternatively, you could create bookmark to save a specific set of filter selections, so you can easily return to it later. The power of filters lies in their ability to interactively refine your analysis and discover trends or anomalies within specific segments of your data.
8. Have you ever created a simple chart in Qlik Sense? If so, what type of chart was it?
Yes, I have created simple charts in Qlik Sense. I've primarily worked with bar charts and pie charts.
Specifically, I created a bar chart to visualize sales performance across different regions, comparing revenue generated by each region. I've also created a pie chart to show the market share of different product categories.
9. What is the purpose of using bookmarks in Qlik Sense?
Bookmarks in Qlik Sense are used to capture and save a specific state of your application. This includes selections, filter settings, object sizes and positions, and any other customizations you've made.
The primary purpose is to allow users to quickly return to a previously defined view of the data without having to manually reapply all the selections and settings. This promotes efficient data exploration and consistent analysis, particularly when collaborating with others who need to see the same data view. Bookmarks are essential for storytelling and presenting focused data insights.
10. Can you explain what a Key Performance Indicator (KPI) is and how it's used in Qlik Sense?
A Key Performance Indicator (KPI) is a measurable value that demonstrates how effectively a company is achieving key business objectives. KPIs are used to evaluate success at reaching targets.
In Qlik Sense, KPIs are used to visualize and track progress toward goals. You can create KPI objects that display single values, comparison indicators (showing how the current value compares to a target or previous period), and trend indicators. Qlik Sense allows you to calculate KPIs using expressions and display them in a visually compelling way, enabling users to quickly understand performance against defined objectives.
11. What is the data load editor in Qlik Sense, and what is it used for?
The Data Load Editor in Qlik Sense is a scripting environment used to connect to data sources, transform data, and load it into the Qlik Sense in-memory associative engine. It's essentially a code editor specifically designed for data extraction, transformation, and loading (ETL) within the Qlik Sense environment.
The Data Load Editor uses Qlik Sense's scripting language, which allows you to define connections to databases, files, and other data sources. It provides functions to clean, transform, and reshape the data before loading it into Qlik Sense for analysis and visualization. You can perform tasks like filtering rows, renaming fields, creating calculated fields, and joining data from multiple sources all within the script.
12. Have you heard about Qlik Sense Cloud? What do you know about it?
Yes, I have heard about Qlik Sense Cloud. It's the Software as a Service (SaaS) offering of Qlik Sense, a data analytics and business intelligence platform. It allows users to create, explore, and share data visualizations and dashboards in the cloud, without the need for on-premise infrastructure.
Qlik Sense Cloud generally provides features like drag-and-drop data loading, associative data exploration, and collaborative sharing capabilities. There are different tiers with varying limitations on the number of users, storage, and features. Some tiers may be free for personal use with limitations while others are paid tiers suitable for teams and organizations.
13. What is a story in Qlik Sense, and how is it useful?
In Qlik Sense, a story is a guided presentation of data insights built from existing visualizations in your apps. It allows you to create a narrative around your data, highlighting key findings and guiding viewers through a specific analytical flow.
Stories are useful because they transform static dashboards into dynamic presentations. They help to:
- Communicate insights effectively: Present key findings to stakeholders in a clear and concise manner.
- Tell a data-driven narrative: Guide the audience through a series of visualizations to illustrate a specific point.
- Facilitate decision-making: Provide actionable insights that can inform business decisions.
- Share and collaborate: Easily share the story with others for collaboration and feedback.
14. Can you describe a scenario where you would use a bar chart versus a pie chart?
I would use a bar chart to compare the sales performance of different products over a specific period. A bar chart is suitable when you want to show the magnitude of different categories, and it easily allows for comparison between them. For example, a bar chart could illustrate monthly sales for Products A, B, and C.
On the other hand, I would use a pie chart to show the percentage breakdown of a whole. If I wanted to visualize the market share of different companies in a particular industry, where the sum of all market shares equals 100%, a pie chart would be appropriate. It quickly reveals the proportion each company holds within the overall market. Pie charts are less effective when you have many categories or when the differences in proportions are small.
15. What does 'drag and drop' mean in the context of Qlik Sense, and how does it help?
In Qlik Sense, 'drag and drop' refers to the action of selecting an object (like a field, chart, or filter) with your mouse and moving it to a new location within the application's interface. This could involve moving fields onto a chart to define its dimensions or measures, rearranging visualizations on a sheet, or placing filters to affect data selections.
Drag and drop simplifies report creation and data exploration. It enables users to quickly build visualizations, create dashboards, and explore data relationships without needing to write complex code or use extensive menus. This intuitive interaction makes Qlik Sense accessible to users with varying levels of technical expertise.
16. What is a 'field' in Qlik Sense, and how does it relate to your data?
In Qlik Sense, a 'field' represents a single column of data within your dataset. Think of it as a named category that holds similar types of information, like 'Customer Name', 'Product ID', or 'Sales Amount'. Fields are the fundamental building blocks for creating visualizations and performing data analysis. Each field contains a set of distinct values representing the unique entries within that column across all records in your data.
Fields relate to your data by providing structure and meaning. When Qlik Sense loads data, it automatically identifies and categorizes columns into fields. These fields are then used to filter, group, and aggregate your data, enabling you to explore relationships and derive insights. Without fields, the data would simply be a collection of numbers and strings without context or usability.
17. How can you share a Qlik Sense app with someone else?
You can share a Qlik Sense app with other users in a few ways. The primary method is through the Qlik Management Console (QMC) by assigning the user access to the app and the stream where the app resides. This grants them the right to view and interact with the app based on their assigned security role.
Another approach is to export the app as a .qvf file. This file can then be imported by another Qlik Sense user. However, this method shares a static copy of the app at the time of export and won't reflect subsequent updates made to the original app.
18. What is the difference between a selection and a filter in Qlik Sense?
In Qlik Sense, both selections and filters reduce the dataset, but they function differently. A selection is made directly by a user interacting with the data, typically by clicking on values in charts or filters. Selections are stateful and drive the associative model; they directly influence which data is considered 'possible', 'selected', or 'excluded' and updates all visualizations accordingly.
A filter, on the other hand, is a more persistent object created for more involved data reduction based on criteria. Filters are part of the data model or a chart's definition, and can also be dynamically applied using expressions or variables. Filters are often used for static data reductions or to refine the dataset on a more permanent basis before the user interacts with the visualisations.
19. What are the benefits of using Qlik Sense over just looking at raw data in a spreadsheet?
Qlik Sense offers significant advantages over analyzing raw data in a spreadsheet. Spreadsheets are primarily for data entry and simple calculations. Qlik Sense provides interactive data visualization and exploration, enabling users to quickly identify trends, patterns, and outliers that would be difficult to spot in a static spreadsheet. Qlik Sense also provides data governance and security, which spreadsheets typically lack.
Key benefits include:
- Data discovery: Easily uncover insights through interactive dashboards and visualizations.
- Data integration: Connect to various data sources, unlike the limitations of spreadsheets.
- Scalability: Handle large datasets that spreadsheets struggle with.
- Collaboration: Share insights and dashboards with other users in a controlled environment.
- Data governance: Centralized data management and security, which prevents unauthorized access.
- Self-service analytics: Empower users to explore data and answer their own questions, reducing reliance on IT.
20. Explain what a calculated field is in Qlik Sense. Why would you create one?
A calculated field in Qlik Sense is a field that is created using an expression. This expression performs a calculation on existing fields in the data model. It's essentially a formula you define that generates a new value based on other data.
You'd create a calculated field for several reasons: to perform data transformations (e.g., converting units), derive new metrics (e.g., calculating profit margin from revenue and cost), create conditional values (e.g., categorizing customers based on purchase history), or simplify complex analysis by pre-calculating values that would otherwise require lengthy expressions in charts and tables.
21. What kind of training resources (online courses, tutorials, etc.) have you used to learn about Qlik Sense?
To learn Qlik Sense, I've utilized a variety of training resources. I've completed several online courses on platforms like Udemy and Coursera, focusing on data visualization principles and Qlik Sense-specific development. The official Qlik Help documentation and Qlik Community forums have also been invaluable resources for troubleshooting and understanding specific functionalities.
Specifically, I used resources to understand Qlik scripting, Qlik Sense data modeling techniques, and Qlik Sense chart types. I practiced by building sample dashboards based on datasets from Kaggle and other open data sources. Also, I've watched tutorial videos on YouTube channels dedicated to Qlik Sense development and best practices.
22. Imagine you have a table with sales data. How would you show the total sales for each region using Qlik Sense?
In Qlik Sense, to display total sales by region, you would create a new sheet or use an existing one. Then, you'd add a Pivot Table or a Straight Table chart. Add 'Region' as a dimension and Sum(Sales) as a measure. Qlik Sense will automatically aggregate the sales data for each unique region in your sales table.
Alternatively, a Bar Chart could be used. Similar to the table, set 'Region' as the dimension and Sum(Sales) as the measure. This provides a visual representation of the sales totals across different regions.
23. What does the term 'associative model' mean in the context of Qlik Sense?
In Qlik Sense, the 'associative model' refers to the underlying data engine and its ability to automatically create associations between data fields across different data tables, without requiring predefined relationships or joins. This means Qlik Sense automatically understands how different fields are related based on common data values.
Because of the associative model, users can freely explore data relationships by selecting any value in any field. Qlik Sense instantly highlights related data and dims unrelated data, enabling users to uncover hidden insights and patterns without needing to write complex queries or define data structures upfront. This contrasts with traditional BI tools that rely on pre-defined queries and rigid data models.
24. What is the purpose of using 'set analysis' in Qlik Sense? Can you give a simple example?
Set analysis in Qlik Sense allows you to create sets of data that define the scope of your aggregations, overriding the selections made by the user. This enables you to compare current selections with historical data, or specific subsets of data, regardless of the user's current filter state. It essentially provides a way to perform calculations on a predefined data set rather than just the currently selected data.
For example, consider an expression calculating total sales for 2022, irrespective of any current year selections. The set expression might look like this: Sum({$<Year={2022}>} Sales). Here, the curly braces {} define the set, and <Year={2022}> specifies that the 'Year' field should only consider values equal to 2022. This allows the chart to always show the total sales for 2022, even if the user has selected 2023 in a filter.
25. How would you handle missing or incomplete data when loading it into Qlik Sense?
When loading data into Qlik Sense with missing or incomplete information, I would use several strategies. First, I'd identify the missing data patterns. Then, I'd use Qlik Sense's built-in functions like IsNull(), If(), Alt(), or ApplyMap() to handle null values by either replacing them with a default value (e.g., 0 for numeric fields, 'Unknown' for text fields), or by imputing values based on other data. If the missing data is in key fields, I would consider excluding incomplete records, but only if it doesn't severely impact the data's integrity or introduce bias. Error handling within the load script (using Trace and Exit Script) is also critical to proactively identify and log data quality issues during the load process.
Additionally, I might create separate tables or fields to flag records with missing data. This allows users to easily identify and filter these records in analyses. For example:
IF(IsNull(FieldName), 1, 0) AS FieldName_MissingFlag;
This creates a flag field indicating whether FieldName is null. Finally, I would document all decisions made regarding data handling to ensure transparency and reproducibility.
26. If you have a large dataset, what are some strategies you could use to optimize the performance of your Qlik Sense app?
To optimize Qlik Sense performance with large datasets, several strategies can be employed. Data reduction techniques are crucial, including filtering unnecessary data during the load process using WHERE clauses in the load script or applying section access. Aggregating data at load time using GROUP BY clauses reduces the amount of data Qlik Sense needs to process at runtime. Also, optimize your data model by creating star schemas, using synthetic keys sparingly, and ensuring data types are appropriate.
Furthermore, optimize your Qlik Sense expressions. Avoid complex calculations within charts, and use set analysis effectively. Caching can also improve performance. For instance, pre-calculating values and storing them in variables or temporary tables can be helpful. Finally, ensure your Qlik Sense server infrastructure is adequately provisioned with sufficient memory and CPU resources. Leverage Qlik Sense's profiling tools to identify bottlenecks and address them accordingly.
Qlik Sense interview questions for juniors
1. What is Qlik Sense, in your own words?
Qlik Sense is a data analytics and data visualization platform. It allows users to explore data, create interactive dashboards, and discover insights. Unlike traditional BI tools that rely on pre-defined queries, Qlik Sense uses an associative engine, which indexes all the data relationships, enabling users to freely explore data from any angle without being limited by pre-built structures.
Essentially, it's a tool that allows you to load data from different sources, visually analyze it, and then make data-driven decisions using the insights gained. The self-service aspect enables business users, not just IT, to create their own reports and dashboards.
2. Can you describe a time you used data to make a decision?
In a previous role, our team was deciding which features to prioritize for the next quarter. We had a long list of potential improvements to our user onboarding flow. To make a data-driven decision, I analyzed user behavior data, specifically focusing on drop-off rates at each step of the onboarding process. I identified a particular step where a significant number of users were abandoning the flow.
Based on this analysis, we prioritized simplifying that specific step. After implementing the changes, we saw a noticeable increase in onboarding completion rates. This experience demonstrated the power of using data to guide decision-making and improve user experience.
3. What are some different types of charts you know?
Some common chart types include: Bar charts (good for comparing categorical data), Line charts (ideal for showing trends over time), Pie charts (useful for displaying proportions of a whole), Scatter plots (effective for illustrating relationships between two variables), and Histograms (used to show the distribution of numerical data). There are also more specialized charts like Box plots, Area charts, and Radar charts, each suited for specific data visualization needs. Choosing the right chart depends on the data type and the insights you want to convey.
4. What is data visualization?
Data visualization is the graphical representation of information and data. By using visual elements like charts, graphs, and maps, data visualization tools provide an accessible way to see and understand trends, outliers, and patterns in data. In essence, it translates complex datasets into easily digestible visual narratives.
It is a crucial component of data analysis because it enables users to identify trends and patterns more quickly and easily than looking through spreadsheets or reading raw data. Good data visualization helps in effective communication and decision-making based on insights derived from the data.
5. Have you ever used drag and drop functionality? How would you use it in Qlik Sense?
Yes, I have used drag and drop functionality extensively in web development. In Qlik Sense, drag and drop is a fundamental interaction pattern used throughout the application. For example, when building an app, you drag dimensions and measures from the Assets panel onto a sheet to create visualizations. Similarly, you can drag selections from one chart to another to filter data using associative selection.
To implement custom drag and drop functionality within a Qlik Sense extension, you would typically leverage JavaScript libraries like Draggable.js or the HTML5 Drag and Drop API. You'd define the elements that can be dragged (the 'draggable' elements) and the areas where they can be dropped (the 'droppable' areas). Event listeners would be attached to these elements to handle the drag start, drag over, and drop events, allowing you to capture the data being dragged and trigger actions within Qlik Sense, such as modifying variable values or applying filters.
6. What is a filter in Qlik Sense?
In Qlik Sense, a filter is a selection applied to the data model that reduces the dataset visible in charts and tables. It allows users to focus on a subset of data based on specific criteria. Applying a filter dynamically updates all associated visualizations, offering interactive data exploration.
Filters can be created in various ways, including:
- Selections: Directly selecting values within a field.
- List Boxes: User-defined lists of values to include or exclude.
- Advanced Search: Using expressions or search terms to define criteria.
- Bookmarks: Saving a specific filter state for later use.
7. Explain what you know about data models.
Data models are conceptual representations of data objects, their associations, and the rules that govern them. They provide a blueprint for organizing data within a system or organization. They are crucial for database design, application development, and data integration.
Different types exist, including:
- Conceptual data models: High-level, user-centric views focusing on what data is needed.
- Logical data models: Define the structure of data elements and relationships between them, independent of specific technologies.
- Physical data models: Detail how the data is stored in a database, including tables, columns, data types, and constraints. These are technology specific (e.g. a physical data model for MySQL might be different from one for PostgreSQL).
8. What does it mean to load data into Qlik Sense?
Loading data into Qlik Sense means extracting data from various data sources, transforming it into a format Qlik Sense can understand, and loading it into Qlik Sense's in-memory engine. This process makes the data available for users to explore, analyze, and visualize within Qlik Sense applications.
Essentially, it involves defining data connections, writing scripts to read and transform the data (using Qlik Sense's data load script language), and then executing those scripts to populate Qlik Sense's internal data storage.
9. What are dimensions and measures in Qlik Sense?
In Qlik Sense, dimensions and measures are fundamental concepts for data analysis.
- Dimensions are categorical fields that provide context and grouping to your data. They are used to define the segments or categories you want to analyze, such as product name, region, or date. They are usually discrete values. Dimensions allow you to slice and dice your data to gain insights.
- Measures are numerical fields that represent the values you want to analyze and aggregate. They are the quantitative data points that you want to sum, average, count, or otherwise aggregate, such as sales revenue, quantity sold, or customer count. Measures are typically continuous values.
10. Can you describe a simple project where you could use Qlik Sense?
A simple project where I could use Qlik Sense is analyzing sales data for a small retail store. The data might include information on product sales, customer demographics, and geographical location. I would load the data from a spreadsheet or database into Qlik Sense.
Using Qlik Sense, I could create visualizations such as:
- A bar chart showing sales by product category.
- A map showing sales by region.
- A line chart showing sales trends over time.
- Filters allow users to quickly explore the data from different angles. This would provide insights into the best-selling products, customer demographics, and areas for potential growth.
11. What is the purpose of using color in a chart?
The primary purpose of color in a chart is to enhance understanding and clarity. Color can highlight key data points, differentiate between categories, and guide the viewer's eye to important trends or outliers.
Specifically, color is used to:
- Distinguish categories: Assigning a unique color to each category in a bar chart or pie chart makes it easier to compare them.
- Highlight important data: Using a contrasting color for significant data points draws attention to them.
- Represent data values: Color scales can be used to represent a range of values, such as in a heatmap.
- Improve aesthetics: Color can make a chart more visually appealing and engaging, but this should not be prioritized over clarity.
12. What is a dashboard?
A dashboard is a visual display of the most important information needed to achieve one or more objectives; consolidated and arranged on a single screen so the information can be monitored at a glance. Dashboards often use charts, graphs, and other visual elements to present data in an easily understandable format. They provide a quick overview of key performance indicators (KPIs) and other relevant metrics.
Dashboards can be used in various contexts, such as business intelligence, web analytics, and project management. For example, in web analytics, a dashboard might display website traffic, bounce rate, and conversion rates. In business intelligence, a dashboard could track sales figures, revenue, and profit margins.
13. How can you connect to different data sources?
Connecting to different data sources involves using appropriate drivers, connectors, or APIs specific to each data source. For databases, you would typically use a JDBC driver (Java), ODBC driver (general), or specific connectors provided by the database vendor (e.g., a Python library for connecting to PostgreSQL). For APIs, you would use HTTP clients or SDKs to make requests to the API endpoints.
Here are some common methods:
- JDBC/ODBC drivers: Used for relational databases.
- API clients (e.g.,
requestsin Python): For RESTful APIs. - Connector libraries (e.g.,
psycopg2for PostgreSQL in Python): Often provide a more Pythonic interface. - Cloud Storage SDKs (e.g., AWS SDK, Google Cloud SDK): For accessing data in cloud storage solutions like S3 or Google Cloud Storage.
14. What is the Qlik Sense Hub?
The Qlik Sense Hub is the central access point for Qlik Sense applications and content. It's a web-based interface where users can find, open, and interact with published Qlik Sense apps. Think of it as a portal to all your Qlik Sense analytics.
Users can browse apps, access shared spaces, and manage their personal sheets and bookmarks within the Hub. It provides a collaborative environment and ensures users are accessing the correct and up-to-date data and visualisations.
15. What is a story in Qlik Sense?
A story in Qlik Sense is a guided presentation of your data, created using snapshots. It allows you to present insights in a narrative format, highlighting key findings and trends.
Stories are created by capturing snapshots of visualizations and combining them into a sequence. You can add text, shapes, and other annotations to provide context and explain the data to your audience. This makes it easy to communicate complex information in a clear and engaging way.
16. What is a calculated field?
A calculated field is a field in a database or data analysis tool that derives its value from other fields through a calculation or formula. Unlike regular fields that store static data, calculated fields dynamically generate their values at runtime. These calculated values are not physically stored within the table itself, saving storage space and ensuring data consistency.
For example, a calculated field might compute TotalCost by multiplying UnitPrice and Quantity. Each time the query is run, the TotalCost is recalculated based on the current UnitPrice and Quantity values. These fields can exist in different tools like, SQL, Excel, and even some dashboards.
17. Why is data quality important?
Data quality is crucial because it directly impacts the reliability and validity of insights derived from data. Poor data quality leads to flawed analyses, incorrect decisions, and ultimately, negative business outcomes. Imagine making strategic decisions based on inaccurate sales figures or incomplete customer profiles – the consequences could be costly.
Specifically, high-quality data ensures more accurate reporting, better model performance in machine learning, and improved operational efficiency. It also fosters trust in data-driven processes and enhances compliance efforts. Conversely, low-quality data results in wasted resources spent on fixing errors, increases operational risks, and can damage an organization's reputation.
18. What is the difference between a bar chart and a pie chart, and when would you use each?
A bar chart uses rectangular bars to represent data values, with the length of the bar proportional to the value it represents. It's best for comparing values across different categories or showing changes over time. A pie chart, on the other hand, is a circular chart divided into sectors, where each sector represents a proportion of the whole. It’s best used for showing the relative proportions of different categories within a single dataset.
Use a bar chart when you need to compare discrete categories or track changes over time, especially when dealing with numerous categories. Use a pie chart when you want to show the parts of a whole, and the number of categories is relatively small (ideally less than 6-7), to avoid clutter.
19. How can you share a Qlik Sense app with someone else?
You can share a Qlik Sense app in several ways:
- Sharing from the Qlik Sense Hub: You can directly share an app with other users who have access to the Qlik Sense environment. This involves selecting the app in the hub and using the 'Share' option, then specifying the users or groups you want to grant access to. These users will need appropriate permissions within the Qlik Sense environment.
- Exporting the App: An app can be exported as a
.qvffile, which can then be imported by another user into their Qlik Sense environment. This is suitable for sharing apps between different Qlik Sense deployments or with users who don't have access to the same Qlik Sense Enterprise or Cloud instance. However, it's important to consider data security and licensing implications when sharing.qvffiles.
20. What is the use of bookmarks in Qlik Sense?
Bookmarks in Qlik Sense allow users to save a specific selection state, layout, and other configurations within an app. This enables users to easily return to a previously defined view of the data, preserving filter selections, object visibility, and other customizations.
Bookmarks are useful for:
- Personalization: Saving preferred views of the data.
- Collaboration: Sharing specific insights with colleagues.
- Storytelling: Creating a narrative by guiding users through different selections and views.
- Analysis: Quickly switching between different analysis scenarios.
21. What is an extension in Qlik Sense?
In Qlik Sense, an extension is a custom-built component that enhances the platform's functionality beyond its built-in features. It allows developers to add new visualizations, alter default behaviours, integrate with external systems, or introduce entirely novel features to the Qlik Sense environment.
Extensions are created using web technologies like HTML, CSS, and JavaScript, often leveraging Qlik Sense's APIs. They are packaged and imported into Qlik Sense, where they can be used and shared across applications. Common extension types include custom chart types, connectors to new data sources, and integrations with external APIs.
22. Can you explain how data is associated in Qlik Sense?
Qlik Sense uses an associative data model. This means that data from different tables is associated based on common fields (field names and matching data values). Qlik Sense automatically detects these associations during data loading, creating a unified view of your data without explicit joins.
Specifically, Qlik Sense works by keeping all data in memory and then highlighting related/associated data based on selections. You can click on a value, and Qlik Sense will visually highlight all the related data. Any field that shares a similar data value establishes the association. Behind the scenes, Qlik Sense builds an internal association table when the data model is loaded, so you are not required to define the joins.
23. What does it mean to 'clean' data?
Data cleaning, also known as data cleansing, is the process of identifying and correcting errors, inconsistencies, and inaccuracies within a dataset. The goal is to improve data quality, making it suitable for analysis and decision-making. This involves tasks such as:
- Handling missing values: Imputing or removing incomplete data points.
- Removing duplicates: Eliminating redundant entries.
- Correcting errors: Fixing typos, inconsistencies in formatting, and invalid values. For example, converting all date formats to
YYYY-MM-DD. - Standardizing data: Ensuring consistency in units, naming conventions, and data representation.
- Filtering noise: Removing irrelevant or outlier data points that could skew results. The process typically involves identifying and addressing missing data, incorrect data, and inconsistencies, ensuring a more reliable and accurate dataset.
24. What's the difference between a master item and a regular object?
The distinction between a "master item" and a "regular object" depends heavily on the context of the system or platform being discussed. However, broadly speaking, a master item serves as a template or blueprint for creating other objects. Think of it as a parent from which children are cloned or instantiated.
Regular objects, on the other hand, are typically instances of a class, template or other master item. They are individual, concrete instances with their own specific data and potentially unique behaviors. Changes made to a master item may or may not propagate to regular objects derived from it, depending on the implementation. A master item is a general definition, while a regular object is a specific realization.
25. Explain what a KPI is and why is it important to monitor?
A Key Performance Indicator (KPI) is a measurable value that demonstrates how effectively a company is achieving key business objectives. KPIs are used to evaluate the success of reaching targets.
Monitoring KPIs is crucial because it provides insights into performance, allowing for informed decision-making. By tracking KPIs, businesses can identify areas that are performing well and those that need improvement, enabling them to adjust strategies and allocate resources effectively. This ultimately leads to better results and achievement of strategic goals.
26. What are the different types of selections in Qlik Sense?
Qlik Sense offers several selection types:
- Green Selections: These are selections made by the user, explicitly filtering data. Only data associated with the selected values is displayed.
- White Selections: Represent associative data, the data that is associated with the green selections. This data remains visible, showing the impact of the selections.
- Grey Selections: Indicate excluded data, data that isn't associated with the green selections. This data is typically dimmed or hidden to emphasize the current selections.
- Alternate States Selections: Qlik Sense allows creating Alternate States, enabling users to compare different sets of selections and analyses side by side without affecting the base data. Selections within an Alternate State are independent of the base selections.
27. What is Qlik Sense Cloud?
Qlik Sense Cloud (now Qlik Cloud) is a Software-as-a-Service (SaaS) analytics platform offered by Qlik. It allows users to create, explore, and share data visualizations and dashboards in the cloud. Think of it as a fully managed Qlik Sense environment, where Qlik handles the infrastructure, updates, and maintenance.
Key features include data connectivity to various sources (cloud and on-premise), drag-and-drop interface for creating visualizations, collaborative sharing, and mobile accessibility. Qlik Cloud comes in different tiers, including a free version (Qlik Sense Cloud Basic) and paid subscriptions (Qlik Sense Cloud Business and Enterprise), each offering different levels of features and capabilities.
28. What are the advantages of using Qlik Sense over Excel?
Qlik Sense offers several advantages over Excel, particularly for data analysis and visualization. Qlik Sense is designed to handle large datasets efficiently, whereas Excel's performance degrades significantly with larger data volumes. Qlik Sense's associative engine allows users to explore data relationships freely without pre-defined hierarchies, a capability not available in Excel. Furthermore, Qlik Sense provides advanced data visualization options, interactive dashboards, and self-service analytics, empowering users to gain deeper insights compared to Excel's more limited charting and reporting features.
Additionally, Qlik Sense provides robust data governance and security features suitable for enterprise-level deployments. It supports collaborative analysis and version control, which are lacking in Excel's single-user focused environment. Finally, Qlik Sense offers mobile accessibility and the ability to embed analytics into other applications, providing a more flexible and scalable solution than Excel.
29. If you were given a messy spreadsheet, how would you start exploring the data in Qlik Sense?
First, I'd load the spreadsheet into Qlik Sense. Then, I'd leverage Qlik Sense's data profiling capabilities to get a high-level overview. Specifically, I'd use the Data Load Editor to examine sample data, check data types, identify missing values, and spot any immediately obvious inconsistencies or errors in the spreadsheet's columns (e.g., unexpected characters, leading/trailing spaces).
Next, I'd use the auto-generated visualizations and Qlik Sense's associative engine to explore relationships between fields. I'd start by looking at frequency distributions (histograms) to understand the range of values in each column and then investigate seemingly correlated dimensions with scatter plots and other suitable chart types. I'd also pay close attention to the automatically generated key driver analysis from Insights Advisor to understand which dimensions have the biggest impact on the most critical measures. This iterative exploration will help me identify areas requiring cleaning or transformation.
Qlik Sense intermediate interview questions
1. How do you optimize Qlik Sense dashboards for mobile devices?
To optimize Qlik Sense dashboards for mobile, focus on responsiveness and performance. Simplify the layout by reducing the number of objects and using containers to dynamically show/hide content based on screen size. Utilize Qlik Sense's built-in responsive design features, adjusting object sizes and positions for smaller screens.
Improve performance by using efficient data models, minimizing data loaded, and optimizing expressions. Consider using smaller datasets specifically for mobile dashboards, or leveraging server-side rendering options. Test on various mobile devices and network conditions to ensure a smooth user experience. Also, ensure images are optimized for mobile by using smaller sizes.
2. Explain the difference between a 'Let' statement and a 'Set' statement in Qlik Sense scripting.
In Qlik Sense scripting, both Let and Set are used to assign values to variables, but they differ in how those values are interpreted.
Letstatements perform expression evaluation. The right-hand side of aLetstatement is treated as an expression, which is evaluated, and the resulting value is assigned to the variable. If the value on the right-hand side is a variable, then the engine will replace it's name by it's value. For example:Let vToday = Today();Setstatements, on the other hand, perform a literal assignment. The right-hand side is assigned to the variable as a string without evaluation. For example:Set vToday = Today();. If you tried to use the variable later, it would use 'Today()' literally and not the output of the Today() function.
3. Can you describe a scenario where you would use a Cyclic Group in Qlik Sense?
A cyclic group in Qlik Sense can be useful when you want to dynamically cycle through a predefined set of dimensions in a chart or table. For instance, imagine a dashboard analyzing sales data where you want the user to easily switch between viewing sales by 'Region', 'Product Category', and 'Sales Rep'.
Instead of creating multiple charts or using a complex conditional dimension, you can define a cyclic group containing these three dimensions. The user can then use a control (like a button or list box) to advance the cyclic group, which will automatically change the dimension being displayed in the chart. This provides a cleaner user experience and simplifies the dashboard's design. You'd define the cyclic group in the script, and then reference it as the dimension in your chart.
4. How would you implement row-level security in a Qlik Sense application?
Row-level security in Qlik Sense can be implemented primarily using Section Access in the load script. This involves creating a separate section within the script (using SECTION ACCESS;) to define user access to specific data rows. A table is typically loaded in this section mapping users (usually their user ID or NTNAME) to specific data values or criteria that they are allowed to see. This table will have at least two columns, one for the user ID and one or more columns representing the values they can see in the data.
After defining the access rules in Section Access, you switch back to the regular data loading section (using SECTION APPLICATION;). The data loaded in this section is then filtered based on the criteria defined in Section Access. Qlik Sense automatically applies these filters based on the currently logged-in user, effectively providing row-level security. Remember to include the NTNAME or equivalent user identifier in your data model to link users to specific data entries.
5. What are the key considerations when designing a Qlik Sense data model for performance?
When designing a Qlik Sense data model for performance, key considerations include: Data Reduction (reducing the amount of data loaded into Qlik Sense, possibly through filtering or summarization), Data Modeling Best Practices (using star schemas, avoiding synthetic keys where possible, and ensuring efficient key relationships), Optimized Data Loading (using incremental loads, optimized data connections and efficient script), Calculated Dimensions and Measures (optimize complex calculations that impact performance), Memory Management (monitor and manage Qlik Sense memory usage, including server resources, and consider using techniques to minimize memory footprint such as aggregation) and Proper Indexing. Avoiding complex expressions in the UI can also improve the user experience.
More details involve:
- Star Schema: Prioritize a star schema. This involves having a central fact table linked to dimension tables.
- Synthetic Keys: Minimize or eliminate synthetic keys. Use composite keys or properly concatenate fields in the script instead. If unavoidable explore using
QualifyandUnqualify. - Circular Loops: Avoid circular loops in the data model. These can cause Qlik Sense to become unstable.
- Incremental Loads: Use incremental loads when dealing with large datasets to only load new or updated data.
- Field Optimization: Reduce the number of distinct values in fields, as this affects memory consumption. Explore using mapping tables to consolidate values.
- Optimize Expressions: Simplify complex expressions where possible, use
Set Analysisefficiently and avoid complexifstatements in chart expressions. - Data Types: Using numeric rather than string data types to increase performance.
- Null Handling: Effectively handling null values can prevent unexpected calculation results. Explore
NullAsValueif required.
6. Explain the purpose and benefits of using incremental load in Qlik Sense.
Incremental load in Qlik Sense is used to load only the new or modified data from a data source into a Qlik Sense app, rather than reloading the entire dataset each time. This is particularly useful for large datasets where a full reload would be time-consuming and resource-intensive.
The benefits include:
- Reduced load time: Only new/changed data is loaded, significantly speeding up the refresh process.
- Lower resource consumption: Less data is processed, resulting in lower CPU and memory usage.
- Improved app performance: Faster reloads contribute to a more responsive and user-friendly application.
- Data retention: Historical data is preserved, as only updates are applied.
- Reduced strain on source system: Since full loads are not happening every time, the load to source system is significantly reduced.
7. How can you handle slowly changing dimensions in Qlik Sense?
Slowly Changing Dimensions (SCDs) in Qlik Sense can be handled using several approaches:
- Type 0 (Retain Original): Keep the original attribute value without changes. This is the simplest approach, useful when history is not needed for that specific attribute.
- Type 1 (Overwrite): Update the existing record with the new value. Data history is lost, but the data is current. You would typically reload the data from the source and Qlik Sense would update accordingly, if data changes are detected. If this occurs in your source data, ensure the reload process handles this correctly.
- Type 2 (Add New Record): Create a new record with the new attribute value and update the existing record to mark it as inactive. This involves maintaining
StartDateandEndDateorIsCurrentflags. Qlik Sense can then filter based on these flags to get the current record or analyze historical data. Qlik Sense doesn't inherently manage this. This needs to be managed within your source data/ETL layer. For example, in your data model, you would need to create calculated dimensions and measures.=Sum({<IsCurrent={1}>} Sales)would give you current sales. - Type 6 (Combination): Combine Type 1 and Type 2. Add new records for historical tracking and also overwrite the current record with the latest values. This approach offers the benefits of both methods. Similar to type 2, Qlik Sense manages display based on the flags or calculations within the source data/ETL layer.
The key is to manage the SCD types during the data loading process (ETL) prior to loading into Qlik Sense. Qlik Sense then leverages appropriate filtering or calculations to display the correct information based on your chosen SCD strategy.
8. Describe a situation where you would use the 'ApplyMap' function and explain how it works.
I would use the applymap function in pandas when I need to apply a function to every element of a DataFrame. For example, suppose I have a DataFrame containing numerical data represented as strings, and I want to convert all these string representations to actual numerical values. I can define a function that performs the conversion (e.g., using float()) and then use applymap to apply this function to each cell in the DataFrame.
applymap works by iterating over each element of the DataFrame and passing it as an argument to the provided function. The result of the function call replaces the original value in the DataFrame. It's different from apply which operates on rows or columns, whereas applymap operates element-wise.
9. What are the different types of Qlik Sense licenses available, and how do they impact functionality?
Qlik Sense offers several licensing options that impact functionality and user access. These primarily fall into two categories: Professional and Analyzer.
- Professional User: Grants full access to Qlik Sense functionality. Professional users can create, edit, publish, and share apps and visualizations. They have complete authoring capabilities.
- Analyzer User: Provides consumption-only access. Analyzer users can view and interact with existing apps and visualizations but cannot create or modify them. They're primarily for data consumers.
Beyond these, there are also capacity-based licenses (e.g., Qlik Sense Enterprise SaaS consumption credits) and OEM licenses, which offer different models for access and usage tied to specific deployments and partnerships. Qlik Sense Enterprise SaaS also has a 'User allocation' license that is similar to the Professional user license.
10. How do you troubleshoot performance issues in a Qlik Sense application?
Troubleshooting Qlik Sense performance involves a multi-faceted approach. First, identify the specific areas experiencing slowness: data load, app reloads, or user interface responsiveness. Monitor system resources (CPU, memory, disk I/O) on the Qlik Sense server and the database server if external. Review the Qlik Sense logs for errors or warnings. Long reload times often point to data loading issues, so optimize your load scripts, use incremental loads where appropriate, and ensure efficient data modeling.
For UI performance, analyze the complexity of charts and expressions. Simplify complex calculations, reduce the number of dimensions/measures in charts, and leverage set analysis effectively. Use the Qlik Sense Performance Analyzer or browser developer tools to identify slow-rendering components. Consider optimizing data connections (using optimized connectors), and ensure that the network latency between the client and the server is minimal. Furthermore, check data model size (use the =len() function in Qlik Sense) and explore alternative solutions such as aggregations for large data sets.
11. Explain the concept of 'Data Lineage' in Qlik Sense and how you would implement it.
Data lineage in Qlik Sense refers to the process of understanding and visualizing the journey of data, from its origin to its final destination within the Qlik Sense application. It helps trace the data's transformations, calculations, and aggregations applied along the way. Knowing the source of your data and transformations applied makes understanding data easier, and improves data governance efforts.
Implementing data lineage in Qlik Sense involves a few steps. First, document data sources used in the app, and the steps and scripts used to load and transform the data. Then use techniques like naming conventions for fields and variables, and comments in the load script to make it easier to understand the process. Version control for apps is important. Tools like Qlik Lineage Connect can also be used, though it is a separate paid product. The goal is to maintain clear documentation, making it easier to troubleshoot issues or assess the impact of changes made to the application or its data sources. Ultimately, data lineage ensures that users trust the data they are viewing and making decisions with.
12. How can you embed a Qlik Sense object into a web page or another application?
You can embed Qlik Sense objects into web pages or other applications using the Qlik Sense Mashup API. This involves creating a web page and using JavaScript to connect to the Qlik Sense server, select the desired app, and then embed the specific object (like charts, tables, or filters) using its object ID.
Specifically, you will need to:
- Reference the Qlik Sense client.js library.
- Use the Qlik Sense API to open the desired app.
- Get a reference to the object using
app.getObject(elementId, objectId). - The
elementIdis the ID of the html element where the object will be rendered, andobjectIdis the ID of the Qlik Sense object you want to embed.
An example of embedding an object is:
qlik.openApp(appId, config).then(function(app) {
  app.getObject('QV01', 'YourObjectId');
});
13. Describe the process of setting up and configuring Qlik Sense Enterprise on Kubernetes.
Setting up Qlik Sense Enterprise on Kubernetes involves several key steps. First, you'll need a Kubernetes cluster. Then, you prepare the environment by configuring storage classes and creating namespaces. Next, you deploy the Qlik Sense Enterprise using the provided Helm charts or the Qlik Sense Kubernetes distribution package. Configuration involves setting up ingress controllers for external access, configuring persistent volumes for data storage, and defining resource limits for the Qlik Sense pods.
Post-deployment, you'll need to configure Qlik Sense Enterprise Manager (QEM) and license the deployment. You configure networking and security aspects such as TLS certificates for secure communication. Monitoring and logging are set up using tools like Prometheus and Elasticsearch, often integrated via Helm charts for observability within the Kubernetes environment. Finally, regular maintenance and updates are performed using Helm upgrades or by applying new Kubernetes manifests.
14. How do you manage and monitor Qlik Sense apps using the Qlik Management Console (QMC)?
The Qlik Management Console (QMC) is the central management interface for Qlik Sense. I use it to manage and monitor apps through several key features. First, I manage app access by configuring security rules that define who can access specific apps or data. These rules are based on attributes like user groups or custom properties. Second, I monitor app performance by checking resource consumption (CPU, memory) and reload history to identify potential bottlenecks. Third, I schedule app reloads to ensure data is up-to-date, configuring frequency and dependencies between apps. Finally, I utilize the QMC to manage content libraries, enabling centralized storage and reuse of approved data sources and visualizations across multiple apps.
Specifically, for monitoring, the 'Monitoring apps' section helps keep an eye on app reloads, sessions, and object usage. I can also examine the logs within QMC to troubleshoot issues related to app performance or data connectivity. The 'License monitor' app is a Qlik-provided application that utilizes the Qlik auditing logs to provide insights into license usage across your Qlik Sense environment.
15. Explain how you would use variables to control the behavior of a Qlik Sense application.
Variables in Qlik Sense act as containers for values that can be reused throughout an application. They enable dynamic control over various aspects like calculations, selections, chart properties, and even the overall user experience. For example, you could define a variable vSalesThreshold and use it in an expression to highlight sales figures exceeding that threshold. Users could then change the variable's value via an input box, instantly updating the visualization. This offers interactive control.
Specifically, variables can be used to:
- Modify chart titles or labels dynamically.
- Drive conditional visibility of objects using
show()functions with expressions including variables. - Control aggregation levels in expressions. For instance, switching between yearly, quarterly, or monthly aggregates by modifying a variable.
- Manage security rules by assigning user groups to variables. This is especially helpful with
Section Access.
Variables are defined in the variable overview, can be static or calculated based on expressions, and referenced using $(=VariableName) in expressions. Setting a variable's value involves using actions such as Set Variable within buttons, input boxes, or triggers.
16. What is the purpose of the 'Where' clause in a Qlik Sense script, and how does it differ from 'If'?
The Where clause in a Qlik Sense script is used to filter data during the data loading process. It acts like a gatekeeper, determining which records from the source data are actually loaded into Qlik Sense's associative engine. Essentially, it's a data reduction tool applied at the source.
The If statement, on the other hand, is used for conditional logic within the script, often for transforming data or controlling the script's execution flow. While If can indirectly affect which data is loaded, it primarily operates on data that's already in the script's memory. Where filters before loading, If operates after loading (or, often, during script processing of data that will potentially be loaded), meaning Where is more efficient for reducing the dataset size from the beginning.
17. How do you create and use custom themes in Qlik Sense?
Custom themes in Qlik Sense allow you to tailor the application's look and feel. To create a theme, you'll typically modify or create new CSS files defining styles for various Qlik Sense components. These files are then placed within a specific folder structure under the Qlik Sense installation directory, typically C:\ProgramData\Qlik\Sense\Repository\Extensions\YourThemeName. Within this folder, you generally have a theme.json file (defining metadata) and a styles.css (containing CSS rules).
To use a custom theme, after creating the appropriate files, you select it within the Qlik Management Console (QMC). Navigate to "Themes", import the new theme, and then set the theme for an app in either the QMC or the app's properties in the hub. Remember that custom themes can impact performance; therefore, testing is crucial. For example, a simple css modification could look like this:
.qv-object {
  background-color: #f0f0f0 !important; /* Light grey background */
  border: 1px solid #ccc !important; /* Light grey border */
}
18. Explain the benefits and drawbacks of using Direct Discovery in Qlik Sense.
Direct Discovery in Qlik Sense allows you to query data directly from large data sources without loading the entire dataset into Qlik's in-memory engine. This benefits by enabling analysis of massive datasets that would otherwise be impossible to load due to memory limitations. Also, data is always up-to-date, reflecting the most recent changes in the source database. However, Direct Discovery's drawback is performance. Queries can be significantly slower than in-memory analysis, as each interaction requires a query to the external database. Additionally, it depends on the performance and availability of the external data source. It also adds complexity to the Qlik Sense data model and requires careful consideration of query optimization to mitigate performance bottlenecks.
19. How would you handle missing or incomplete data in a Qlik Sense application?
Missing or incomplete data in Qlik Sense can be handled using several strategies. First, you can use the IsNull() or Len() functions within the load script to identify missing values and replace them with a default value using the If() function or ApplyMap(). For instance, If(IsNull(MyField), 'Unknown', MyField) would replace null values in 'MyField' with 'Unknown'. You could also filter out records with missing or invalid values using the Where clause in the load script.
Second, Qlik Sense's data modeling capabilities let you create calculated dimensions or measures that gracefully handle missing data. For example, you can use Aggr() with NODISTINCT to display a count of records even when a dimension value is missing. Finally, data profiling tools within Qlik can help identify the scope and nature of missing data, guiding data cleaning and transformation efforts. Make sure the approach selected is appropriate to your business needs.
20. Describe a scenario where you would use a 'Join' operation in Qlik Sense and explain the different types of joins available.
A 'Join' operation in Qlik Sense is used to combine data from two or more tables based on a related column or columns. For example, you might have an 'Orders' table and a 'Customers' table, and you want to create a combined table to analyze order information alongside customer details. You would join these tables on a common field, like 'CustomerID'.
Qlik Sense supports several types of joins:
- Inner Join: Returns only the rows where there is a match in both tables.
- Left Join: Returns all rows from the left table and the matching rows from the right table. If there is no match in the right table, null values are returned for the right table's columns.
- Right Join: Returns all rows from the right table and the matching rows from the left table. If there is no match in the left table, null values are returned for the left table's columns.
- Outer Join (Full Outer Join): Returns all rows from both tables. If there is no match, null values are returned for the missing columns.
- Keep: This is similar to a join but rather than physically joining the tables, it will keep only the overlapping values in the internal table. Like inner join, it only keeps data where matching values are in both tables, however it doesn't combine them.
- Cross Join: This join combines each row from one table with every row from another table, resulting in a Cartesian product.
21. What are the different types of charts available in Qlik Sense, and when would you use each type?
Qlik Sense offers a variety of charts for visualizing data. Some common types include: Bar charts (comparing values across categories), Line charts (showing trends over time), Pie charts (displaying proportions of a whole, but use sparingly), Scatter plots (examining relationships between two variables), Maps (geospatial data), and Treemaps (hierarchical data as nested rectangles).
The best chart depends on the data and insights you want to convey. Use bar charts for discrete comparisons, line charts for time series, scatter plots for correlations, and maps for geographic information. Choose the chart that best highlights the key patterns in your data.
22. How do you create and use bookmarks in Qlik Sense?
Bookmarks in Qlik Sense allow you to save and share specific selections, filter states, and layouts within an app. To create a bookmark, first make your desired selections and adjustments to the app. Then, click the bookmark icon (usually a flag or ribbon), give the bookmark a descriptive name, and save it.
To use a bookmark, simply open the app, click the bookmark icon, and select the bookmark you want to apply. This will restore the app to the exact state that was saved, including any selections, filter settings, and sheet location. Bookmarks can be shared with other users, ensuring everyone can view the same data state and analysis.
23. Explain how you would implement version control for Qlik Sense applications.
Implementing version control for Qlik Sense applications involves exporting the application definition (as a .qvf file) and storing it in a version control system like Git. Each time significant changes are made to the application (e.g., data model modifications, new visualizations, script updates), the .qvf file is exported again and committed to the repository. This provides a history of changes and enables reverting to previous versions if needed. Branches can also be used to manage parallel development efforts or test new features without impacting the production application.
To streamline the process, consider using command-line tools or APIs to automate the export of .qvf files after changes. Tools like Qlik-CLI can be integrated into CI/CD pipelines to automatically back up and version control applications as part of the deployment process. Additionally, tracking individual changes within the Qlik Sense UI can be augmented with detailed commit messages in Git to explain the purpose and impact of each version.
24. Describe how you can use Qlik Sense to perform sentiment analysis on text data.
Qlik Sense can perform sentiment analysis by integrating with external sentiment analysis APIs or libraries. First, you'd load your text data into Qlik Sense. Then, you'd use the Qlik Sense scripting language to call an external API (e.g., using the LIB CONNECT TO statement to establish a connection and HTTP request to send the text and receive a sentiment score). Alternatively, you could pre-process the data outside of Qlik Sense using tools like Python with libraries such as VADER or TextBlob, storing the sentiment scores as part of the dataset.
Once you have the sentiment scores, you can visualize them in Qlik Sense using charts and tables. For example, you could create a bar chart showing the distribution of sentiment scores across different categories or use a scatter plot to explore the relationship between sentiment and other variables in your data. You can also use Qlik Sense's filtering capabilities to drill down into specific segments of the data and see how sentiment varies across them.
25. What security best practices should be followed while developing Qlik Sense applications?
When developing Qlik Sense applications, several security best practices should be followed. Data connections should use secure protocols (HTTPS, TLS) and employ appropriate authentication mechanisms like user ID/password, Kerberos, or certificates. Secure data at rest by encrypting sensitive data within Qlik Sense apps, considering field-level encryption where necessary. Limit data access through Section Access to ensure users only see authorized information. Regularly review and update access control lists. Use parameterized queries and avoid dynamic SQL to prevent SQL injection vulnerabilities. Input validation should be in place to prevent malicious scripts from running.
Further enhance security by implementing Content Security Policy (CSP) to control the resources a Qlik Sense app is allowed to load, mitigating XSS attacks. Keep Qlik Sense server and client software up to date with the latest security patches. Monitor Qlik Sense logs for suspicious activity and implement intrusion detection systems. Educate developers and administrators about common security threats and best practices for secure Qlik Sense development and deployment.
26. Explain the difference between calculated dimensions and calculated measures.
Calculated dimensions and calculated measures are both derived from existing data but serve different purposes in data analysis and visualization. A calculated dimension is a field that categorizes data, often used for grouping and filtering. It's typically based on transformations or combinations of existing dimensions, creating new categorical attributes. For example, combining 'City' and 'State' fields into a 'Location' dimension.
In contrast, a calculated measure performs calculations on numerical data, providing aggregated values like sums, averages, or counts. It's used to quantify data and derive insights. For example, calculating 'Profit Margin' by dividing 'Profit' by 'Revenue'. Measures are inherently numerical and are the values being analyzed, while dimensions provide the context for that analysis.
27. How do you integrate Qlik Sense with other data sources, such as APIs or cloud services?
Qlik Sense can integrate with various data sources like APIs and cloud services using connectors and the Qlik REST Connector. The Qlik REST Connector is particularly useful for pulling data from REST APIs. You configure a connection by specifying the API endpoint, authentication details (if required), and any necessary parameters. Once configured, Qlik Sense can load data from the API response (typically JSON or XML) into its data model.
For cloud services or other databases not directly supported, one can utilize pre-built Qlik connectors or ODBC/JDBC drivers. If no connector exists, consider building a custom connector using the Qlik Associative Engine API or employing an ETL tool to extract, transform, and load data into a supported data source accessible by Qlik Sense.
28. Explain how you would go about optimizing the performance of a Qlik Sense app that is slow to load or respond.
To optimize a slow Qlik Sense app, I'd start by identifying the bottleneck. Common culprits include inefficient data loading, complex expressions, and large datasets. I'd then optimize the data loading process by ensuring only necessary fields are loaded, using incremental loads, and optimizing the QVD layer. Furthermore, I would examine expressions for inefficiencies. Simplify complex calculations, use Set Analysis effectively, and minimize the use of Aggr() function. Finally, I would limit the amount of data being shown at any given time by using selection filters, calculated dimensions or detail visualizations.
If those measures are not enough, I would consider server side rendering and investigate server resource usage (CPU, memory) for potential hardware bottlenecks. It is also important to minimize the number of extensions in use and use only those extensions that are efficient.
Qlik Sense interview questions for experienced
1. Describe a complex Qlik Sense application you developed, highlighting the challenges you faced and how you overcame them.
I developed a Qlik Sense application for a large retail chain to analyze sales performance across various regions and product categories. The primary challenge was handling the massive dataset (over 500 million rows) and ensuring acceptable performance. Initially, the app was slow and unresponsive.
To overcome this, I implemented several optimization techniques. First, I optimized the data model by creating aggregated tables using Qlik's Aggr() function in the load script to reduce the volume of data loaded into the front end. Second, I used set analysis extensively to perform complex calculations efficiently within the charts. I also leveraged Qlik's incremental load capabilities to update the data daily without reloading the entire dataset. Finally, I optimized the expressions in the charts themselves, avoiding complex calculations where possible and using calculated dimensions for filtering. This resulted in a significant performance improvement, making the app usable and providing valuable insights to the business users. Using Trace statements within the load script also helped identify bottlenecks.
2. How have you utilized Set Analysis to solve a specific business problem, and what were the key benefits?
I used Set Analysis in Qlik Sense to analyze sales performance against a specific target audience. The business problem was a decline in sales within a particular demographic group despite overall growth. I created a set expression to isolate sales data only for this demographic (e.g., {$<Demographic={'Young Adults'}>}). Then, I compared this set against the total sales using another set expression ({$<}>).
The key benefits were:
- Targeted Analysis: Allowed precise isolation of the problem demographic, avoiding data dilution.
- Clear Insight: Revealed that while overall sales were up, sales within the target demographic were significantly down.
- Actionable Results: This insight led to a focused marketing campaign tailored to the target demographic, resulting in a subsequent sales increase. This would have been hard to pinpoint without the precision Set Analysis provided.
3. Explain your experience with Qlik Sense extensions and provide an example of when you would choose to use one.
I have experience developing and implementing Qlik Sense extensions to enhance the platform's functionality and visualization capabilities. My work has included creating custom visualizations (e.g., advanced charts beyond Qlik Sense's standard library) and integrating external data sources directly into Qlik Sense dashboards. This involved using Qlik Sense's APIs, JavaScript, HTML, and CSS to build interactive and dynamic extensions.
I would choose to use a Qlik Sense extension when the built-in functionalities don't meet specific requirements. For example, if I needed a specialized network graph visualization to analyze complex relationships between data points, or if I needed to integrate with a niche external API not supported by Qlik Sense's standard connectors. In such cases, a custom extension would provide the necessary flexibility and control to achieve the desired outcome. Another use case might be to embed a 3rd party chart library (e.g., D3.js, Chart.js) to offer a unique look and feel.
4. Discuss your approach to optimizing Qlik Sense performance, including techniques for data modeling and expression design.
To optimize Qlik Sense performance, I focus on both data modeling and expression design. In data modeling, I prioritize creating a star schema, minimizing synthetic keys by resolving common fields, and using optimized load scripts (e.g., incremental loads, QUALIFY statements, calculated fields in Qlik Sense instead of the database where appropriate). Reducing data footprint is key; I remove unnecessary fields and rows. I also make use of QVD layers for efficient data storage and reuse, and ensure proper indexing where needed.
For expression design, I aim for simplicity and efficiency. I leverage set analysis to perform aggregations within the application instead of through complex joins in the data model, and utilize variables to store frequently used calculations. I avoid using nested IF statements when possible and favor alternative expressions (e.g., Pick() and Match()), and use Only() with care due to its potential performance impact. I also profile expressions with the Qlik Sense performance analyzer and log statements to identify bottlenecks. Finally, when possible, I pre-calculate performance impacting expressions in the load script as new fields when appropriate.
5. How do you ensure data quality and accuracy within Qlik Sense applications you develop?
Ensuring data quality in Qlik Sense involves several steps. Data validation during ETL processes is critical, including checks for completeness, data type consistency, and adherence to defined business rules. Qlik Sense's data profiling capabilities can be used to identify anomalies and outliers. Using Qlik Sense's script functions for data cleansing (e.g., Trim(), Upper(), NullIf()) and transformation during the load process is also important. Furthermore, rigorous testing of the application, including unit tests and user acceptance testing (UAT), helps identify and rectify data-related issues.
Post-deployment, ongoing monitoring of data accuracy is essential. Implementing data lineage tracking helps trace data back to its source, allowing for quick identification of data quality problems. Creating key performance indicators (KPIs) related to data quality and regularly reviewing them ensures that data remains accurate and reliable over time. Dashboards can also be built to visualize data quality metrics and highlight potential issues for investigation.
6. Describe your experience with Qlik Sense's security features and how you have implemented them to protect sensitive data.
I have experience implementing Qlik Sense's security features to protect sensitive data, primarily focusing on authentication, authorization, and data reduction. For authentication, I've configured various methods including Active Directory integration and multi-factor authentication to verify user identities. For authorization, I've used security rules to control access to apps, streams, and objects based on user roles and groups. These rules define who can view, edit, or publish content.
Data reduction is another key area where I've implemented security. I've used Section Access to filter data at the row level, ensuring users only see the data they are authorized to view. This is often based on user attributes or group membership. I've also worked with data masking techniques to obfuscate sensitive information, such as Personally Identifiable Information (PII), while still allowing for meaningful analysis. I am also familiar with setting appropriate permissions on underlying data sources to prevent unauthorized access at the data level.
7. How have you integrated Qlik Sense with other business intelligence or data warehousing tools?
I've integrated Qlik Sense with other BI and data warehousing tools primarily through data connectors and APIs. For instance, I've used Qlik's native connectors to pull data from data warehouses like Snowflake and Amazon Redshift directly into Qlik Sense apps. This involved configuring the connector with the appropriate credentials and defining the data selection queries.
Furthermore, I've integrated Qlik Sense with other tools, such as Tableau and Power BI, by leveraging APIs for data sharing and embedding. This might involve creating custom extensions in Qlik Sense that call APIs to retrieve data or visualizations from the other platforms. I have also used tools like ODBC drivers to make connections between Qlik Sense and other data sources. I can write SQL statements to retrieve data, if required.
8. Explain your experience with advanced Qlik Sense scripting techniques, such as incremental load or binary load.
I have experience using advanced Qlik Sense scripting techniques to optimize data loading and improve application performance. Specifically, I've implemented incremental loads to only load new or modified data, reducing load times and resource consumption. This involved using QVD files to store historical data, tracking the last load timestamp, and filtering the data source to retrieve only records updated since that timestamp. The script would then append the new data to the existing QVD. For example:
//Load new or modified data
LOAD *
FROM DataSource
WHERE Timestamp > $(vLastLoadTimestamp);

//Store data to qvd
STORE NewData INTO MyData.qvd (qvd);

//Update Last Load Timestamp
LET vLastLoadTimestamp = Max(Timestamp); //From the newly loaded data
I've also used Binary load to quickly copy the data model from one Qlik Sense app to another, which is especially useful for development, testing and deployment. This speeds up the process of replicating data structures and logic without reloading from the original data source. It can save considerable time when migrating data models between environments.
9. Describe a situation where you had to troubleshoot a complex Qlik Sense issue, and how you approached the problem.
In one instance, users reported slow performance with a Qlik Sense application visualizing sales data across multiple regions. The issue was intermittent and difficult to reproduce consistently. I started by examining the Qlik Sense Enterprise Management Console to check server resource utilization (CPU, memory, disk I/O) during the reported slow periods. That didn't reveal any immediate bottlenecks. I then enabled detailed logging within Qlik Sense to capture query execution times and data load statistics. This helped pinpoint a specific calculated dimension involving complex string manipulations that was causing significant delays.
To resolve this, I refactored the calculated dimension using more efficient Qlik Sense functions (e.g., using Match() instead of nested If() statements where appropriate) and pre-calculated parts of the dimension during the data load process using the Qlik Sense script. After these changes, the application performance improved significantly, resolving the user complaints. Finally, I documented the troubleshooting steps and the solution in our internal knowledge base.
10. How familiar are you with Qlik Sense's APIs and how have you used them in your projects?
I have experience working with Qlik Sense's APIs, primarily the Engine API and the Capability APIs. I've used the Engine API to programmatically interact with the Qlik associative engine, such as creating apps, loading data, executing scripts, and retrieving data. For example, I've automated data loading and transformation processes using Python and the qlik-engineapi library to connect to the Engine API. I've also built custom extensions using the Capability APIs, which allowed me to embed Qlik Sense visualizations and functionality into other web applications.
Specifically, I've used the Capability APIs to:
- Embed specific Qlik Sense objects (charts, tables) into external websites.
- Create mashups that combine Qlik Sense visualizations with other web components.
- Implement custom actions and interactions that extend the default Qlik Sense functionality.
For instance, I might use JavaScript and the Capability APIs to create a custom button in a web application that triggers a specific action in Qlik Sense, like applying a filter or navigating to a different sheet. I'm also familiar with the Qlik Sense Repository Service (QRS) API for administrative tasks like managing users, apps, and licenses, but my experience with it is less extensive than with the Engine and Capability APIs.
11. Discuss your experience with collaborative development in Qlik Sense, including version control and code management.
In Qlik Sense collaborative development, I've primarily used Git for version control. I've worked with branching strategies (feature branches, develop, main) to manage concurrent development efforts and ensure code stability. We used Pull Requests for code reviews, allowing team members to inspect and provide feedback before merging changes into the main branch. This helped maintain code quality and consistency. For code management specific to Qlik Sense, we implemented a shared library of custom expressions, variables, and visualizations. These were carefully documented and stored in a central repository within Git, promoting reuse and standardization across different Qlik Sense apps.
Regarding code management, we also utilized Qlik Sense's built-in capabilities for exporting and importing app objects (sheets, visualizations, measures). This facilitated the transfer of components between different apps or environments. Additionally, we maintained clear naming conventions and documentation standards for all objects to improve collaboration and understanding. While Qlik Sense doesn't have a dedicated IDE like some other development platforms, we leveraged external code editors with syntax highlighting for Qlik Sense scripting to improve readability and reduce errors.
12. Explain your understanding of Qlik Sense's data governance capabilities and how you have implemented them.
Qlik Sense offers several data governance features to ensure data quality, security, and compliance. These include:
- Data Lineage: Tracing the origin and transformation of data from source to the final visualization, enabling auditability and understanding of data flow.
- Data Catalog: Centralized repository for metadata, allowing users to easily discover and understand available data assets.
- Security Rules: Defining access control policies to restrict data and application access based on user roles and groups.
- Data Profiling: Assessing data quality, identifying anomalies, and ensuring data consistency.
- Governance Dashboard: Monitoring data governance metrics, identifying potential risks, and tracking compliance efforts.
I have implemented these features by defining security rules based on active directory groups to manage access to apps and data. I also set up data connections with proper authentication. Finally, I collaborated with data owners to document data sources and transformations to ensure data lineage. For instance, I defined section access to limit visibility to certain data fields in the app, enabling row-level security.
13. How have you used Qlik Sense to create data-driven stories and presentations for executive audiences?
I've used Qlik Sense to craft data-driven narratives for executives by focusing on clear, concise visualizations and actionable insights. I leverage Qlik Sense's storytelling features to guide the audience through the data, highlighting key trends, outliers, and correlations. For example, I built an application to track sales performance. I used color coding and KPI objects within Qlik Sense to draw immediate attention to underperforming regions and exceeded sales targets.
Specifically, I curate dashboards with specific executive needs in mind and used the snapshot functionality within Qlik Sense to capture key visualizations. I then present these snapshots in a linear presentation format, adding narrative text to explain the 'so what' behind the data, translating complex analyses into easily understandable business implications and strategic recommendations that align with overall company goals.
14. Describe your experience with different Qlik Sense deployment options (e.g., on-premise, cloud) and their considerations.
I have experience with both on-premise and cloud deployments of Qlik Sense. For on-premise deployments, I've been involved in installation, configuration, and maintenance of Qlik Sense Enterprise on Windows Server, including managing security rules, data connections, and extensions. Considerations here include hardware sizing, network configuration, security policies, and ongoing maintenance responsibilities like patching and upgrades. Cloud deployments, specifically Qlik Cloud, involved leveraging its SaaS model. My focus was on developing and deploying applications, managing data connections to cloud-based sources (e.g., Snowflake, AWS S3), and utilizing Qlik Cloud's collaboration features. Key considerations here are data residency, subscription management, and integrating with existing cloud infrastructure and security protocols.
15. How do you stay up-to-date with the latest Qlik Sense features and best practices?
I stay updated on Qlik Sense through several channels. I regularly visit the official Qlik website, particularly the 'What's New' and 'Qlik Blog' sections, to learn about new features, updates, and announcements. I also actively participate in the Qlik Community forums, where I read discussions, ask questions, and share knowledge with other users.
To deepen my understanding, I follow Qlik's official social media channels (LinkedIn, Twitter) and subscribe to relevant newsletters. Additionally, I occasionally attend Qlik webinars and training sessions when available. I also try and keep myself informed about best practices by working hands on and experimenting with the new features as they come out.
16. Explain how you handle very large datasets within Qlik Sense, including strategies for efficient data loading and processing.
When handling very large datasets in Qlik Sense, I focus on efficient data loading and processing. For data loading, I leverage incremental loads to only load new or changed data, reducing the overall load time. I also optimize the data model by using optimized QVD files (Qlik Data Files) as a storage layer, which are highly compressed and optimized for Qlik Sense. Data connections are configured to minimize the amount of data brought into Qlik Sense, filtering data at the source when possible.
For data processing, I prioritize set analysis and calculated dimensions/measures to perform aggregations and calculations within Qlik Sense, minimizing the data footprint. Utilizing binary load to share data models and master data across applications ensures consistency and reduces redundancy. Also making sure that the server has optimal configuration of RAM and CPU is paramount. To achieve this, you can perform regular health checks to ensure your system is working at optimum levels.
17. Describe a time when you had to redesign a Qlik Sense application to improve its usability or performance.
In a previous role, I redesigned a Qlik Sense application used by the sales team to track performance against targets. The initial application was slow and difficult to navigate, leading to low adoption. To improve usability, I simplified the layout, reducing the number of charts on each sheet and adding clear navigation buttons. I also implemented a filter pane for easier data selection.
For performance, I optimized the data model by removing unnecessary fields and creating calculated dimensions instead of calculated fields in the front end. I also reviewed the set analysis expressions and ensured they were efficient. After the redesign, user adoption increased significantly, and the application's load time improved by over 50%.
18. How do you approach user training and documentation for Qlik Sense applications you develop?
My approach to user training and documentation for Qlik Sense applications involves a multi-faceted strategy. First, I create comprehensive, user-friendly documentation, often using Qlik's built-in help features or external tools like Markdown editors. This documentation covers everything from basic navigation to advanced analysis techniques, ensuring users of all skill levels can understand and effectively use the application.
Second, I offer tailored training sessions, which can range from in-person workshops to online webinars. These sessions focus on practical, hands-on exercises that allow users to apply what they've learned in real-world scenarios. I always incorporate user feedback to improve future training and documentation, ensuring it remains relevant and effective. I also create short video tutorials addressing specific tasks or features. Finally, I create FAQ sections within the application or documentation that anticipate commonly asked user questions.
19. Explain your experience with Qlik Sense's mobile capabilities and how you optimize applications for mobile devices.
I have experience developing and optimizing Qlik Sense applications for mobile devices, ensuring a seamless user experience on smaller screens. I've worked with responsive design techniques within Qlik Sense, leveraging the platform's built-in capabilities to automatically adjust layouts and visualizations based on screen size. This includes utilizing container objects effectively, choosing appropriate chart types optimized for mobile viewing (e.g., simplified bar charts or KPIs), and minimizing the use of overly complex or data-heavy objects that can slow down performance.
Specifically, I focus on optimizing the data model for mobile performance. This means reducing the amount of data loaded unnecessarily and using optimized aggregations. I also pay close attention to network performance by enabling compression and caching mechanisms within Qlik Sense. Additionally, I've tested applications extensively on various mobile devices and browsers to ensure compatibility and identify any potential performance bottlenecks, and I've used Qlik Sense's mobile app for native device features like touch gestures.
20. Describe a situation where you had to work with a complex data model in Qlik Sense, and how you simplified it for end-users.
In a previous role, I worked with a large retailer whose Qlik Sense app tracked sales across multiple channels and product categories. The initial data model was highly complex, involving numerous tables joined on several fields. This made it difficult for business users to create their own analyses and reports. To simplify it, I created a star schema by consolidating granular transaction data into a central fact table. Dimension tables were created to represent product categories, sales channels, customer segments, and time periods. I used Qlik Sense's data modeling features to define clear associations between the fact and dimension tables, making the data relationships more intuitive.
Furthermore, I created calculated dimensions and measures with user-friendly names. For example, instead of 'Sum(SalesAmount)', I created a measure called 'Total Sales'. I also hid unnecessary fields and created bookmark templates for frequently used analyses. This approach significantly improved the usability of the app, enabling business users to quickly generate reports and gain insights without needing to understand the underlying data model's intricacies.
21. How have you leveraged Qlik Sense's advanced analytics features, such as clustering or forecasting, in your projects?
In a recent project focused on sales performance analysis, I leveraged Qlik Sense's clustering feature to segment our customer base. Specifically, I used the K-means clustering algorithm within Qlik to group customers based on purchasing behavior, demographics, and sales volume. This allowed us to identify distinct customer segments with unique needs and preferences, leading to more targeted marketing campaigns and improved customer retention. I used the resulting cluster IDs in various dashboards to filter and compare performance across different groups, revealing actionable insights. Also, to forecast future sales, I utilized Qlik Sense's built-in linear regression forecasting capabilities. After cleaning and preparing the historical sales data, I applied the Linearmodel() function and created a chart showcasing the predicted sales figures. This helped the sales team anticipate future trends and adjust strategies proactively. I also experimented with more advanced forecasting techniques available through Qlik Sense's extensions, like ARIMA models, to improve the accuracy of predictions.
22. Explain your understanding of Qlik Sense's associative engine and how it impacts data discovery and analysis.
Qlik Sense's associative engine is the core technology that allows users to explore data freely without predefined hierarchies or query constraints. Unlike traditional BI tools that rely on SQL queries, Qlik Sense indexes all data points and their relationships. When a user makes a selection, the engine instantly highlights related and unrelated data points. This impacts data discovery by revealing hidden connections and insights that might be missed using query-based tools.
This functionality dramatically enhances analysis by allowing users to explore data non-linearly, uncovering surprising relationships and identifying anomalies. Since the associative engine highlights what is and is not related, it facilitates a more complete understanding of the data, leading to better-informed decisions.
23. Describe your experience with Qlik Sense Mashups and when you would choose to implement one.
My experience with Qlik Sense Mashups involves integrating Qlik Sense visualizations and data into custom web applications to create tailored user experiences. I've used them to embed Qlik Sense charts within existing portals, develop focused analytical dashboards for specific user groups, and build interactive reporting interfaces with enhanced functionality beyond standard Qlik Sense features.
I would choose to implement a Qlik Sense Mashup when I need to:
- Extend Qlik Sense Functionality: Add custom controls, workflows, or actions not natively available in Qlik Sense.
- Embed Analytics: Seamlessly integrate Qlik Sense visualizations into existing websites or applications.
- Customize User Experience: Create a highly tailored and branded analytical experience for specific user roles or tasks. For example, building a custom portal focused on a specific business process and embedding relevant Qlik Sense analytics into it. This often involves using the Capability APIs to control the Qlik Sense engine and retrieve data for custom visualizations built using libraries like D3.js or Chart.js.
24. How do you ensure accessibility compliance in Qlik Sense applications, making them usable for people with disabilities?
To ensure accessibility compliance in Qlik Sense applications, follow these guidelines. Utilize Qlik Sense's built-in accessibility features such as keyboard navigation, screen reader compatibility (ARIA attributes), and contrast settings. Provide alternative text for images and ensure meaningful labels for all interactive elements. Thoroughly test applications with screen readers (like NVDA or JAWS) and keyboard-only navigation to identify and rectify any usability issues. Adhere to WCAG (Web Content Accessibility Guidelines) standards, typically aiming for WCAG 2.1 Level AA compliance. Regularly audit the application for accessibility issues and address them promptly.
Consider using color palettes that provide sufficient contrast for users with visual impairments. Ensure that all interactive elements have a clear focus indicator when navigated using the keyboard. Provide mechanisms to bypass repetitive content, such as skip links, to improve navigation for screen reader users. Also consider providing text alternatives for complex visualizations where possible.
Qlik Sense MCQ
Question 1.
Which of the following chart types is most suitable for visualizing sales performance across different geographical regions in Qlik Sense?
Options:
Options:
Question 2.
Which of the following methods is the correct way to define and assign a value to a variable named 'vSalesTarget' with a value of 1000 in Qlik Sense?
Options:
Question 3.
Which of the following statements BEST describes the primary function of the AGGR function in Qlik Sense?
Options:
Options:
Question 4.
You need to calculate total sales while excluding sales of 'Product X'. Which of the following set analysis expressions would correctly achieve this in Qlik Sense?
Options:
Options:
Question 5.
Which of the following is the most efficient way to allow a user to filter a Qlik Sense dashboard based on multiple selections from a list of product categories?
Options:
Question 6.
Which function is most suitable for calculating a 3-month moving average of sales in Qlik Sense?
Options:
Question 7.
How can you calculate the percentage of total sales for each product category in Qlik Sense?
Options:
Question 8.
Which of the following methods is most commonly used to implement row-level security and data reduction based on user access in Qlik Sense?
Options:
Question 9.
What is the primary purpose of the Master Calendar in Qlik Sense?
Options:
Question 10.
What is the primary purpose of the 'Keep Only' filter option when making selections in Qlik Sense?
Options:
Question 11.
What is the primary effect of reloading data in a Qlik Sense application?
Options:
Question 12.
What is the primary purpose of the Dual() function in Qlik Sense?
Options:
Options:
Question 13.
What is the primary purpose of creating a 'Story' in Qlik Sense?
Options:
Question 14.
What is the primary difference between an incremental load and a full load in Qlik Sense?
Options:
Question 15.
Which of the following methods is commonly used to connect Qlik Sense to an external data source, such as a database?
Options:
Question 16.
What is the primary purpose of the ApplyBookmark() function in Qlik Sense?
Options:
Question 17.
In Qlik Sense, what is the key difference between using a 'Join' and creating a 'Link Table' when combining data from multiple tables?
Options:
Options:
Question 18.
What is the primary method for creating calculated fields within a Qlik Sense application?
Options:
Question 19.
What is the primary purpose of Section Access in Qlik Sense?
Options:
Options:
Question 20.
In Qlik Sense, what is the main function of the '$' sign when used within an expression?
Options:
Question 21.
What is the primary function of the Match() function in Qlik Sense?
Options:
Question 22.
What is the primary difference between a 'Concatenate' and a 'Join' operation when loading data in Qlik Sense?
Options:
Options:
Question 23.
What is a synthetic key in Qlik Sense, and what does it typically indicate?
Options:
Question 24.
What is the primary purpose of the GetFieldSelections() function in Qlik Sense?
Options:
Question 25.
In Qlik Sense, what is the primary benefit of using association between tables instead of explicitly joining them?
Options:
Which Qlik Sense skills should you evaluate during the interview phase?
While a single interview can't reveal everything about a candidate, focusing on key skills ensures you find a Qlik Sense expert. These skills are the core building blocks for successful Qlik Sense development and implementation. Identifying these skills early streamlines your hiring process.
Data Modeling
An assessment test can easily filter candidates on their understanding of various data modeling concepts. Adaface's Data Modeling assessment includes relevant MCQs to help you identify strong candidates.
To gauge their data modeling skills, ask targeted questions about their experience. The following question can reveal their approach to data structure and relationships.
Describe a time when you had to optimize a complex data model in Qlik Sense. What challenges did you face, and how did you overcome them?
Look for candidates who can clearly articulate their understanding of data relationships and how they optimized the model. Bonus points if they mention specific Qlik Sense features used for optimization.
Qlik Sense Scripting
A Qlik Sense assessment is the most direct way to evaluate scripting skills. Adaface's Qlik Sense test assesses knowledge of data loading, transformations, and other scripting best practices.
Asking questions about their experience with Qlik Sense scripting can also be helpful. Here's a question to probe their scripting expertise:
Explain the difference between a 'Load' statement and a 'Select' statement in Qlik Sense scripting. When would you use each one?
The candidate should be able to articulate the purpose of each statement and the scenarios where each is most suitable. Look for a clear understanding of how these statements interact with data sources.
Data Visualization
You can use skill tests to easily filter candidates on their visualization aptitude. Adaface's Tableau assessment contains questions on best practices in chart selection and dashboard design, which are all relevant to Qlik Sense visualization.
Targeted interview questions can reveal how a candidate approaches data visualization challenges. Here is one example:
Describe a project where you had to present complex data in a simple and intuitive way using Qlik Sense. What type of charts did you choose, and why?
The candidate should demonstrate an understanding of chart selection based on the data type and intended audience. They should also be able to explain the rationale behind their design choices.
3 Tips for Using Qlik Sense Interview Questions
Before you put these Qlik Sense interview questions to use, here are a few tips to help you conduct more effective interviews. These suggestions will maximize your ability to assess candidates and make informed hiring decisions.
1. Leverage Skills Assessments Before Interviews
Skills assessments provide an objective measure of a candidate's abilities, allowing you to screen candidates and focus your interview time on the most promising individuals. By identifying skill gaps early, you can tailor your interview questions to explore specific areas of concern or strength.
Consider using a Qlik Sense test to evaluate candidates' practical skills. You may also want to consider a more general business intelligence analyst test to evaluate data skills and knowledge. Skills tests are great at objectively qualifying or disqualifying candidates. Other assessments that can be helpful include data analysis tests, SQL online tests, and Excel tests.
By integrating skills assessments into your hiring process, you streamline candidate screening, reduce time-to-hire, and improve the quality of your hires. Use the results to discuss how they approached a question and understand their thought process during the interview.
2. Outline Targeted Interview Questions
Time is valuable during interviews, so preparing a focused set of questions can ensure you evaluate candidates on the most important aspects of Qlik Sense. Prioritize questions that uncover practical experience, problem-solving abilities, and a deeper understanding of the platform's capabilities.
Expand your question pool with other related areas. Consider exploring topics covered in our interview questions for SQL or data analysis as Qlik Sense proficiency often relies on these.
A well-structured interview, with targeted questions, increases your chances of identifying candidates who possess the blend of technical skill and analytical thought necessary for the role.
3. Ask Follow-Up Questions to Uncover Depth
Simply asking a question from a list isn't enough. To really gauge a candidate's expertise, asking relevant follow-up questions is key. This helps uncover candidates who may be able to recite definitions but lack actual practical knowledge or experience.
For example, if you ask, "Explain the difference between a 'Set Analysis' and a 'Bookmark' in Qlik Sense," a good follow-up would be, "Describe a situation where you would choose to use a Set Analysis over a Bookmark, and why?" This helps assess the depth of their understanding.
Evaluate Qlik Sense Skills Accurately and Hire Top Talent
When hiring for Qlik Sense roles, verifying candidates' skills is paramount. Using skills tests is the most accurate way to assess their abilities. Consider using a dedicated Qlik Sense Test from Adaface to evaluate candidates objectively.
Once you've identified top candidates using skills tests, streamline your interview process. You can then focus on cultural fit and in-depth discussions. Sign up for a free trial on our assessment platform to get started.
Qlik Sense Online Test
35 mins | 12 MCQs
The Qlik Sense Online Test uses scenario-based MCQs to evaluate candidates on their knowledge of Qlik Sense, including their proficiency in working with data modeling, scripting, data visualization, and data analysis. The test aims to evaluate a candidate's ability to work with Qlik Sense effectively and design and develop applications that meet business requirements and provide actionable insights.
Try Qlik Sense Online Test
Download Qlik Sense interview questions template in multiple formats
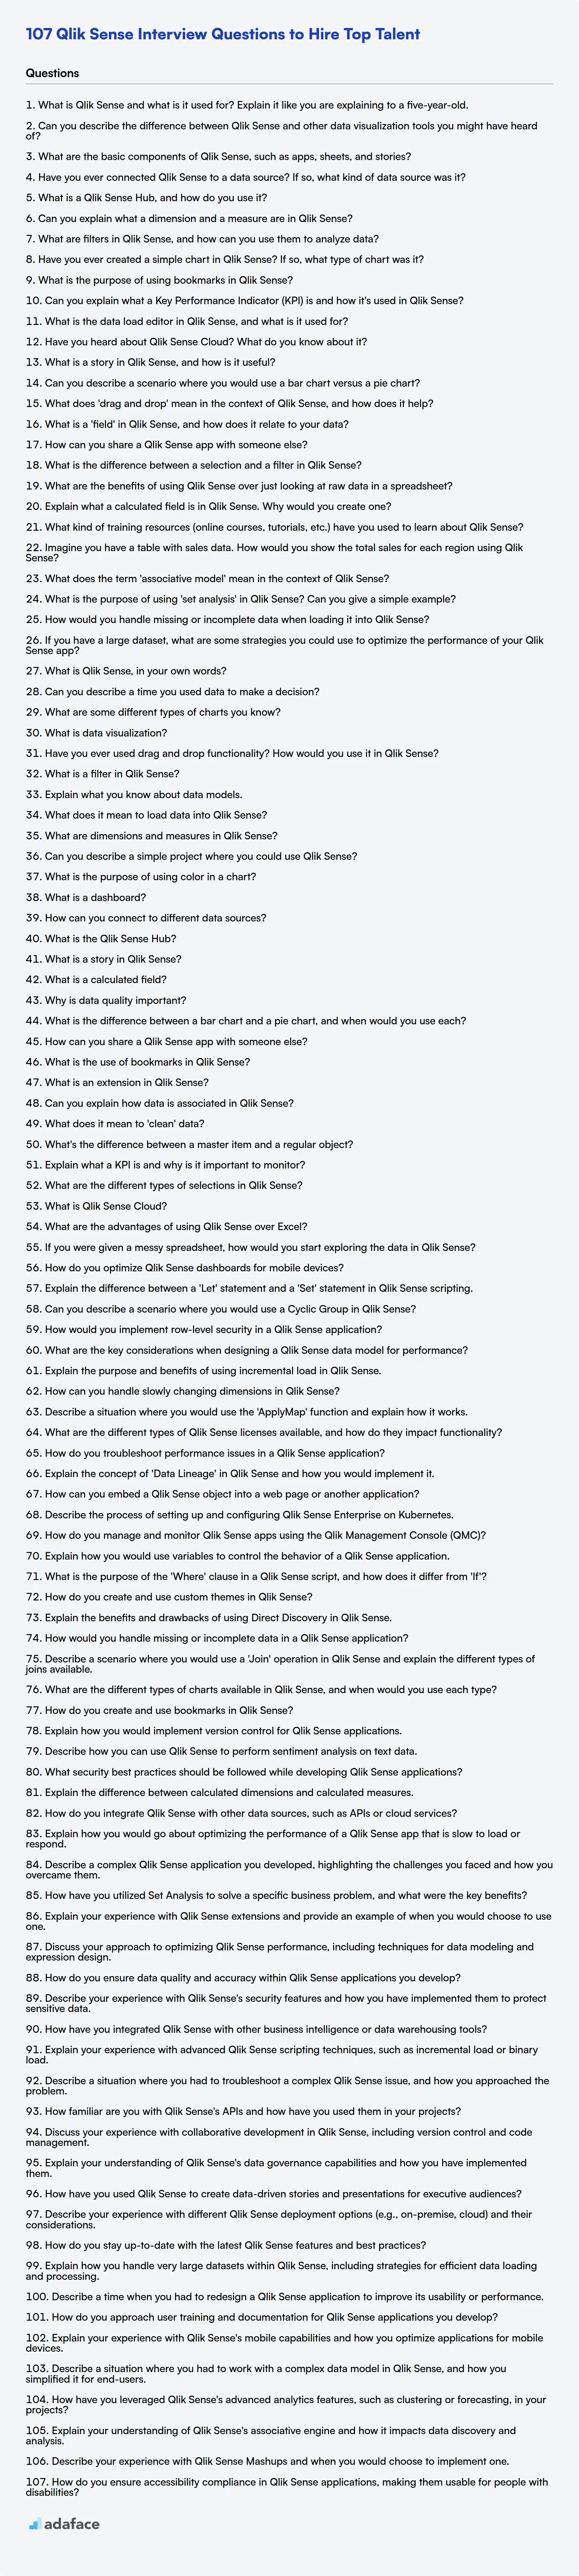
Qlik Sense Interview Questions FAQs
What are some good Qlik Sense interview questions for freshers?
When interviewing freshers for Qlik Sense roles, focus on questions that assess their understanding of basic concepts, data visualization principles, and their eagerness to learn. Questions about Qlik Sense's architecture, basic scripting, and simple data loading techniques are a good start.
How can I assess intermediate Qlik Sense skills during an interview?
For intermediate-level candidates, go beyond the basics. Ask about their experience with advanced scripting, complex data modeling, performance optimization, and security aspects within Qlik Sense. Scenario-based questions can reveal their problem-solving abilities.
What should I ask experienced Qlik Sense candidates?
Experienced candidates should be able to discuss their experience with enterprise-level deployments, governance, and advanced analytics techniques. Probe their knowledge of Qlik Sense extensions, integration with other systems, and leadership in projects.
How can I prepare for a Qlik Sense interview?
Start by reviewing the core concepts of Qlik Sense, including data modeling, scripting, and visualization. Practice answering common interview questions and be prepared to discuss your previous projects and experiences with Qlik Sense.
What are some common mistakes to avoid when interviewing Qlik Sense candidates?
Avoid overly technical questions that don't relate to practical application. Focus on assessing problem-solving skills and understanding of business requirements. Don't neglect the importance of communication and teamwork skills.
Why is it important to use well-structured interview questions?
Structured interview questions help ensure that you are evaluating candidates fairly and consistently. They also allow you to gather comparable data across candidates, making it easier to identify the best fit for your team.
40 min skill tests.
No trick questions.
Accurate shortlisting.
We make it easy for you to find the best candidates in your pipeline with a 40 min skills test.
Try for freeRelated posts
Free resources

Join 1200+ companies in 80+ countries.
Try the most candidate friendly skills assessment tool today.

40 min tests.
No trick questions.
Accurate shortlisting.
No trick questions.
Accurate shortlisting.