
Math Skills interview questions for freshers
1. Imagine you're dividing a pizza among friends. How do you make sure everyone gets a fair share, even if some friends arrive late?
2. If you had to explain what an average is to a younger sibling, how would you do it?
3. Let's say you're baking cookies and need to double the recipe. How would you figure out how much of each ingredient you need?
4. You have a ruler, and you need to measure the length of a table, but the ruler is shorter than the table. How do you solve this?
5. What strategies do you use to estimate calculations quickly in your head?
6. Describe a situation where understanding percentages helped you make a good decision.
7. If you were explaining fractions to someone who's never seen them, what real-world example would you use?
8. How do you approach solving a word problem that seems confusing at first?
9. Explain how you would calculate the area of a room if you only had a measuring tape.
10. Can you describe a time when you used math outside of school or work? What did you calculate and why?
11. Let's say you're planning a trip. How would you calculate the total cost, considering gas, food, and accommodation?
12. How comfortable are you with reading and interpreting graphs and charts? Can you give an example?
13. Imagine you're comparing two different phone plans. One offers more data but costs more. How do you decide which is the better deal?
14. If you were managing a project with a deadline, how would you use math to track your progress and ensure you finish on time?
15. Describe your understanding of basic geometric shapes and their properties.
16. Have you ever used spreadsheets to organize or analyze data? What kind of calculations did you perform?
17. What is your strategy for checking your work to ensure accuracy in calculations?
18. Suppose you need to divide a large task into smaller, manageable parts. How would you allocate time to each part, ensuring efficient use of resources?
19. How do you approach learning new mathematical concepts or formulas?
20. Have you ever identified and corrected an error in a mathematical calculation? What was your process?
21. Explain the concept of ratio and proportion with a real-world example.
22. How do you stay updated with new trends and technologies related to data analysis and mathematical tools?
23. Imagine you are tasked with optimizing a delivery route for a company. What mathematical concepts would you use to find the most efficient path?
Math Skills interview questions for juniors
1. Imagine you have a pizza cut into 8 slices, and you eat 3. How many slices are left?
2. If you have 10 cookies and want to share them equally with 2 friends, how many cookies does each person get?
3. What comes next in this pattern: circle, square, circle, square, ?
4. You have 5 toy cars and your friend gives you 2 more. How many toy cars do you have now?
5. If a candy bar costs $1 and you pay with $5, how much change do you get back?
6. How many sides does a triangle have?
7. If it's 2:00 PM now, what time will it be in 3 hours?
8. What is bigger: 10 or 20?
9. You have 4 red blocks and 4 blue blocks. How many blocks do you have in total?
10. If you are number 3 in line, how many people are in front of you?
11. A square has all sides equal. if one side is 5 what is the measurement of all the sides?
12. If a movie starts at 7:00 PM and is 1 hour and 30 minutes long, what time will it end?
13. You want to buy a toy that costs $7, but you only have $3. How much more money do you need?
14. If today is Wednesday, what day was yesterday?
15. What is smaller: 5 or 8?
16. You have 6 balloons and 2 pop. How many balloons are left?
17. If you share 9 marbles equally between 3 people, how many marbles does each person get?
18. What shape has no sides?
19. If you have 2 groups of 5 stickers, how many stickers do you have altogether?
20. You are 6 years old and your sister is 2 years older. How old is your sister?
21. If you have one dozen eggs, how many eggs do you have?
22. A rectangle has two sides 2 and two sides 4. What do you get when you add all the sides?
23. If each pack has 4 pencils. How many pencils are there in 5 such packs?
24. If you are given a dollar each day for a week, how many dollars would you have?
25. You start with 14 apples and give away half of them. How many apples are left?
26. Which number is halfway between 1 and 5?
Math Skills intermediate interview questions
1. Explain how to calculate the area of a triangle. Why is this important in real-world applications?
2. What is the Pythagorean theorem, and how can it be used to solve real-world problems? Provide an example.
3. Describe the concept of percentages and how they are used in everyday calculations, like discounts or interest rates.
4. How do you convert between fractions, decimals, and percentages? Why is this skill useful?
5. What are ratios and proportions, and how can they be used to solve problems involving scaling or comparisons?
6. Explain the order of operations (PEMDAS/BODMAS) and why it's essential for solving mathematical expressions correctly.
7. Describe the concept of variables and how they are used in algebraic equations. Give a simple example.
8. How do you solve a simple linear equation with one variable? Walk through the steps.
9. Explain what a graph is and how it can be used to represent data or relationships between variables.
10. What is the difference between mean, median, and mode? How do you calculate each one, and when is each measure most appropriate?
11. Describe the concept of probability and how it is calculated. Provide an example of a real-world situation where probability is used.
12. How do you calculate simple interest? What factors affect the amount of interest earned or paid?
13. Explain the concept of exponents and how they are used to represent repeated multiplication. Give an example.
14. What are geometric shapes, and how do you calculate their perimeter and area? Focus on squares, rectangles, and circles.
15. Describe the concept of estimation and how it can be used to quickly approximate answers in real-world situations. Why is estimation important?
16. How do you read and interpret data presented in a table or chart? What information can be gleaned from these representations?
17. Explain the concept of unit conversion and how to convert between different units of measurement, such as inches to centimeters or pounds to kilograms.
18. What are the different types of angles (acute, obtuse, right, straight), and how are they measured?
19. Describe the concept of prime numbers and how to identify them. Why are prime numbers important in mathematics?
20. How can math be applied to project management to estimate timelines, resources, and budgets? Give a basic overview.
21. Explain scaling of recipes. If a recipe serves 4 people and you need to serve 10, how do you adjust ingredient amounts?
Math Skills interview questions for experienced
1. Describe a time you used advanced statistical modeling to solve a business problem. What were the challenges, and how did you overcome them?
2. Explain a situation where your understanding of calculus or differential equations significantly impacted a project's outcome. What was the situation and what was the impact?
3. Walk me through a complex data analysis project where you had to justify your methodological choices to stakeholders with limited mathematical backgrounds. How did you communicate your approach?
4. How do you approach optimizing complex algorithms or processes using mathematical principles? Give a specific example.
5. Explain a time when you had to estimate the probability of an event with limited data. What methods did you use, and how did you validate your results?
6. Describe a scenario where you had to build a predictive model from scratch. What factors did you consider, and how did you assess its accuracy?
7. Tell me about a project where you applied game theory principles to solve a strategic problem. What was the outcome?
8. Discuss a situation where you had to deal with a large dataset that required sophisticated mathematical techniques to extract meaningful insights. What tools and techniques did you use?
9. Explain how you use mathematical modeling to forecast future trends or outcomes. Provide a real-world example.
10. Describe a situation where your mathematical skills helped you identify and correct a significant error in a financial or operational model.
11. How do you stay current with the latest advancements in mathematical modeling and data analysis techniques?
12. Walk me through a time you had to explain a complex mathematical concept to a non-technical audience. How did you ensure they understood the key takeaways?
13. Describe a time when you used your knowledge of linear algebra to optimize a process or system. What specific techniques did you employ?
14. Explain a situation where your understanding of stochastic processes proved valuable in a project. What problem did it solve?
15. How do you approach validating the assumptions underlying a mathematical model? Give an example.
16. Describe a project where you used mathematical optimization techniques to improve efficiency or reduce costs. What were the results?
17. Tell me about a time you had to adapt a mathematical model to account for unexpected changes or new information. How did you handle the situation?
18. Explain how you would use Bayesian statistics to solve a problem in your previous role. Provide a specific example.
19. Describe a time you used graph theory to solve a real-world problem. What was the problem, and how did you apply graph theory concepts?
20. How do you handle uncertainty and risk in your mathematical models? What techniques do you use to quantify and mitigate these factors?
21. Describe a time you were faced with a problem that required you to learn a new mathematical concept or technique quickly. How did you approach the learning process?
22. How do you ensure the accuracy and reliability of your mathematical calculations and models, especially when dealing with large datasets or complex algorithms?
23. Explain a time when your mathematical skills helped you identify a fraudulent or suspicious activity. What were the indicators, and how did you investigate?

Math skills are important across many job roles. Like assessing soft skills or even writing skills, hiring managers must vet candidates for numeracy.
This blog post offers a bank of math interview questions, categorized by experience level, from fresher to experienced, and includes multiple-choice questions (MCQs). We have questions covering business math, financial accounting and quantitative aptitude.
By using these questions, you can better assess candidates' math abilities and identify the right talent for your team; to make the process smoother, consider using Adaface's business math test to screen candidates before interviews.
Table of contents
Math Skills interview questions for freshers
Math Skills interview questions for juniors
Math Skills intermediate interview questions
Math Skills interview questions for experienced
Math Skills MCQ
Which Math Skills skills should you evaluate during the interview phase?
3 Tips for Effectively Using Math Skills Interview Questions
Hire Top Talent with Math Skills Assessments
Download Math Skills interview questions template in multiple formats
Math Skills interview questions for freshers
1. Imagine you're dividing a pizza among friends. How do you make sure everyone gets a fair share, even if some friends arrive late?
The key is to cut the pizza into equal slices from the start, based on the maximum number of potential attendees. As latecomers arrive, you can adjust by cutting existing slices in half to create more. Communication is crucial: check with everyone beforehand to get a good headcount estimate. If some people are particularly hungry, you might consider a slightly larger slice for them initially, but be transparent about it to maintain fairness.
Another approach, especially if you know people will be late, is to initially serve only a portion of the pizza. Then, when the latecomers arrive, serve the remaining portion, again divided equally among everyone present at that time. This ensures the early arrivals don't eat more than their share proportionally.
2. If you had to explain what an average is to a younger sibling, how would you do it?
Imagine you and your friends are collecting candy. Let's say you have 2 candies, your friend has 4, and another has 6. To find the average, we want to know how many candies each of you would have if you shared them equally. To do this we add up all the candies (2 + 4 + 6 = 12) and then divide by the number of people (3). So, 12 / 3 = 4. That means the average is 4 candies per person.
Basically, an average is a way of finding a 'typical' or 'middle' value in a set of numbers. We add up all the numbers in the set and then divide by how many numbers there are. It helps us see what's common or normal.
3. Let's say you're baking cookies and need to double the recipe. How would you figure out how much of each ingredient you need?
To double a recipe, you multiply the quantity of each ingredient by 2. For example, if the original recipe calls for 1 cup of flour, you would need 2 cups of flour. If it calls for 1/2 teaspoon of baking soda, you'd need 1 teaspoon.
Essentially, you take the original amount and multiply it by two: New Amount = Original Amount * 2. Double-check your units to ensure they make sense after doubling (e.g., doubling teaspoons to tablespoons if the number is large enough might be better).
4. You have a ruler, and you need to measure the length of a table, but the ruler is shorter than the table. How do you solve this?
Place the ruler on one end of the table and mark the end of the ruler's length on the table. Then, move the ruler so that one end aligns with the mark you just made. Repeat this process, counting how many times you move the ruler. Finally, measure the remaining length (if any) that is shorter than the ruler. The total length of the table is the number of times you moved the ruler multiplied by the ruler's length, plus the length of the remaining portion.
For example, if the ruler is 30cm long, and you moved it 5 times with 15cm remaining, the table length is (5 * 30cm) + 15cm = 165cm.
5. What strategies do you use to estimate calculations quickly in your head?
When estimating calculations mentally, I often use rounding to simplify numbers. For example, if I need to calculate 17 * 23, I might round it to 20 * 20, getting 400 as a rough estimate. Then, I can adjust based on how much I rounded. I also break down complex problems into smaller, more manageable steps.
Another strategy is using compatible numbers. If dividing 157 by 8, I might think of 160 divided by 8, which is 20, as an approximation. I also use mental landmarks (like percentages) to make quick estimations; for example, 25% is easy to calculate. Remembering common mathematical facts and formulas is also essential for rapid calculation.
6. Describe a situation where understanding percentages helped you make a good decision.
I was choosing between two investment options for my retirement account. Option A had a slightly higher average return (7%) but also higher fees (1.5%). Option B had a lower average return (6%) but significantly lower fees (0.25%).
By calculating the net return (return minus fees) as a percentage of the initial investment, I realized that Option B, despite the lower headline return, would actually yield a higher net return over the long term due to the substantially lower fees. This understanding of percentage-based calculations allowed me to make a more informed and ultimately more profitable investment decision.
7. If you were explaining fractions to someone who's never seen them, what real-world example would you use?
I'd use a pizza as a real-world example. Imagine you have a whole pizza. That's one whole. If you cut it into 8 equal slices, each slice is 1/8 (one-eighth) of the pizza. If you eat two slices, you've eaten 2/8 (two-eighths) of the pizza. This shows how a fraction represents a part of a whole and helps visualize the numerator (the number of parts you have) and the denominator (the total number of equal parts the whole is divided into).
8. How do you approach solving a word problem that seems confusing at first?
When faced with a confusing word problem, I first try to understand the core question and what's being asked of me. I'll read the problem multiple times, actively looking for keywords and relationships between the given information. A key step is to break the problem down into smaller, more manageable parts. I might rewrite the problem in my own words or draw a diagram to visualize the information. Identifying the knowns, unknowns, and any constraints is also a crucial part of this process.
Next, I'd consider potential approaches. This might involve thinking about similar problems I've solved before, or different problem-solving strategies like working backwards or using trial and error. For a quantitative problem, I'd focus on identifying relevant formulas or equations. Once I have a possible solution, I'd always verify that it logically makes sense within the context of the original problem and that my units are correct.
9. Explain how you would calculate the area of a room if you only had a measuring tape.
To calculate the area of a room with only a measuring tape, I would first determine the shape of the room. If it's a rectangle or square, I'd measure the length and width. The area is then simply length multiplied by width (Area = L * W). If the room is an irregular shape, I would divide it into smaller, more regular shapes like rectangles or triangles. I'd measure the necessary dimensions of each of these smaller shapes (lengths, widths, base, height). Then, I'd calculate the area of each smaller shape and sum them up to get the total area of the room. For a triangle, the area is 0.5 * base * height. Using these methods, you can approximate the room's area with reasonable accuracy.
10. Can you describe a time when you used math outside of school or work? What did you calculate and why?
I once used math to optimize my home garden layout. I wanted to maximize the sunlight each plant received and also efficiently utilize the available space. I calculated the angles of the sun at different times of the year using trigonometry (specifically sine and cosine functions) to determine the optimal row spacing and plant heights to minimize shading. I also calculated the area of my garden beds to determine the optimal number of plants I could grow based on recommended spacing guidelines for each vegetable.
This allowed me to increase my yield significantly compared to my previous haphazard planting approach. I also used basic arithmetic to calculate the amount of fertilizer and water needed for each plant type based on their individual needs, ensuring healthy growth without over or under-supplying resources.
11. Let's say you're planning a trip. How would you calculate the total cost, considering gas, food, and accommodation?
To calculate the total trip cost, I'd break it down into components and estimate each: Gas cost involves calculating the total distance, dividing by the vehicle's MPG (miles per gallon), and multiplying by the average gas price per gallon. Food costs can be estimated by considering the number of meals, the number of travelers, and an average cost per meal, perhaps factoring in restaurant meals versus groceries. Accommodation costs depend on the number of nights and the average cost per night for the chosen accommodation (hotel, Airbnb, etc.).
Finally, sum the estimated gas cost, total food cost, and total accommodation cost to get the total estimated trip cost. I'd also add a buffer for unexpected expenses, say 10-15% of the total estimated cost.
12. How comfortable are you with reading and interpreting graphs and charts? Can you give an example?
I'm very comfortable with reading and interpreting graphs and charts. I've frequently used them to understand data trends, identify outliers, and draw meaningful conclusions in various projects. I'm familiar with various chart types including line graphs, bar charts, pie charts, scatter plots, and histograms.
For example, I once used a line graph to analyze website traffic over a period of six months. I was able to identify peak traffic days, correlate traffic spikes with marketing campaigns, and ultimately, provide recommendations to optimize the campaign schedule for better results. Specifically, the graph showed a clear correlation between email blasts and website visits, so we adjusted sending times to maximize impact.
13. Imagine you're comparing two different phone plans. One offers more data but costs more. How do you decide which is the better deal?
To decide which phone plan is the better deal, I would first estimate my average monthly data usage. Then, I'd compare the total cost of each plan, including monthly fees, taxes, and any potential overage charges based on my estimated usage. I'd also consider if any plan offers features I value, such as international calls or hotspot capabilities, and weigh the value of these features against the price difference.
Ultimately, the 'better' deal depends on individual needs and priorities. If I consistently use very little data, paying extra for a larger data allowance wouldn't be worth it. Conversely, if I frequently exceed a smaller data allowance and incur significant overage charges, the more expensive plan with more data might be more cost-effective in the long run. Also consider contract length - if there are penalties for early termination.
14. If you were managing a project with a deadline, how would you use math to track your progress and ensure you finish on time?
To track project progress and ensure on-time completion, I'd use math in several ways. First, I'd break down the project into smaller tasks and estimate the time (in hours or days) required for each. Then, I'd use basic arithmetic to calculate the total estimated time for the entire project. To track progress, I'd monitor the actual time spent on each task and compare it to the estimated time. I'd calculate the percentage of work completed by dividing the actual time spent by the total estimated time, and compare that to the percentage of the deadline that has passed. If the percentage of work completed is consistently lower than the percentage of the deadline passed, it indicates that the project is behind schedule. I can then adjust resources, prioritize tasks, or re-evaluate estimates to get back on track. Using simple formulas, like Estimated Time to Completion = Remaining Work / Current Rate of Progress, would help forecast completion and take corrective actions proactively.
15. Describe your understanding of basic geometric shapes and their properties.
My understanding of basic geometric shapes includes recognizing fundamental forms like circles, squares, triangles, and rectangles. A circle is defined by its radius and has properties like circumference and area calculated using pi. Squares have four equal sides and right angles; area is side squared. Triangles, defined by three sides and angles, can be classified as equilateral, isosceles, or scalene, and area is typically 1/2 * base * height. Rectangles also have right angles, with area calculated as length * width. Key properties include area, perimeter (or circumference), angles, and side lengths, all governed by basic geometric principles.
16. Have you ever used spreadsheets to organize or analyze data? What kind of calculations did you perform?
Yes, I have extensive experience using spreadsheets like Google Sheets and Microsoft Excel to organize and analyze data. I've used them for a variety of purposes, including tracking project progress, managing budgets, and analyzing sales data.
Specifically, I've performed calculations such as: calculating sums and averages, creating pivot tables to summarize data, using VLOOKUP and INDEX/MATCH functions for data retrieval, applying conditional formatting to highlight key trends, and building charts and graphs for data visualization. I also used more advanced formulas like IF, AND, OR for logical comparisons.
17. What is your strategy for checking your work to ensure accuracy in calculations?
My strategy for ensuring accuracy in calculations involves several steps. First, I always double-check the input data to confirm its correctness. Then, I review the formulas or algorithms used to make sure they are appropriate for the situation and correctly implemented. During the calculation process, I pay close attention to units and significant figures to avoid errors.
Finally, after completing the calculations, I perform a sanity check by comparing the results to expected values or using alternative methods to verify the outcome. For example, I might use estimation techniques or reverse-engineer the calculation to see if the final answer aligns with initial assumptions. If applicable, I use automated tools or software with built-in error detection to further validate the results. I also document each step of the process, along with all assumptions and justifications, to ensure traceability and reproducibility.
18. Suppose you need to divide a large task into smaller, manageable parts. How would you allocate time to each part, ensuring efficient use of resources?
I would start by breaking down the large task into smaller, well-defined sub-tasks. Then, I'd estimate the time and resources required for each sub-task, considering factors like complexity, dependencies, and potential risks. I might use techniques like story pointing or analogous estimating. I would allocate time proportionally to complexity, while focusing on shorter time boxes/iterations for faster feedback.
To ensure efficient use of resources, I would prioritize tasks based on their criticality and dependencies, and create a schedule that optimizes resource utilization. For example, if sub-task A depends on sub-task B, B would be scheduled earlier. I'd also monitor progress regularly and adjust the schedule as needed based on actual performance and any unexpected issues. Using tools like Kanban boards or project management software could help track progress, manage dependencies, and identify bottlenecks. Resource allocation can be optimized by identifying resource over-allocation (e.g. too many people allocated to one task) or under-allocation (not enough resources on a critical task).
19. How do you approach learning new mathematical concepts or formulas?
I approach learning new mathematical concepts or formulas by first understanding the underlying principles and intuition behind them. I don't just memorize formulas; I try to grasp why they work and where they come from. I start with basic definitions and examples, building up to more complex applications.
My learning process typically involves: 1. Reviewing prerequisite knowledge. 2. Reading textbooks, research papers, or online resources (Khan Academy, MIT OpenCourseware, etc.). 3. Working through examples and exercises, starting with simpler ones and gradually increasing the difficulty. 4. Visualizing the concepts using graphs, diagrams, or simulations where possible. 5. Actively seeking clarification when I encounter difficulties, either by asking colleagues/professors or searching online forums. 6. Applying the learned concepts to solve practical problems or implement them in code if applicable. Finally, I consolidate my understanding by summarizing the key concepts and formulas in my own words.
20. Have you ever identified and corrected an error in a mathematical calculation? What was your process?
Yes, I have identified and corrected errors in mathematical calculations. For example, while working on a project involving statistical analysis of sales data, I noticed inconsistencies in the reported conversion rates. My process began with verifying the data sources used in the calculation. Then, I meticulously reviewed the formula being used to calculate the conversion rate, comparing it to the standard formula. I found that a division error was introduced during a variable update. The incorrect variable was being used as the divisor, resulting in inaccurate conversion rates. After identifying the error, I corrected the variable and re-ran the calculation, ensuring that the updated conversion rates aligned with expectations and other related metrics. I also implemented unit tests to prevent similar issues in the future.
21. Explain the concept of ratio and proportion with a real-world example.
Ratio expresses the quantitative relation between two amounts, showing how many times one value contains or is contained within the other. Proportion, on the other hand, signifies the equality of two ratios. In simple terms, if a/b is a ratio, then a/b = c/d represents a proportion.
Consider baking a cake. The recipe might state a ratio of 2 cups of flour to 1 cup of sugar. This 2:1 ratio is crucial for the cake's texture and sweetness. If you wanted to bake a larger cake while maintaining the same taste and texture, you would need to maintain this proportion. For example, if you used 4 cups of flour, you would need to use 2 cups of sugar (4:2), maintaining the 2:1 proportion. Any deviation from this proportion will alter the result; thus proportion is maintaining the equality of ratios.
22. How do you stay updated with new trends and technologies related to data analysis and mathematical tools?
I stay updated on data analysis and mathematical tools through a combination of online resources and professional engagement. I regularly read industry blogs like KDnuggets and Towards Data Science, follow influential data scientists and mathematicians on platforms like Twitter and LinkedIn, and subscribe to newsletters from organizations like O'Reilly and the ACM. I also actively participate in online communities such as Stack Overflow and relevant subreddits to learn from others and troubleshoot issues. I also stay up to date with new releases and updates to popular open-source libraries like NumPy, SciPy, pandas, and scikit-learn by reading their documentation and release notes.
Furthermore, I attend webinars, online conferences, and workshops related to data science and mathematical modeling to gain insights into emerging trends and technologies. I occasionally take online courses on platforms like Coursera and edX to deepen my understanding of specific topics or learn new skills. Finally, I try to apply new techniques and tools in personal projects or during hackathons to gain hands-on experience and solidify my knowledge. For example, I recently completed a personal project that utilized TensorFlow and Keras to build a neural network for image classification.
23. Imagine you are tasked with optimizing a delivery route for a company. What mathematical concepts would you use to find the most efficient path?
To optimize a delivery route, I would leverage mathematical concepts from graph theory and optimization. Key concepts include: Dijkstra's Algorithm or the A* search algorithm to find the shortest path between two points, considering factors like distance and time. The Traveling Salesperson Problem (TSP) is directly relevant, aiming to find the shortest possible route that visits each location exactly once and returns to the origin. For solving the TSP, techniques like heuristics (e.g., nearest neighbor, genetic algorithms), approximation algorithms, or integer programming could be applied.
Furthermore, linear programming could be used to model constraints such as vehicle capacity, delivery time windows, and driver availability. Network flow algorithms can help optimize the allocation of deliveries to different vehicles and routes. Finally, clustering algorithms might be used to group deliveries into regions for more efficient routing within each region.
Math Skills interview questions for juniors
1. Imagine you have a pizza cut into 8 slices, and you eat 3. How many slices are left?
There are 5 slices left. You started with 8 slices and ate 3, so 8 - 3 = 5.
2. If you have 10 cookies and want to share them equally with 2 friends, how many cookies does each person get?
Each person gets 3 cookies. You have 10 cookies, and you need to divide them among yourself and 2 friends, which means there are 3 people in total. 10 divided by 3 is 3 with a remainder of 1. So, each person gets 3 whole cookies, and there will be 1 cookie left over.
3. What comes next in this pattern: circle, square, circle, square, ?
circle
4. You have 5 toy cars and your friend gives you 2 more. How many toy cars do you have now?
You have 7 toy cars now. You started with 5, and your friend gave you 2 more. 5 + 2 = 7.
5. If a candy bar costs $1 and you pay with $5, how much change do you get back?
You get $4 back.
5 - 1 = 4
6. How many sides does a triangle have?
A triangle has three sides.
7. If it's 2:00 PM now, what time will it be in 3 hours?
It will be 5:00 PM.
8. What is bigger: 10 or 20?
20 is bigger than 10.
9. You have 4 red blocks and 4 blue blocks. How many blocks do you have in total?
You have a total of 8 blocks. 4 red blocks + 4 blue blocks = 8 blocks.
10. If you are number 3 in line, how many people are in front of you?
If you are number 3 in line, there are two people in front of you. The line is ordered such that position 1 is at the front, followed by position 2, and then position 3 where you are standing.
11. A square has all sides equal. if one side is 5 what is the measurement of all the sides?
Since a square has all sides equal, if one side is 5, then all sides are 5.
Therefore, each side of the square measures 5.
12. If a movie starts at 7:00 PM and is 1 hour and 30 minutes long, what time will it end?
The movie will end at 8:30 PM. One hour and 30 minutes after 7:00 PM is 8:30 PM.
13. You want to buy a toy that costs $7, but you only have $3. How much more money do you need?
You need $4 more.
The calculation is $7 (cost of the toy) - $3 (amount you have) = $4.
14. If today is Wednesday, what day was yesterday?
Yesterday was Tuesday.
15. What is smaller: 5 or 8?
5 is smaller than 8.
16. You have 6 balloons and 2 pop. How many balloons are left?
If you start with 6 balloons and 2 pop, you have 4 balloons left. This assumes the balloons are not retrievable and disappear upon popping.
17. If you share 9 marbles equally between 3 people, how many marbles does each person get?
Each person gets 3 marbles. This is because 9 divided by 3 equals 3.
18. What shape has no sides?
A circle has no sides. While we might intuitively think of shapes as being defined by their sides (like a square or triangle), a circle is defined by its continuous curve and constant radius from a central point.
19. If you have 2 groups of 5 stickers, how many stickers do you have altogether?
You have 10 stickers altogether. 5 stickers/group * 2 groups = 10 stickers.
20. You are 6 years old and your sister is 2 years older. How old is your sister?
My sister is 8 years old. Since she's 2 years older than me, and I am 6, you just add 2 to 6.
21. If you have one dozen eggs, how many eggs do you have?
You have twelve eggs. A dozen is defined as a group of twelve.
22. A rectangle has two sides 2 and two sides 4. What do you get when you add all the sides?
The perimeter of a rectangle is the sum of all its sides. In this case, we have two sides of length 2 and two sides of length 4. Therefore, 2 + 2 + 4 + 4 = 12.
23. If each pack has 4 pencils. How many pencils are there in 5 such packs?
There are 20 pencils in 5 packs. This is because 5 packs multiplied by 4 pencils per pack equals 20 pencils (5 * 4 = 20).
24. If you are given a dollar each day for a week, how many dollars would you have?
You would have 7 dollars. Since you receive one dollar each day for a week (7 days), the total amount would be 1 dollar/day * 7 days = 7 dollars.
25. You start with 14 apples and give away half of them. How many apples are left?
You started with 14 apples. Giving away half means giving away 14 / 2 = 7 apples. Therefore, you are left with 14 - 7 = 7 apples.
26. Which number is halfway between 1 and 5?
3
The number halfway between 1 and 5 is calculated as the average of the two numbers: (1 + 5) / 2 = 3.
Math Skills intermediate interview questions
1. Explain how to calculate the area of a triangle. Why is this important in real-world applications?
The area of a triangle can be calculated using several methods, the most common of which is: Area = 1/2 * base * height. Here, 'base' refers to the length of one side of the triangle, and 'height' is the perpendicular distance from that base to the opposite vertex. Another method, Heron's formula, calculates area using only the lengths of the three sides (a, b, c): Area = sqrt[s(s-a)(s-b)(s-c)], where s is the semi-perimeter, i.e., s = (a + b + c) / 2.
Calculating the area of a triangle is important in many real-world applications. For example, in surveying and navigation, it's used to determine land areas and distances. In engineering, it's crucial for calculating the surface area of triangular structures, like bridge supports or roof trusses. In computer graphics and game development, triangle area calculations are essential for rendering 3D models and performing collision detection. It's also applicable in fields like architecture, construction, and even in certain scientific simulations.
2. What is the Pythagorean theorem, and how can it be used to solve real-world problems? Provide an example.
The Pythagorean theorem states that in a right-angled triangle, the square of the length of the hypotenuse (the side opposite the right angle) is equal to the sum of the squares of the lengths of the other two sides. This can be written as a² + b² = c², where 'c' represents the length of the hypotenuse, and 'a' and 'b' represent the lengths of the other two sides.
It can be used to solve real-world problems involving right-angled triangles. For example, imagine you want to build a ramp that is 5 feet long and needs to reach a door that is 3 feet above the ground. You can use the Pythagorean theorem to find out how far the base of the ramp needs to be from the wall. In this case, a = 3, c = 5, so 3² + b² = 5². Solving for b, we get b² = 16, so b = 4 feet. Therefore, the base of the ramp needs to be 4 feet away from the wall.
3. Describe the concept of percentages and how they are used in everyday calculations, like discounts or interest rates.
A percentage is a way of expressing a number as a fraction of 100. The word percent means 'per hundred'. So, 50% means 50 out of 100. Percentages are used extensively in everyday calculations to understand proportions, changes, and comparisons.
Common applications include calculating discounts (e.g., a 20% off sale), interest rates (e.g., a 5% annual interest rate on a loan), taxes (e.g., a 7% sales tax), and tips (e.g., a 15% tip at a restaurant). For instance, to find the price after a discount, you'd calculate the discount amount (percentage of the original price) and subtract it from the original price. Similarly, interest rates determine the amount earned or paid on a principal amount over a certain period.
4. How do you convert between fractions, decimals, and percentages? Why is this skill useful?
To convert a fraction to a decimal, divide the numerator by the denominator. To convert a decimal to a percentage, multiply by 100 and add the percent sign. To convert a percentage to a decimal, divide by 100. To convert a percentage to a fraction, write the percentage as a fraction with a denominator of 100, and then simplify. Conversely, to convert a decimal to a fraction, express the decimal as a fraction (e.g., 0.75 becomes 75/100) and simplify.
This skill is useful because it allows for easy comparison and manipulation of quantities represented in different forms. For example, understanding discounts (percentages), proportions (fractions), and numerical values (decimals) is essential for everyday tasks like budgeting, shopping, and data analysis. In programming, it's needed when dealing with ratios, probabilities, or displaying data in a user-friendly format.
5. What are ratios and proportions, and how can they be used to solve problems involving scaling or comparisons?
Ratios compare two quantities, showing their relative sizes (e.g., 2:3). Proportions state that two ratios are equal (e.g., 2:3 = 4:6). They're fundamental for scaling and comparisons because they maintain consistent relationships. For instance, if a recipe calls for 2 cups of flour for every 1 cup of sugar, maintaining this ratio (2:1) ensures the recipe scales correctly, whether you're doubling or halving it. Similarly, in comparing data, proportions highlight similarities or differences despite varying magnitudes; for example, if the number of male to female students is 2:3 in two different colleges it implies the same balance of male/female population even if overall strength of colleges differ.
6. Explain the order of operations (PEMDAS/BODMAS) and why it's essential for solving mathematical expressions correctly.
PEMDAS (or BODMAS) is an acronym that helps remember the order of operations in mathematical expressions. It stands for:
- Parentheses (or Brackets)
- Exponents (or Orders/Indices)
- Multiplication and Division (from left to right)
- Addition and Subtraction (from left to right)
Following PEMDAS/BODMAS ensures consistent and unambiguous evaluation of expressions. Without a standard order, the same expression could yield different results depending on the sequence of operations, leading to incorrect calculations. For example, 2 + 3 * 4 would result in 20 if addition were done before multiplication, but correctly evaluates to 14 when multiplication precedes addition according to PEMDAS.
7. Describe the concept of variables and how they are used in algebraic equations. Give a simple example.
In algebraic equations, a variable is a symbol (usually a letter like x, y, or z) that represents an unknown or unspecified value. Variables allow us to express relationships between quantities and solve for those unknown values. They act as placeholders until we can determine their actual numerical value.
For example, in the equation x + 5 = 10, the variable x represents a number we need to find. By using algebraic manipulation (subtracting 5 from both sides), we can determine that x = 5. So, the variable x initially stood in for an unknown quantity, which we then solved for.
8. How do you solve a simple linear equation with one variable? Walk through the steps.
To solve a simple linear equation with one variable (e.g., ax + b = c), the goal is to isolate the variable on one side of the equation. This is achieved by performing the same operations on both sides of the equation to maintain equality.
The steps are as follows:
- Isolate the term with the variable: Add or subtract the constant term (
b) from both sides of the equation to getax = c - b. - Solve for the variable: Divide both sides of the equation by the coefficient of the variable (
a) to getx = (c - b) / a. This gives the value of the variable that satisfies the equation.
9. Explain what a graph is and how it can be used to represent data or relationships between variables.
A graph is a data structure consisting of nodes (vertices) and edges. The nodes represent entities, and the edges represent relationships or connections between those entities. Graphs can be directed (edges have a specific direction) or undirected (edges have no specific direction).
Graphs are useful for representing various types of data and relationships. For example:
- Social Networks: Nodes can represent people, and edges can represent friendships or connections.
- Road Networks: Nodes can represent cities, and edges can represent roads connecting them.
- Dependencies: Representing dependencies between software modules. Nodes would be modules and edges represent module A using module B.
- Knowledge Graphs: Representing relationships between concepts or entities in a knowledge domain.
10. What is the difference between mean, median, and mode? How do you calculate each one, and when is each measure most appropriate?
Mean, median, and mode are measures of central tendency in a dataset.
Mean is the average of all values. It's calculated by summing all values and dividing by the number of values. It's most appropriate when the data is relatively evenly distributed without significant outliers.
Median is the middle value when the data is sorted. If there's an even number of values, it's the average of the two middle values. It is most appropriate when the data has outliers or is skewed, as it's less affected by extreme values than the mean.
Mode is the value that appears most frequently. A dataset can have multiple modes or no mode. It's most appropriate when you want to know the most common value in a dataset, especially for categorical data.
11. Describe the concept of probability and how it is calculated. Provide an example of a real-world situation where probability is used.
Probability is the measure of the likelihood that an event will occur. It's quantified as a number between 0 and 1, where 0 indicates impossibility and 1 indicates certainty. The basic formula for calculating probability is: Probability of an event = (Number of favorable outcomes) / (Total number of possible outcomes).
A real-world example is weather forecasting. Meteorologists use probability to predict the chance of rain. For instance, if a forecast says there's a 70% chance of rain, it means that based on current atmospheric conditions and historical data, there's a high likelihood (70 out of 100) that it will rain in the specified area during the forecast period. This information helps people make informed decisions, such as whether to carry an umbrella.
12. How do you calculate simple interest? What factors affect the amount of interest earned or paid?
Simple interest is calculated using the formula: Simple Interest = Principal x Rate x Time, where Principal is the initial amount, Rate is the annual interest rate (as a decimal), and Time is the duration of the loan or investment in years.
The factors that affect the amount of simple interest earned or paid are:
- Principal: The larger the principal, the more interest is earned or paid.
- Interest Rate: A higher interest rate results in more interest.
- Time: The longer the duration, the greater the amount of interest.
13. Explain the concept of exponents and how they are used to represent repeated multiplication. Give an example.
Exponents provide a concise way to represent repeated multiplication of the same number. Instead of writing a number multiplied by itself multiple times (e.g., 2 * 2 * 2 * 2), we use an exponent. The base is the number being multiplied, and the exponent indicates how many times the base is multiplied by itself. For example, in the expression 24, 2 is the base, and 4 is the exponent.
This expression is equivalent to 2 * 2 * 2 * 2, which equals 16. Thus, 24 = 16. Another example is 53 = 5 * 5 * 5 = 125.
14. What are geometric shapes, and how do you calculate their perimeter and area? Focus on squares, rectangles, and circles.
Geometric shapes are figures defined by their boundaries. For squares, perimeter is 4 * side, and area is side * side. For rectangles, perimeter is 2 * (length + width), and area is length * width. For circles, perimeter (circumference) is 2 * π * radius, and area is π * radius^2, where π (pi) is approximately 3.14159.
Here's how you'd calculate these values in code (e.g., Python):
def square_perimeter(side):
 return 4 * side

def square_area(side):
 return side * side

def rectangle_perimeter(length, width):
 return 2 * (length + width)

def rectangle_area(length, width):
 return length * width

import math

def circle_circumference(radius):
 return 2 * math.pi * radius

def circle_area(radius):
 return math.pi * radius * radius
15. Describe the concept of estimation and how it can be used to quickly approximate answers in real-world situations. Why is estimation important?
Estimation is the process of finding an approximate answer or value when an exact answer is unnecessary or impossible to obtain quickly. It involves using available information and simplifying assumptions to arrive at a reasonable guess. In real-world situations, estimation helps us make quick decisions, plan resources, and assess feasibility. For example, estimating travel time, the cost of groceries, or the number of people attending an event.
Estimation is important because it provides a rapid assessment in situations where precise calculations are not feasible or time-sensitive. It's useful for:
- Decision-making under uncertainty: Quickly evaluating options when complete data is missing.
- Resource allocation: Approximating needs to avoid over or under-spending.
- Sanity checks: Validating the reasonableness of computed results.
- Problem-solving: Providing a starting point when the full solution is not immediately obvious.
16. How do you read and interpret data presented in a table or chart? What information can be gleaned from these representations?
When reading a table or chart, I start by understanding the title, axes labels (if applicable), and units. I then look for overall trends, patterns, and outliers. For tables, this means comparing values across rows and columns, identifying maximums, minimums, and averages. For charts, it means observing the slope of lines, the height of bars, or the distribution of data points.
From these representations, I can glean various insights, such as relationships between variables, distributions of data, and comparisons between different categories. I can identify correlations, causations (though carefully), and potential areas for further investigation. For example, a sales table might reveal the best-selling product, while a chart of website traffic might highlight peak usage times or drop-off points.
17. Explain the concept of unit conversion and how to convert between different units of measurement, such as inches to centimeters or pounds to kilograms.
Unit conversion is the process of changing a measurement from one unit to another. It involves multiplying or dividing the original measurement by a conversion factor. A conversion factor is a ratio that expresses how many of one unit are equal to another unit. For example, 1 inch equals 2.54 centimeters, so the conversion factor between inches and centimeters is either 2.54 cm/inch or 1 inch/2.54 cm.
To convert between units, you multiply the initial value by the conversion factor that cancels out the original unit and leaves you with the desired unit. For inches to centimeters, multiply the number of inches by 2.54 cm/inch. For pounds to kilograms, since 1 pound is approximately 0.453592 kilograms, you'd multiply the number of pounds by 0.453592 kg/pound. Ensure that the units you want to eliminate are in opposite positions (numerator vs. denominator) in the multiplication to cancel out correctly. For example, to convert 10 inches to centimeters: 10 inches * (2.54 cm / 1 inch) = 25.4 cm.
18. What are the different types of angles (acute, obtuse, right, straight), and how are they measured?
There are four primary types of angles: acute, obtuse, right, and straight. They are measured in degrees.
- Acute angle: An angle that measures less than 90 degrees.
- Right angle: An angle that measures exactly 90 degrees.
- Obtuse angle: An angle that measures greater than 90 degrees but less than 180 degrees.
- Straight angle: An angle that measures exactly 180 degrees.
19. Describe the concept of prime numbers and how to identify them. Why are prime numbers important in mathematics?
Prime numbers are whole numbers greater than 1 that have only two distinct divisors: 1 and themselves. To identify a prime number, you can try dividing it by numbers from 2 up to the square root of the number. If none of these numbers divide evenly, then it's a prime number. For example, to check if 17 is prime, you only need to check divisibility by 2, 3 and possibly up to 4 (since sqrt(17) ~ 4.1). Since none of these divide 17 evenly, 17 is a prime number.
Prime numbers are fundamental in mathematics, especially in number theory and cryptography. Every integer greater than 1 can be expressed uniquely as a product of prime numbers (the fundamental theorem of arithmetic). In cryptography, they are crucial for creating secure encryption algorithms like RSA, which relies on the difficulty of factoring large numbers into their prime factors.
20. How can math be applied to project management to estimate timelines, resources, and budgets? Give a basic overview.
Math is crucial for project management. Estimating timelines often involves using formulas like PERT (Program Evaluation and Review Technique), which uses a weighted average of optimistic, pessimistic, and most likely time estimates: (Optimistic + 4*Most Likely + Pessimistic) / 6. This helps account for uncertainty. Resource allocation can use linear programming to optimize assignment of tasks to team members based on skills and availability. Budgets are built upon cost estimations, which can be derived using regression analysis to predict costs based on historical data or analogous estimating which relies on ratios and proportions from previous similar projects.
For resource allocation, consider critical path method (CPM). CPM identifies the longest sequence of dependent activities and their associated durations, therefore dictating the shortest time needed to complete the project. It uses addition and subtraction to track dependencies, slack/float, and early/late start/finish times for each activity. Variance analysis applies statistics to monitor budget adherence, comparing planned vs. actual costs and identifying deviations that require corrective action. Math also underlies earned value management (EVM), where metrics such as Schedule Performance Index (SPI) and Cost Performance Index (CPI) are calculated to assess project performance.
21. Explain scaling of recipes. If a recipe serves 4 people and you need to serve 10, how do you adjust ingredient amounts?
Scaling a recipe involves adjusting the ingredient quantities to accommodate a different number of servings. In essence, you determine a scaling factor and multiply each ingredient amount by that factor.
To scale a recipe from 4 servings to 10, calculate the scaling factor by dividing the desired servings (10) by the original servings (4). This gives you a scaling factor of 2.5. Multiply the amount of each ingredient in the original recipe by 2.5. For example, if the recipe calls for 1 cup of flour, you would now use 2.5 cups of flour. Note that adjustments might be needed for cooking time and temperature.
Math Skills interview questions for experienced
1. Describe a time you used advanced statistical modeling to solve a business problem. What were the challenges, and how did you overcome them?
In my previous role, we aimed to improve customer churn prediction for a subscription-based service. I developed a survival analysis model using Cox proportional hazards regression, incorporating customer demographics, usage patterns, and engagement metrics. A key challenge was handling time-varying covariates, such as changes in subscription tier or feature usage over time. I addressed this by restructuring the data into a time-series format suitable for survival analysis, allowing the model to accurately reflect the impact of these dynamic factors on churn risk.
Another challenge was model validation due to limited churn events within a reasonable timeframe. I employed bootstrapping techniques to resample the data and create multiple model instances, which allowed me to robustly assess model performance and identify potential overfitting. The model significantly outperformed our existing rule-based system, leading to a 15% reduction in churn within the target customer segment after implementing tailored intervention strategies based on the model's predictions. This helped improve customer retention rates and reduced customer acquisition costs.
2. Explain a situation where your understanding of calculus or differential equations significantly impacted a project's outcome. What was the situation and what was the impact?
In a robotics project aimed at creating a self-balancing robot, my understanding of differential equations was crucial. We initially struggled to achieve stable balancing, as the robot would constantly overshoot its target position. The initial control system used a simple proportional-derivative (PD) controller, but it exhibited oscillations. By modeling the robot's dynamics using differential equations (specifically, equations describing the rotational motion and the impact of the motor torque), I was able to analyze the system's stability and identify the source of the oscillations. This analysis revealed that the derivative gain was too high, causing the system to overreact to small changes in angle.
By reducing the derivative gain based on the stability analysis derived from the differential equations, we were able to significantly reduce the oscillations and achieve a much more stable balancing performance. Furthermore, the model helped us predict the robot's response to disturbances, allowing us to fine-tune the controller parameters and optimize its overall performance. Without this understanding and application of differential equations, the robot would have remained unstable and the project would have failed to meet its balancing objectives.
3. Walk me through a complex data analysis project where you had to justify your methodological choices to stakeholders with limited mathematical backgrounds. How did you communicate your approach?
In a fraud detection project, I analyzed transaction data to identify suspicious patterns. The challenge was explaining my choice of anomaly detection algorithms, specifically Isolation Forests, to stakeholders who weren't familiar with machine learning. I avoided technical jargon, focusing instead on the practical benefits: how Isolation Forests effectively 'isolate' unusual transactions that deviated significantly from the norm, which translated to fewer false positives and more efficient fraud investigations. I used visuals – scatter plots showing anomalies highlighted in a simple way – and analogies, comparing the algorithm to sifting through a pile of sand to find rare gemstones. I also emphasized the algorithm's accuracy through metrics they understood, like precision and recall in plain english, not just numbers.
4. How do you approach optimizing complex algorithms or processes using mathematical principles? Give a specific example.
When optimizing complex algorithms, I generally follow these steps, leveraging mathematical principles: 1. Identify Bottlenecks: Use profiling tools to pinpoint the most time-consuming parts of the algorithm. 2. Mathematical Modeling: Represent the core operations mathematically to understand their complexity (e.g., Big O notation). This helps to understand the scaling behavior and the potential for improvements. 3. Algorithm Selection: Based on the mathematical model, explore alternative algorithms with better theoretical performance for the given problem. For instance, replacing a brute-force search (O(n^2)) with a binary search (O(log n)) if the data is sorted.
As a specific example, consider optimizing a large matrix multiplication. A naive implementation has O(n^3) complexity. By applying Strassen's algorithm, which uses a divide-and-conquer approach, we can reduce the complexity to approximately O(n^2.81). While the constant factors might make Strassen's algorithm less efficient for small matrices, it provides significant performance gains for sufficiently large matrices. Furthermore, libraries like BLAS employ highly optimized routines leveraging linear algebra principles and hardware acceleration to further speed up matrix operations. Profiling will help identify if matrix multiplies are the bottleneck and if so, switching to optimized libraries will often give a significant performance boost.
5. Explain a time when you had to estimate the probability of an event with limited data. What methods did you use, and how did you validate your results?
In a previous role, I was tasked with estimating the probability of a customer clicking on a new advertising banner, but we only had data from a small beta test with a few hundred users. To tackle this, I used a Bayesian approach. I started with a prior distribution (based on historical click-through rates of similar banners) and updated it with the beta test data to get a posterior distribution. This allowed me to quantify the uncertainty in my estimate.
To validate, I used A/B testing on a larger user base after the initial launch. I compared the predicted click-through rate (derived from the posterior distribution) with the actual click-through rate observed in the A/B test. I also used techniques like cross-validation on the limited beta data, splitting the data into training and validation sets to get an idea of how well the model generalized. Finally, I monitored the banner's performance after the full launch and continuously refined the probability estimate as more data became available.
6. Describe a scenario where you had to build a predictive model from scratch. What factors did you consider, and how did you assess its accuracy?
I once built a model to predict customer churn for a subscription-based service. Key factors considered were data availability (historical usage, demographics, engagement metrics), feature engineering (creating relevant features like recency, frequency, monetary value), model selection (logistic regression chosen for interpretability and speed) and model evaluation. To assess accuracy, I split the data into training and testing sets. On the test set, I used metrics like precision, recall, F1-score, and AUC to evaluate the model's performance.
Initially, the model showed low recall, indicating it wasn't capturing a significant portion of churned customers. To improve this, I tried techniques like SMOTE (Synthetic Minority Oversampling Technique) to balance the churned and non-churned classes in the training data. I also performed feature selection using techniques like Recursive Feature Elimination(RFE) to eliminate the less relevant features. This improved the model's overall performance, particularly in identifying potential churners.
7. Tell me about a project where you applied game theory principles to solve a strategic problem. What was the outcome?
In a project involving resource allocation in a cloud computing environment, we applied game theory to optimize the distribution of virtual machines among different users. Each user's demand for resources and their tolerance for latency were modeled as their 'strategy'. We used a non-cooperative game model, specifically a variant of the Nash equilibrium, to determine an allocation where no user could improve their utility (performance) by unilaterally changing their resource request. This resulted in a fairer and more efficient allocation compared to our previous heuristic-based approach.
Previously, resources were allocated based on a first-come, first-served approach, leading to resource hogging by some users and starvation for others. The game theory approach, using the Nash equilibrium as a guide, led to a 15% improvement in overall resource utilization and a 20% reduction in average latency across all users, while maintaining fairness by ensuring all users received a reasonable share of the available resources.
8. Discuss a situation where you had to deal with a large dataset that required sophisticated mathematical techniques to extract meaningful insights. What tools and techniques did you use?
I once worked with a dataset of customer transactions, totaling over 50 million records, to identify fraudulent activities. The sheer volume made manual inspection impossible. I employed several techniques including anomaly detection using clustering algorithms like k-means (with optimized k determination via the elbow method and silhouette analysis) and DBSCAN, along with time series analysis on transaction patterns using ARIMA models to predict expected behavior and flag deviations. I also implemented logistic regression to predict the probability of a transaction being fraudulent, using features engineered from transaction history, user demographics, and network activity.
For this task, I primarily used Python with libraries like scikit-learn, pandas, numpy, and statsmodels. I leveraged Spark (with pyspark) for distributed data processing and model training, given the dataset's size. The final model performance was evaluated using metrics like precision, recall, and F1-score, with careful attention paid to minimizing false positives to avoid unnecessary disruption to legitimate customers. The results were then visualized using matplotlib and seaborn to communicate findings to stakeholders.
9. Explain how you use mathematical modeling to forecast future trends or outcomes. Provide a real-world example.
Mathematical modeling helps forecast trends by creating simplified representations of real-world systems using equations. These models capture key relationships between variables, allowing us to simulate different scenarios and predict outcomes. We choose the modeling technique based on the problem; for example, time series analysis (like ARIMA) for forecasting sales, or regression models to predict customer churn based on various factors.
For instance, I used a regression model to forecast website traffic based on marketing spend, seasonality, and competitor activity. The model was built using historical data, validated with a holdout set, and then used to predict future traffic under different marketing budget scenarios. This helped the marketing team optimize their spending for maximum impact. We could also then adjust the model as needed based on the actual performance versus predicted to improve the model accuracy.
10. Describe a situation where your mathematical skills helped you identify and correct a significant error in a financial or operational model.
In a previous role, I was tasked with validating a new pricing model for a complex financial derivative. The model was generating prices significantly higher than the market. Using my understanding of stochastic calculus and option pricing theory (specifically Ito's lemma and the Black-Scholes framework), I deconstructed the model's calculations step-by-step.
I discovered that a critical variance term was incorrectly implemented, resulting in an inflated volatility input. The correct formula had been misinterpreted during the software implementation, leading to the erroneous pricing. By identifying and correcting this mathematical error in the underlying code, the model's output aligned with market prices, preventing potential mispricing and financial loss.
11. How do you stay current with the latest advancements in mathematical modeling and data analysis techniques?
I stay current with advancements in mathematical modeling and data analysis through a combination of formal and informal learning. I regularly read research papers on arXiv, particularly in areas like machine learning, statistical modeling, and optimization. I also subscribe to relevant journals and blogs such as the Journal of Machine Learning Research and Towards Data Science.
To further expand my knowledge, I complete online courses and attend workshops/conferences focusing on new methodologies and tools. For example, I recently completed a course on Bayesian methods and plan to attend a conference on causal inference next year. I also follow key researchers and thought leaders on platforms like Twitter and LinkedIn to keep up-to-date on their latest work and insights. Finally, I find implementing new techniques in personal or work-related projects invaluable for practical understanding.
12. Walk me through a time you had to explain a complex mathematical concept to a non-technical audience. How did you ensure they understood the key takeaways?
I once had to explain A/B testing to the marketing team, who had very little statistical background. I started by avoiding technical jargon and framing it as a way to compare two different marketing campaigns to see which performs better. I used the analogy of trying two different recipes for cookies to see which one people liked more.
To ensure understanding, I focused on the 'why' rather than the 'how'. I emphasized that A/B testing helps us make data-driven decisions, reduce guesswork, and improve campaign effectiveness. I used visual aids like simple charts showing conversion rates, and avoided diving deep into p-values or statistical significance unless specifically asked. When those questions did arise, I related it to real-world impact on campaign outcomes (e.g., 'This means we can be 95% confident that Campaign A is truly better than Campaign B'). I concluded by reiterating the key takeaways: A/B testing allows for systematic improvement, and provides concrete evidence for better marketing decisions.
13. Describe a time when you used your knowledge of linear algebra to optimize a process or system. What specific techniques did you employ?
In a previous role, I worked on optimizing an image recognition system. The system used a neural network, and the initial performance was slow. I identified that a significant bottleneck was in the fully connected layers, which involved large matrix multiplications. I applied Singular Value Decomposition (SVD) to decompose the weight matrices of these layers into smaller matrices. This reduced the number of parameters and computations required during the forward pass.
Specifically, I used Python with NumPy and SciPy libraries. I first loaded the weight matrix, then applied scipy.linalg.svd to decompose it. I selected a rank k based on the variance explained (using the singular values), reconstructed the matrix using the top k singular values and vectors, and replaced the original weight matrix with the reconstructed one. This resulted in a significant speedup during inference with minimal loss of accuracy.
14. Explain a situation where your understanding of stochastic processes proved valuable in a project. What problem did it solve?
In a demand forecasting project for a retail client, we faced highly erratic sales data for a particular product line. Traditional time series models were failing to capture the underlying dynamics and producing inaccurate forecasts. I applied my understanding of stochastic processes, specifically a Markov Chain model, to represent the probability of transitioning between different demand states (low, medium, high) based on historical data.
This approach allowed us to model the uncertainty in demand more effectively. The Markov Chain captured the dependencies between consecutive demand periods, providing more accurate short-term forecasts and informing inventory management decisions. This led to a reduction in both stockouts and excess inventory, significantly improving the client's profitability. The model was implemented using Python and libraries like NumPy for matrix operations, and the transition probabilities were estimated using Maximum Likelihood Estimation.
15. How do you approach validating the assumptions underlying a mathematical model? Give an example.
Validating assumptions in a mathematical model is crucial for ensuring its reliability. My approach involves several steps. First, I explicitly state all assumptions made during model development. Then, I assess the reasonableness of each assumption based on available data and domain knowledge. This might involve comparing the assumed distribution of a variable with observed data or consulting with subject matter experts. A sensitivity analysis is performed to determine how changes in assumptions affect model outputs. If small changes in assumptions lead to significant variations in results, the model is highly sensitive and the assumptions need closer scrutiny. Finally, I test the model's predictions against real-world data or experimental results. Significant discrepancies between predictions and observations indicate that one or more assumptions may be invalid.
For example, consider a model predicting customer churn assuming customers behave independently. To validate this, one could analyze customer interaction networks to see if churn is clustered, indicating dependence. If customers in a social group tend to churn together, the independence assumption is violated, and the model may need refinement to account for network effects. Another approach could involve testing the sensitivity of the churn prediction to different levels of customer dependence. If the prediction is highly sensitive to dependence levels, it would suggest the original assumption of independence is inappropriate.
16. Describe a project where you used mathematical optimization techniques to improve efficiency or reduce costs. What were the results?
In a supply chain optimization project, I utilized linear programming to minimize transportation costs for a distribution network. The goal was to determine the optimal quantity of goods to ship from multiple warehouses to various retail locations, considering warehouse capacities, retail demand, and transportation costs between each warehouse-retail pair. I formulated the problem as a linear program with decision variables representing the shipment quantities, and constraints representing warehouse capacities and retail demands. The objective function was to minimize the total transportation cost.
By implementing the linear program in Python using the PuLP library, I was able to determine the optimal shipment plan. This resulted in a 15% reduction in transportation costs compared to the existing heuristic-based approach. The project also provided insights into the optimal warehouse locations to serve specific retail regions, enabling better strategic decisions for future network expansion.
17. Tell me about a time you had to adapt a mathematical model to account for unexpected changes or new information. How did you handle the situation?
During a project predicting customer churn for a subscription service, our initial model relied heavily on historical usage patterns and demographic data. However, a competitor launched a very aggressive promotional campaign, causing a significant and unexpected spike in churn, which our model completely missed. To adapt, I first investigated the root cause, confirming the competitor's impact. Then, I incorporated a new feature representing 'competitive intensity,' proxied by publicly available data on competitor ad spend and promotional activity. This required retraining the model with the updated feature set. I also adjusted the model's sensitivity to recent data, giving more weight to recent trends to react faster to future market shifts. The revised model, incorporating competitive intensity, significantly improved our churn prediction accuracy and allowed for more proactive customer retention efforts.
Specifically, I used a logistic regression model initially. After adding the competitive intensity feature, I had to re-evaluate feature importance using techniques like permutation importance and variance inflation factor (VIF) to avoid multicollinearity between existing features and the new feature. I also used cross-validation to ensure the new model generalized well and didn't overfit the training data. sklearn.linear_model.LogisticRegression in Python was used for the initial model and retraining.
18. Explain how you would use Bayesian statistics to solve a problem in your previous role. Provide a specific example.
In a previous role as a data analyst, I used Bayesian statistics to improve the accuracy of our sales forecasting model. Our initial model was based purely on historical sales data using a frequentist approach, but it was prone to overfitting and didn't perform well when new products were introduced with limited historical data.
To address this, I incorporated Bayesian methods. Specifically, I used a hierarchical Bayesian model to predict sales. This allowed me to include prior knowledge about the product category (e.g., typical sales range, seasonality). The model updated these priors with observed sales data, providing more robust forecasts, especially for new products. For example, when we launched a new energy drink, the model started with a prior based on the performance of similar drinks. As sales data accumulated, the model adapted, improving the accuracy of predictions compared to the original frequentist approach. This led to better inventory management and reduced waste.
19. Describe a time you used graph theory to solve a real-world problem. What was the problem, and how did you apply graph theory concepts?
I once worked on optimizing delivery routes for a local courier company. The problem was to minimize the total distance traveled by delivery drivers each day. I modeled the delivery locations as nodes in a graph, and the roads connecting them as edges. The weight of each edge represented the distance between two locations. Then, I used Dijkstra's algorithm (a shortest path algorithm from graph theory) to find the shortest path between the depot (starting point) and each delivery location.
After determining the shortest routes to each location, I used the Christofides algorithm (an approximation algorithm for the Traveling Salesperson Problem, which is rooted in graph theory) to create an efficient route that visited all delivery locations and returned to the depot. This significantly reduced the total distance traveled by the drivers and subsequently, lowered fuel costs and improved delivery times. Python along with the NetworkX library was instrumental for this project.
20. How do you handle uncertainty and risk in your mathematical models? What techniques do you use to quantify and mitigate these factors?
I address uncertainty and risk in mathematical models through a combination of techniques. Firstly, I focus on quantifying uncertainty by identifying sources of variability and representing them using probability distributions or fuzzy numbers. Techniques include sensitivity analysis to determine how model outputs change with variations in input parameters, and Monte Carlo simulation to generate multiple model runs with different parameter values sampled from their distributions, providing a range of possible outcomes.
To mitigate risk, I employ robust optimization techniques that seek solutions that perform well under a range of possible scenarios. I also use scenario planning to consider various plausible future states and develop strategies appropriate for each. Model validation and calibration using historical data are crucial for reducing model error and building confidence in predictions. Finally, Bayesian methods can be used to update model parameters and predictions as new data becomes available.
21. Describe a time you were faced with a problem that required you to learn a new mathematical concept or technique quickly. How did you approach the learning process?
During a project involving fraud detection at a fintech company, I needed to implement a custom anomaly detection algorithm that used kernel density estimation (KDE). I had a basic understanding of probability distributions but lacked experience with non-parametric methods like KDE and bandwidth selection.
To quickly learn the necessary math, I started with online resources like Khan Academy and MIT OpenCourseware for a refresher on probability and statistics fundamentals. Then, I focused on KDE-specific resources like research papers and blog posts explaining the underlying theory and practical implementation. I implemented KDE in Python using scikit-learn, experimenting with different kernels and bandwidth selection techniques. I validated the algorithm's performance against benchmark datasets and discussed my approach with senior data scientists on the team to refine my understanding and ensure the model was effective for the specific fraud patterns we were targeting.
22. How do you ensure the accuracy and reliability of your mathematical calculations and models, especially when dealing with large datasets or complex algorithms?
To ensure accuracy and reliability, I use a multi-faceted approach. First, I rigorously validate input data for correctness and completeness. I implement robust error handling within my code to catch unexpected values or conditions. Unit tests are crucial for verifying the correctness of individual functions and algorithms. These tests cover a range of inputs, including edge cases and boundary conditions. For large datasets, I perform statistical analysis and visualizations to detect anomalies or inconsistencies in the results.
Furthermore, when dealing with complex models, I apply techniques like cross-validation to assess the model's generalization performance on unseen data. I also compare the model's output with expected results or known benchmarks whenever possible. Regular code reviews by peers help identify potential errors or areas for improvement. Consider the following python pseudo-code for validating a function:
def validate_result(actual, expected, tolerance):
  if abs(actual - expected) <= tolerance:
    return True
  else:
    return False
23. Explain a time when your mathematical skills helped you identify a fraudulent or suspicious activity. What were the indicators, and how did you investigate?
During my previous role in data analysis for a financial institution, I noticed a peculiar pattern in transaction data. Specifically, I observed a cluster of accounts with unusually high transaction volumes occurring within a very short timeframe, deviating significantly from their historical averages. The amounts were also subtly below a threshold that would trigger automatic fraud alerts.
Using statistical analysis, I calculated the standard deviation of transaction amounts and frequencies for each account. The flagged accounts showed transaction patterns that were several standard deviations away from their norm. Further investigation, involving cross-referencing IP addresses and account creation dates, revealed that these accounts were likely linked and were engaging in coordinated fraudulent activity. This information was then passed on to the fraud investigation team for further action.
Math Skills MCQ
Question 1.
A store increased the price of a shirt from $20 to $25. What is the percentage increase in the price of the shirt?
Options:
Options:
Question 2.
Sarah invests $5,000 in a savings account that earns a simple interest rate of 3% per year. How much interest will she earn after 4 years?
Options:
Question 3.
Sarah invests $5,000 in an account that earns 6% interest compounded annually. How much interest will she have earned after 3 years? options:
Options:
Question 4.
A store is offering a 20% discount on a television that originally costs $800. If the sales tax is 8%, what is the total cost of the television after the discount and sales tax are applied?
Options:
Question 5.
The price of a laptop decreased from $800 to $680. What is the percentage decrease in the price of the laptop?
Options:
Options:
Question 6.
An investment of $5,000 earns compound interest at an annual rate of 6% compounded annually for the first 3 years. After 3 years, the accumulated amount earns simple interest at an annual rate of 8% for the next 2 years. What is the final amount of the investment after 5 years?
Options:
Question 7.
Bank A offers an account with a nominal interest rate of 6% compounded monthly. Bank B offers an account with a nominal interest rate of 5.9% compounded daily. What is the difference between the effective annual rate (EAR) offered by Bank A and the EAR offered by Bank B? (Round to two decimal places)
Options:
Question 8.
An investor wants to double their initial investment using simple interest. At an annual interest rate of 8%, how many years will it take for the investment to double?
Options:
Options:
Question 9.
An investment offers a nominal annual interest rate of 6%, compounded monthly. What is the effective annual interest rate?
Options:
Question 10.
An investment of $5,000 is made into an account that earns interest at a rate of 6% per year, compounded continuously. What will be the value of the investment after 8 years?
Options:
Question 11.
What is the present value of an annuity that pays $500 annually for 5 years, assuming an annual discount rate of 6%?
Options:
Options:
Question 12.
A student's final grade is calculated as a weighted average. Homework is worth 20% of the final grade, quizzes are worth 30%, and the final exam is worth 50%. If a student has an average of 90 on homework, 80 on quizzes, and 85 on the final exam, what is their final grade?
Options:
Options:
Question 13.
What is the present value of $7,000 to be received 5 years from now, assuming an interest rate of 8% compounded annually?
Options:
Options:
Question 14.
What is the monthly payment for a $250,000 loan with a 5% annual interest rate, amortized over 30 years?
Options:
Question 15.
What is the future value of an ordinary annuity with payments of $500 made at the end of each quarter for 3 years, earning interest at 8% per year compounded quarterly?
options:
Options:
Question 16.
Approximately how many years will it take for an investment to triple in value if it earns an annual interest rate of 8% compounded annually?
options:
Options:
Question 17.
An investor buys a stock for $50 per share. After one year, the stock pays a dividend of $5 per share and the stock price increases to $60 per share. What is the total return on the investor's investment?
Options:
Question 18.
An investment of $5,000 grows to $6,326.60 in 3 years when interest is compounded quarterly. What is the nominal annual interest rate?
Options:
Question 19.
An initial investment of $5,000 is made into an account that earns interest at a rate of 6% per year, compounded annually. How many years will it take for the investment to grow to $8,000? Choose the closest value.
Options:
Options:
Question 20.
An investment grows from $5,000 to $6,500 over 3 years. What is the approximate annual growth rate?
Options:
Question 21.
A company sells widgets for $25 each. The variable cost per widget is $15, and the company has fixed costs of $50,000 per year. What is the break-even point in units?
Options:
Question 22.
What is the initial investment needed to reach a target amount of $250,000 in 10 years, assuming an average inflation rate of 3% per year?
Options:
Question 23.
A company sells a product for $75. The cost of goods sold (COGS) is $45. What is the profit margin percentage?
Options:
Question 24.
An investor purchased a stock for $50 per share. After one year, the investor received a dividend of $2 per share and sold the stock for $55 per share. What is the annual rate of return on this investment?
Options:
Question 25.
What is the Net Present Value (NPV) of an investment that costs $50,000 today and is expected to generate the following cash flows over the next 3 years: $20,000 in Year 1, $25,000 in Year 2, and $15,000 in Year 3? Assume a discount rate of 8%.
Options:
Options:
Which Math Skills skills should you evaluate during the interview phase?
While a single interview can't reveal everything about a candidate, focusing on core skills is key. When evaluating Math Skills abilities, prioritize areas directly impacting job performance. These skills can make or break a candidate's success.
Quantitative Reasoning
To quickly assess a candidate's quantitative reasoning skills, consider using a pre-employment test. Adaface's Numerical Reasoning test is designed to filter candidates based on their ability to interpret and analyze numerical data.
You can also evaluate this skill by asking targeted interview questions. This provides a more in-depth understanding of their problem-solving approach.
A company's revenue increased by 15% in the first year and 10% in the second year. What is the overall percentage increase in revenue over the two years?
Look for candidates who can accurately calculate percentage increases and understand how to combine them. They should be able to explain their steps clearly and logically.
Data Interpretation
Utilize assessment tests with relevant MCQs to efficiently filter candidates based on their data interpretation skills. Adaface's Data Interpretation test helps you identify candidates who can quickly and accurately extract insights from data.
Prepare interview questions that directly assess their ability to interpret data. This allows you to assess how they approach complex datasets.
Present a table showing sales data for different products across various regions. Ask the candidate to identify the best-performing product and the region with the highest sales growth.
Evaluate how the candidate analyzes the data to identify trends and patterns. They should be able to justify their conclusions based on the data provided.
Business Math
An assessment test with questions on Business Math can help. Adaface's Business Development test measures the ability to apply Math to real world business situations.
In the interview, you can explore specific scenarios. This will give you an idea about how well they apply business math concepts to practical issues.
If a product sells for $100 with a cost of goods sold of $60, and operating expenses of $20, what is the net profit margin?
Look for candidates who can correctly apply the formula (Revenue - COGS - Operating Expenses) / Revenue. They should also know what the net profit margin actually means in a business context.
3 Tips for Effectively Using Math Skills Interview Questions
Now that you're equipped with a variety of math skills interview questions, let's discuss how to use them effectively. Here are three tips to help you maximize your candidate evaluation process.
1. Leverage Skills Assessments to Objectively Evaluate Math Proficiency
Before diving into interviews, use skill assessments to screen candidates. These tests provide objective data on a candidate's math abilities, saving valuable interview time and focusing your efforts on the most promising individuals.
Adaface offers a range of assessments to gauge different aspects of mathematical competency. Consider using the Business Math Test, Quantitative Aptitude Test, or Numerical Reasoning Test to assess candidates depending on the role.
Skills assessments streamline the screening process, allowing you to quickly identify candidates who possess the mathematical skills needed for the job. This data driven approach improves hiring accuracy and reduces the risk of making a bad hire.
2. Curate Targeted Interview Questions
Time is of the essence in interviews, so plan your questions carefully. Select a focused set of math skills interview questions that directly assess the most relevant competencies for the role.
Consider these additional interview questions alongside math skills. Questions around analytical skills or problem solving can be great avenues to check for depth. You can find some structured situational judgement interview questions for this as well.
By prioritizing the right questions, you'll gain a more accurate understanding of each candidate's strengths and weaknesses in a short amount of time. This allows you to make informed decisions about their fit for the position.
3. Ask Follow-Up Questions to Understand Candidate Depth
Don't stop at surface-level answers. Asking thoughtful follow-up questions is key to truly understanding a candidate's depth of knowledge and problem-solving abilities.
For example, if you ask a candidate to calculate a percentage increase, follow up with 'Can you explain the real-world implications of this increase for our business?' This reveals their understanding of the underlying concepts and their ability to apply math skills practically.
Hire Top Talent with Math Skills Assessments
When hiring for roles requiring strong math skills, ensuring accurate evaluation is key. Using skills tests is the most effective approach. Consider leveraging our Business Math Test or Quantitative Aptitude Test to identify candidates with the right aptitude.
Once you've identified top performers using skills tests, streamline your hiring process by shortlisting the best applicants for interviews. Ready to get started? Sign up and begin assessing candidates today.
Business Math Test
25 mins | 12 MCQs
The Business Math Test evaluates a candidate's ability to apply mathematical concepts in a business context. Using scenario-based MCQ questions, it assesses knowledge of arithmetic percentages algebra statistics probability interest calculations discounts financial ratios and cost analysis. This test ensures candidates can perform essential business operations and financial assessments.
Try Business Math Test
Download Math Skills interview questions template in multiple formats
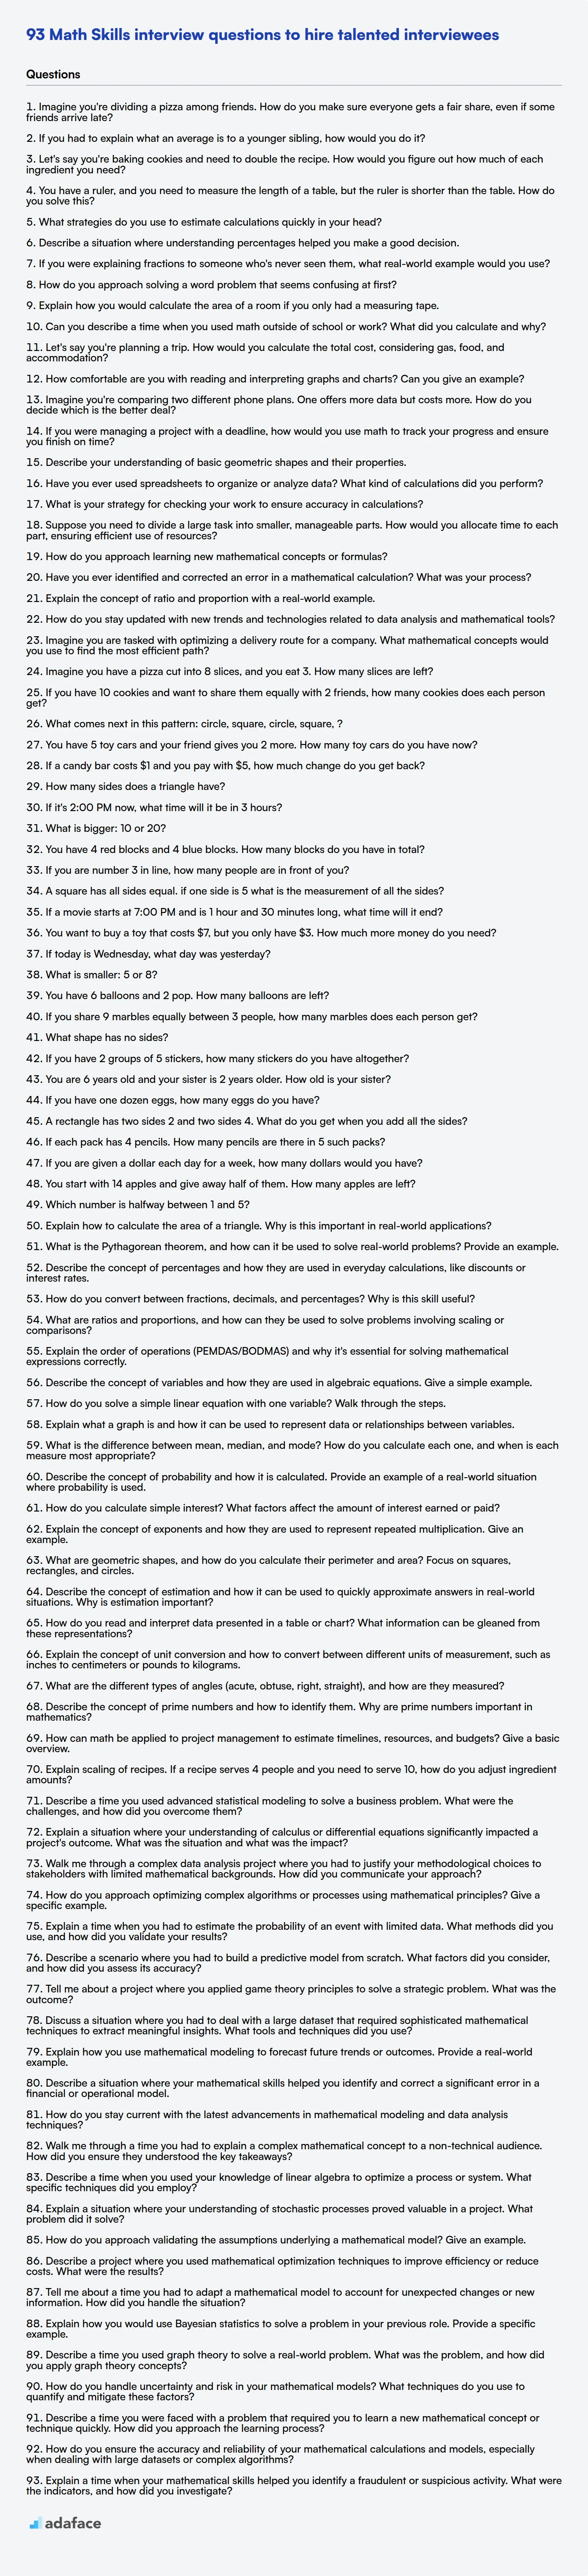
Math Skills Interview Questions FAQs
Why are math skills important in interviews?
Math skills questions help assess a candidate's problem-solving abilities, analytical thinking, and logical reasoning, which are beneficial for many roles.
What types of math skills are typically assessed in interviews?
Common math skills assessed include arithmetic, algebra, geometry, statistics, and calculus, depending on the role's requirements.
How can I prepare for math skills interview questions?
Review relevant mathematical concepts, practice solving math problems, and understand how these concepts apply to the job you are interviewing for.
Are there any tips for answering math skills interview questions?
Take your time, show your work, explain your reasoning, and ask for clarification if needed. Highlighting your thought process is as important as arriving at the correct answer.
What if I struggle with a math skills interview question?
Don't panic! Explain your thought process and demonstrate your willingness to work through the problem, even if you don't arrive at the answer immediately.
40 min skill tests.
No trick questions.
Accurate shortlisting.
We make it easy for you to find the best candidates in your pipeline with a 40 min skills test.
Try for freeRelated posts
Free resources

Join 1200+ companies in 80+ countries.
Try the most candidate friendly skills assessment tool today.

40 min tests.
No trick questions.
Accurate shortlisting.
No trick questions.
Accurate shortlisting.