
Basic Java Debugging interview questions
1. Imagine your program is a car, and it's not moving. How do you find out why it's stuck?
2. What's the simplest way to see what a variable is holding at a specific point in your code, like peeking inside a box?
3. If your program is doing something you didn't expect, how do you slow it down to watch it step-by-step?
4. What's a 'breakpoint,' and how does it help you catch errors in your Java code, like setting a trap for a bug?
5. How can you tell if a specific part of your code is even being run, like checking if a room is being used?
6. Your code throws an 'exception.' What does that even MEAN, and how do you find where it happened?
7. What's the difference between stepping 'into' a function and stepping 'over' it while debugging?
8. If you change a variable's value while debugging, does that permanently change your code?
9. What's the deal with 'watch expressions' in debuggers? Can you give a simple use case?
10. Can you debug code on a remote server? What tools or techniques are needed?
11. What are some common mistakes that lead to NullPointerExceptions, and how can you catch them early?
12. How do you debug multithreaded Java applications? What special challenges arise?
13. Explain the concept of a 'core dump' and how it aids in debugging production issues.
14. Let’s say your application is running very slow. How would you start investigating performance bottlenecks using debugging tools?
15. Your program compiles fine, but at runtime it is not working as expected. Where do you even start?
16. What are the advantages and disadvantages of using a debugger versus simply adding print statements to your code?
17. How can you use conditional breakpoints to stop your program only when a variable has a specific value?
18. Describe a time when you used debugging to solve a particularly tricky problem. What tools did you use, and what was your approach?
19. What are some best practices for writing code that is easy to debug?
20. How can you use a debugger to inspect the contents of a collection (like a List or Map) at runtime?
21. Explain how you might debug a unit test that is failing.
22. What are some common debugging keyboard shortcuts in your favorite Java IDE (like IntelliJ or Eclipse)? How do they speed up the debugging process?
23. How would you go about debugging a memory leak in a Java application?
24. Describe a situation where using a logging framework (like Log4j or SLF4J) would be more effective than using a debugger.
Intermediate Java Debugging interview questions
1. How do you set conditional breakpoints in your IDE, and why would you use them?
2. Explain the difference between 'step into', 'step over', and 'step out' in a debugger.
3. What is a watch expression in debugging, and how can it help you?
4. How can you debug a multithreaded Java application?
5. What are some common issues that can make debugging multithreaded code difficult?
6. Describe how you would use remote debugging to diagnose a problem in a deployed Java application.
7. What are some security considerations when using remote debugging?
8. How can you use logging frameworks (like Log4j or SLF4j) to aid in debugging?
9. What are some best practices for writing effective log messages?
10. Explain how to use memory analysis tools (like a heap dump analyzer) to diagnose memory leaks or excessive memory usage.
11. What are some common causes of memory leaks in Java applications?
12. How can you use profiling tools (like JProfiler or VisualVM) to identify performance bottlenecks in your code?
13. What are some common performance issues that can be identified using profiling tools?
14. Describe how you would debug a NullPointerException. What steps would you take to find the root cause?
15. How would you debug a situation where your application is throwing an unexpected exception?
16. How do you debug code that involves reflection?
17. Explain how you would debug code that uses lambda expressions or streams.
18. What are some challenges associated with debugging asynchronous code, and how can you overcome them?
19. How can you use assertions to help debug your code?
20. What are the limitations of using assertions for debugging?
21. Describe a situation where you used a debugger to solve a complex problem in a Java application.
22. Explain what a core dump is and how it can be used for debugging crashes.
23. How do you analyze thread dumps to diagnose deadlocks or performance issues?
24. What strategies do you use to debug integration tests?
25. How do you approach debugging code written by someone else, especially if it's poorly documented?
26. What are some common mistakes that developers make when debugging, and how can you avoid them?
27. Explain how you would debug a situation where a database query is performing slowly. What tools would you use?
Advanced Java Debugging interview questions
1. How can you debug memory leaks in a Java application without using a profiler?
2. Explain the process of debugging a multi-threaded application where threads are deadlocking.
3. What strategies can be used to debug performance bottlenecks in Java applications running in production?
4. How would you debug a Java application that is consistently throwing OutOfMemoryError?
5. What are some techniques to debug race conditions in concurrent Java programs?
6. Describe the steps you would take to debug a Java application using remote debugging.
7. How do you debug classloading issues or NoClassDefFoundError in Java?
8. Explain how you would debug a situation where a Java application is consuming excessive CPU resources.
9. What tools and techniques can you use to debug issues related to garbage collection in Java?
10. How would you approach debugging a problem where a Java application's response time is unpredictable?
11. Explain how to debug issues in Java applications that involve native libraries (JNI).
12. What are some advanced techniques for debugging asynchronous code in Java?
13. How would you debug a Java application that is interacting with a database and experiencing slow query performance?
14. Describe how to debug issues in a Java application that arise only under heavy load or stress.
15. How do you debug issues related to serialization and deserialization in Java?
16. Explain how you would debug a Java application experiencing network connectivity problems.
17. What techniques can you use to debug code generated by annotation processors in Java?
18. How would you approach debugging a Java application running inside a Docker container?
19. Describe the process of debugging a Java application deployed on a cloud platform like AWS or Azure.
20. How do you debug memory corruption issues in Java when using native libraries?
21. Explain how to debug issues related to bytecode manipulation libraries like ASM or Javassist.
22. What strategies can you use to debug complex regular expressions in Java?
23. How would you debug an issue where a Java application is not properly handling character encoding?
24. Describe how to debug security vulnerabilities in Java code, such as SQL injection or cross-site scripting.
25. How would you debug a Java application that's failing due to library version conflicts?
26. Explain your approach to debugging issues caused by reflection in Java.
27. What advanced techniques do you use to debug issues in reactive programming with frameworks like Reactor or RxJava?
28. How would you debug a Java application that is behaving differently in different environments (dev, staging, prod)?
29. Explain how to debug issues with caching mechanisms in Java applications, such as using Ehcache or Redis.
30. What is the process of debugging performance issues when using Java streams and parallel processing?
Expert Java Debugging interview questions
1. How would you debug a memory leak in a long-running Java application, and what tools would you use?
2. Explain how you would approach debugging a multi-threaded application where race conditions are suspected.
3. Describe a scenario where traditional debugging methods are ineffective, and how you would overcome this challenge.
4. How would you debug a performance bottleneck in a Java application without using a profiler?
5. What strategies do you use to debug issues in production environments without impacting users?
6. How would you debug a complex Spring application with numerous dependencies and layers?
7. Describe your experience debugging issues related to Java garbage collection. What tools and techniques do you employ?
8. How do you approach debugging intermittent or non-deterministic bugs in Java?
9. Explain how you would debug an application that is crashing with an OutOfMemoryError.
10. What debugging techniques do you use when dealing with asynchronous code, such as CompletableFuture or RxJava?
11. Imagine you're debugging code you didn't write. What's your process for understanding and fixing the bug?
12. How would you debug a Java application that is integrated with a message queue like Kafka or RabbitMQ?
13. How do you typically debug a deadlock situation in a Java application?
14. Describe your experience debugging complex SQL queries generated by a Java application. How do you optimize slow queries?
15. Explain how you would approach debugging a high CPU utilization issue in a Java application.
16. How do you debug issues related to class loading in Java, such as ClassNotFoundException or NoClassDefFoundError?
17. What are your preferred methods for debugging remote Java applications, and what are the challenges involved?
18. How do you debug a security vulnerability discovered in a Java application?
19. Let's say you're debugging a complex algorithm, how do you verify the correctness of the logic?
20. How do you debug issues related to serialization and deserialization in Java?
21. Explain your strategy for debugging a very large codebase with limited knowledge of the system.
22. How would you debug a situation where your application's logging isn't providing enough information?
23. Describe your process for debugging issues discovered during code review.

Debugging is a skill that separates a good Java developer from a great one; without it, finding and fixing errors can feel like searching for a needle in a haystack. Recruiters who want to ensure they're hiring the best Java talent need to assess debugging skills thoroughly, just like they would for assessing problem-solving skills.
This blog post provides a compilation of Java debugging interview questions, categorized by difficulty level, and includes multiple-choice questions to help you evaluate candidates effectively. We cover basic, intermediate, advanced, and expert-level questions, ensuring you're prepared to assess candidates with varying degrees of experience.
By using these questions, you can pinpoint candidates with strong debugging skills and identify those who can quickly resolve issues in Java applications. Before your interviews, consider using a coding debugging test to filter candidates who can debug.
Table of contents
Basic Java Debugging interview questions
Intermediate Java Debugging interview questions
Advanced Java Debugging interview questions
Expert Java Debugging interview questions
Java Debugging MCQ
Which Java Debugging skills should you evaluate during the interview phase?
Streamline Your Java Hiring with Skills Tests and Targeted Interview Questions
Download Java Debugging interview questions template in multiple formats
Basic Java Debugging interview questions
1. Imagine your program is a car, and it's not moving. How do you find out why it's stuck?
First, I'd check the obvious things, analogous to basic debugging. Is the "engine" (program) running? Are there any error messages (console output or logs)? Is the "fuel tank" (memory) empty or full? Is the "battery" (power supply/resources) dead?
Then I'd systematically investigate potential bottlenecks. Is the "gear" (program state) in the correct position? Are the "wheels" (key data structures or components) spinning freely – meaning are they initialized correctly and not locked by something? Are there any external blocks? Meaning are there any external dependencies that are not loading correctly? console.log() statements or a debugger would be used to inspect the state and flow of execution at crucial points.
2. What's the simplest way to see what a variable is holding at a specific point in your code, like peeking inside a box?
The simplest way to inspect a variable's value is often using a print statement or its equivalent in your language. For example:
- Python:
print(my_variable) - JavaScript:
console.log(my_variable) - Java:
System.out.println(my_variable);
Most debuggers also allow you to set breakpoints and inspect variable values at those points. This is a more robust approach, but using print or console.log is quick and easy for simple checks.
3. If your program is doing something you didn't expect, how do you slow it down to watch it step-by-step?
To slow down a program and observe its behavior step-by-step, I primarily use a debugger. Most IDEs (like VS Code, IntelliJ IDEA, or Eclipse) have built-in debuggers. I set breakpoints at key locations in the code where I want to pause execution. Then, I run the program in debug mode. When a breakpoint is hit, the program pauses, allowing me to inspect the values of variables, step through the code line by line, and trace the flow of execution.
Alternatively, if a debugger isn't readily available or the issue is intermittent, I might strategically add print statements (or logging) to output the values of important variables and the sequence of executed code blocks. This provides a timestamped record of the program's state, which can be analyzed to understand the unexpected behavior. For example, in python print(f"{timestamp()} Variable x: {x}") and in javascript console.log('variable x', x)
4. What's a 'breakpoint,' and how does it help you catch errors in your Java code, like setting a trap for a bug?
A breakpoint is a designated spot in your code where the execution of the program will pause. It's like setting a trap; when the program reaches that line, it stops, allowing you to examine the current state of your variables, the call stack, and other relevant information.
This helps you catch errors because you can step through your code line by line from the breakpoint, observing how values change and pinpointing exactly where something goes wrong. You can use it to inspect the values of variables and objects at that point of execution to understand if the code is behaving as expected. Debuggers like IntelliJ IDEA or Eclipse make it simple to set and manage breakpoints.
5. How can you tell if a specific part of your code is even being run, like checking if a room is being used?
There are several ways to determine if a specific part of your code is being executed. The simplest is to insert a print statement (or use a logger) at the location in question. If the print statement's output appears, then that section of code is running.
For more robust solutions, especially when debugging, you can use a debugger and set a breakpoint at the line of code you want to monitor. Alternatively, use an assertion to verify a condition that must be true if that code is reached, e.g., assert True, "This code should be running". Another technique is to use a simple counter that increments each time the relevant code block runs. This gives you a metric for how often the code is executed. For example:
count = 0
def my_function():
 global count
 # Some code
 count += 1
 # More code
 print(f"my_function has run {count} times")
6. Your code throws an 'exception.' What does that even MEAN, and how do you find where it happened?
An 'exception' in programming signifies an unusual or error condition that disrupts the normal flow of program execution. It's basically the program's way of saying, "Something went wrong, and I don't know how to proceed." To find where an exception happened, you generally look at the stack trace. The stack trace is a report that shows the sequence of function calls that led to the point where the exception was raised. It will typically include the file name, function name, and line number where the exception occurred, allowing you to pinpoint the source of the error. Most IDEs and debugging tools automatically display this stack trace when an exception is thrown. In some languages, you can also use try...catch blocks to handle exceptions, and log the stack trace information for debugging purposes if an exception occurs that wasn't anticipated. For example, in Python you can log the exception details using traceback.print_exc() within the except block.
7. What's the difference between stepping 'into' a function and stepping 'over' it while debugging?
When debugging, stepping 'into' a function means that the debugger will enter the function's code and allow you to step through each line of code within that function. This is useful when you need to examine the internal workings of a function to understand how it's behaving.
Stepping 'over' a function, on the other hand, executes the entire function as a single step. The debugger doesn't show you the individual lines of code within the function; it simply executes the function and moves to the next line of code in the calling function. This is useful when you're confident that the function is working correctly and you want to avoid spending time stepping through its code.
8. If you change a variable's value while debugging, does that permanently change your code?
No, changing a variable's value during debugging does not permanently change your code. It only alters the variable's value in the current debugging session within the memory, allowing you to test different scenarios without modifying the underlying source code.
Think of it as temporarily overriding the variable's value for experimentation. Once the debugging session ends, the code reverts to its original state as defined in your source files. To permanently change the variable, you would need to edit the source code and save the changes.
9. What's the deal with 'watch expressions' in debuggers? Can you give a simple use case?
Watch expressions in debuggers allow you to monitor the value of variables or expressions as your code executes. Instead of manually printing values or stepping through every line, you can define an expression, and the debugger will automatically update its value whenever it changes during program execution. This makes debugging much more efficient.
For example, if you're debugging a loop and suspect a variable count is not incrementing correctly, you can set count as a watch expression. The debugger will then display the current value of count with each iteration, helping you quickly identify if and where the increment logic fails. You can even use more complex expressions like count > limit, which evaluates to true or false based on count's current value. Using watch expressions like that are more powerful than just looking at the raw value of a variable because it gives you a flag to indicate a specific issue with your program or algorithm. For example, say you were checking for division by zero and set up a watch expression denominator == 0. You could then step through your code in the debugger and the debugger would alert you automatically and highlight the watch expression when the denominator became zero. This means that you don't have to continuously monitor this case or constantly check the variable, which can save you time.
10. Can you debug code on a remote server? What tools or techniques are needed?
Yes, debugging code on a remote server is possible. Several tools and techniques can be used:
Remote Debugging with an IDE: Many IDEs (like VS Code, IntelliJ IDEA, Eclipse) support remote debugging. This typically involves setting up a debugging server on the remote machine and connecting to it from your local IDE. You'll need to configure the IDE with the remote server's address, port, and any necessary authentication. Code can be stepped through as if it were running locally.
SSH Tunneling: If direct access to the debugging port on the remote server isn't possible due to firewall restrictions, you can use SSH tunneling to forward the port to your local machine. The command will look something like this:
ssh -L local_port:remote_host:remote_port user@remote_hostLogging: Strategic use of logging statements can help track the execution flow and variable values on the remote server. Use a logging framework (e.g.,
log4j,slf4j, Python'slogging) to direct output to a file. Tail the log file to monitor progress in real-time using thetail -fcommand.Remote Profiling: Tools like
jprofilerorVisualVM(for Java) can be used to profile application performance remotely. These provide insights into CPU usage, memory allocation, and thread activity.Debuggers (e.g., gdb): For compiled languages, debuggers like
gdbcan be used to attach to a running process on the remote server. However, it might require familiarity with command-line debugging.
11. What are some common mistakes that lead to NullPointerExceptions, and how can you catch them early?
Common mistakes leading to NullPointerException include: dereferencing a null object (calling a method or accessing a field on a variable that's null), returning null from a method when the caller expects a non-null value, improper initialization of objects, and using methods that can return null without checking the result. Also, unboxing a null Integer to an int causes a NullPointerException.
To catch them early, employ techniques such as: using static analysis tools (like FindBugs or SonarQube), enabling nullability annotations (@Nullable, @NonNull), writing unit tests that specifically check for null scenarios, using Optional to represent potentially absent values, and adopting defensive programming practices with null checks before accessing objects that might be null. For example:
String potentiallyNull = getString();
if (potentiallyNull != null) {
  System.out.println(potentiallyNull.length());
}
12. How do you debug multithreaded Java applications? What special challenges arise?
Debugging multithreaded Java applications presents unique challenges due to concurrency issues. Standard debugging techniques like breakpoints and stepping through code can inadvertently alter the program's behavior, masking the very problems you're trying to find, such as race conditions or deadlocks. I'd typically use logging strategically to trace the flow of execution across threads and the state of shared variables. Thread dumps are invaluable for identifying blocked threads and potential deadlock situations. Tools like VisualVM or JConsole can provide insights into thread activity and resource consumption. Also consider using concurrency testing frameworks like JCStress to uncover subtle concurrency bugs.
Special challenges include the Heisenbug effect (where the act of debugging changes the behavior), difficulty in reproducing issues consistently, and the complexity of reasoning about interleaving of thread execution. Careful design, thorough code reviews, and robust testing strategies are crucial to minimizing these issues.
13. Explain the concept of a 'core dump' and how it aids in debugging production issues.
A core dump is a snapshot of a process's memory at a specific point in time, usually when it crashes or terminates unexpectedly. It contains the process's code, data, stack, and register values, essentially preserving its state just before the failure. This is invaluable for debugging because it allows developers to examine the exact conditions that led to the crash, even in production environments where direct debugging is often impossible.
Core dumps aid in debugging production issues by providing a post-mortem analysis tool. Using debuggers like gdb, developers can load the core dump and inspect the call stack, variable values, and memory contents. This helps identify the root cause of the crash, such as null pointer dereferences, memory corruption, or unhandled exceptions. Analyzing core dumps can significantly reduce the time required to diagnose and fix issues that are difficult to reproduce in development or testing environments. For example, in gdb you can use bt to view the backtrace.
14. Let’s say your application is running very slow. How would you start investigating performance bottlenecks using debugging tools?
First, I'd identify the slow parts. I'd use a profiler (like those built into browser dev tools or tools like perf for backend code) to pinpoint functions or code blocks consuming the most time. If the bottleneck is frontend related, browser developer tools' performance tab can help analyze rendering times, JavaScript execution, and network requests. For backend issues, I'd use profiling tools specific to the language (e.g., Python's cProfile, Java's JProfiler, or Go's pprof).
Next, I'd analyze the identified hotspots. This could involve examining algorithm complexity, checking for unnecessary loops or redundant calculations, or investigating inefficient database queries. I'd look for common issues like N+1 query problems, excessive garbage collection, or blocking I/O. Once I have a theory, I would test out some fixes and measure the performance to validate that my approach is resolving the issue.
15. Your program compiles fine, but at runtime it is not working as expected. Where do you even start?
When a program compiles but doesn't work as expected at runtime, the first step is to reproduce the issue reliably. Once reproducible, start debugging. I would approach the issue by: 1. Understanding the expected behavior thoroughly by reviewing the requirements and relevant documentation. 2. Adding logging/print statements at strategic points in the code (especially function entry/exit points, and before/after key operations) to trace the program's execution flow and variable values. A debugger (like gdb, or IDE's built-in debugger) can be used to step through the code line by line. 3. Examining the logs carefully to identify where the actual behavior diverges from the expected behavior, narrowing down the problematic code section. 4. Using unit tests: if available, run the unit tests, and if unit tests don't exist, write them for the key logic which is failing. 5. Check for common runtime errors: These include null pointer exceptions, array index out-of-bounds errors, division by zero, resource leaks, and incorrect data types.
If the issue is not immediately apparent, try to isolate the failing code by creating a minimal reproducible example. Simplify the program by removing non-essential parts until the bug is still present but the code is much smaller and easier to understand. Tools like static analyzers can also help detect potential issues.
16. What are the advantages and disadvantages of using a debugger versus simply adding print statements to your code?
Debuggers and print statements are both used for understanding code behavior, but they differ in their approach. A debugger offers interactive control, allowing you to step through code line by line, inspect variables at specific points, set breakpoints, and even modify program state on the fly. This makes debugging complex issues significantly easier. Print statements, on the other hand, are simple to implement but require modifying the code.
Advantages of debuggers include precise control and inspection without altering source code permanently. Disadvantages are that they require debugger setup and can sometimes be overkill for simple debugging tasks. Print statements are quick and easy to implement but lack the interactive control and can clutter code with debugging statements. Debuggers are better for complex logic; print statements are suitable for quickly checking values or confirming execution paths. Using a debugger often leads to faster identification and resolution of bugs when compared to iterative print statement insertion and removal.
17. How can you use conditional breakpoints to stop your program only when a variable has a specific value?
Conditional breakpoints allow you to pause program execution only when a specified condition is true. Most debuggers support this feature. Instead of just setting a breakpoint at a line of code, you add a condition that must evaluate to true for the breakpoint to trigger.
For example, if you want to stop when a variable x equals 5, you'd set a conditional breakpoint at the relevant line. The exact syntax depends on the debugger you're using, but it's usually something like x == 5. When the program reaches that line, the debugger will evaluate x == 5. If it's true, the execution pauses; otherwise, the program continues without interruption. In VS Code, right click next to line number and select "Add Conditional Breakpoint". Then add a boolean expression such as my_variable == "some value".
18. Describe a time when you used debugging to solve a particularly tricky problem. What tools did you use, and what was your approach?
During a project involving a complex data pipeline, I encountered a particularly tricky bug where aggregated data was occasionally skewed. Initially, I suspected issues with the aggregation logic itself. My approach involved a combination of techniques. First, I used print statements strategically placed throughout the code to trace the flow of data and identify where the skewness was introduced. Then I used the Python debugger, pdb, to step through the code line by line at the point of failure, inspecting variable values. I also employed unit tests with carefully crafted edge cases, but none caught the error initially.
Ultimately, I discovered that the issue stemmed from an unexpected interaction between a third-party library used for data transformation and a specific type of malformed input data. The library was silently dropping rows instead of raising an error. To fix this, I added input validation to handle malformed data gracefully and ensure data consistency, followed by specific handling for this exceptional case. The key tool was the debugger coupled with a methodical approach to isolate the problem's origin, and enhanced logging which proved to be useful once the fix was applied.
19. What are some best practices for writing code that is easy to debug?
Writing debuggable code involves several practices. Firstly, write clear and concise code. Avoid overly complex logic. Use meaningful variable and function names. Keep functions short and focused on a single task to make understanding and tracing easier. Secondly, implement proper logging. Log important events, function calls, and variable values at different stages of execution, especially around potential error points. Use different log levels (e.g., debug, info, warning, error) to control verbosity. This can quickly pinpoint where issues arise. Thirdly, use assertions liberally to validate assumptions about your code. These are boolean checks that raise errors early when conditions are not met. Consider using a debugger. Learn to step through your code, inspect variables, and set breakpoints. Finally, practice good error handling. Use try...catch blocks to gracefully handle exceptions and log informative error messages, including stack traces. Don't swallow exceptions without logging them.
20. How can you use a debugger to inspect the contents of a collection (like a List or Map) at runtime?
Debuggers provide several ways to inspect collections. Most debuggers allow you to expand the collection object in the variables/watch window to view its contents. For List and Array types, you can see individual elements by their index. For Map types, you can see key-value pairs.
Some IDEs offer specialized views for collections that display the data in a more readable format (e.g., tables for lists of objects with their attributes). Also, conditional breakpoints can be useful. For example, you can set a breakpoint that triggers only when a specific element in a list has a particular value. You can then inspect the entire state when this condition is met. Some debuggers also offer features to evaluate expressions against the collection like LINQ in C# or streams in Java, allowing for complex filtering and inspection.
21. Explain how you might debug a unit test that is failing.
When a unit test fails, I start by carefully examining the test code itself and the code it's testing. I look for simple errors like incorrect assertions, off-by-one errors, or misunderstandings of the code's behavior. I then run the test in debug mode to step through the code line by line, inspecting variable values and program flow. I also check the test setup and teardown to ensure that the test environment is properly initialized and cleaned up.
Specifically, I would:
- Read the error message: Understand what the test expected and what it actually got.
- Reproduce the failure: Run the test repeatedly to ensure it consistently fails.
- Simplify the test: Remove unnecessary code from the test to isolate the problem.
- Use debugging tools: Set breakpoints, step through the code, and inspect variables. For example, in python using
pdbor IDE debugger. - Review recent changes: Identify any recent code changes that might have introduced the bug. Use
git blameif necessary. - Write more logs: Use print statements or logging to examine inner states of the tested function.
22. What are some common debugging keyboard shortcuts in your favorite Java IDE (like IntelliJ or Eclipse)? How do they speed up the debugging process?
Common debugging shortcuts in IntelliJ IDEA (and similar in Eclipse) include:
F8(Step Over): Executes the current line and moves to the next line in the same method. Speeds up the process by skipping over function calls if you aren't interested in debugging inside those calls.F7(Step Into): Steps into the method call on the current line. Useful for understanding the logic within a particular function. This helps to pinpoint exactly where the error may be occurring.Shift + F8(Step Out): Steps out of the current method, returning to the calling method. Quickly gets you back to the context where the method was called, avoiding unnecessary debugging within the called method.Alt + F9(Run to Cursor): Executes the code until the cursor position is reached. This is efficient when you want to quickly jump to a specific line of code without stepping through each line sequentially. Set the cursor and run to it to speed things up.Ctrl + F8(Toggle Breakpoint): Adds or removes a breakpoint on the current line. Breakpoints are crucial for pausing execution at specific points of interest. You can toggle them on or off as required.Ctrl + Shift + F9(Evaluate Expression): Allows evaluating expressions on-the-fly during debugging. Speeds up understanding the current state by evaluating an expression immediately. These shortcuts dramatically reduce the time spent debugging by enabling precise control over code execution and inspection of program state at specific points. They reduce reliance on mouse clicks and navigation through menus which is often slower.
23. How would you go about debugging a memory leak in a Java application?
To debug a memory leak in a Java application, I'd start by using profiling tools like VisualVM, JProfiler, or the Eclipse Memory Analyzer Tool (MAT). These tools can help identify objects that are consuming a lot of memory and aren't being garbage collected. I would monitor the heap usage over time to confirm there's a steady increase indicating a leak. I'd then take heap dumps at different intervals to compare object allocation and retention.
Specifically, I'd analyze the heap dumps to find the objects consuming the most memory, look at their references to understand why they aren't being collected, and identify the root causes of the leak, such as long-lived caches, static collections holding onto objects, or unclosed resources (streams, connections). After identifying the problematic code, I would refactor it to release resources properly, avoid unnecessary object retention, and ensure objects are eligible for garbage collection when they are no longer needed.
24. Describe a situation where using a logging framework (like Log4j or SLF4J) would be more effective than using a debugger.
Logging frameworks are more effective than debuggers in production environments or when dealing with intermittent issues that are hard to reproduce in a controlled debugging session. For example, consider a multi-threaded application where timing issues cause a rare deadlock. Debugging such a scenario is incredibly difficult because the act of attaching a debugger can alter the timing and prevent the deadlock from occurring.
Using a logging framework allows you to capture the state of the application at various points without significantly impacting performance. You can log relevant information like thread IDs, timestamps, and the values of key variables. Then, when the deadlock occurs in production, you can analyze the logs to understand the sequence of events that led to the problem. This approach is especially helpful for diagnosing issues in distributed systems or asynchronous processes, where traditional debugging methods are often impractical. A debugger would require reproducing the exact state but logging allows for investigation even after the event.
Intermediate Java Debugging interview questions
1. How do you set conditional breakpoints in your IDE, and why would you use them?
Conditional breakpoints in an IDE allow you to pause program execution only when a specific condition is met. In most IDEs, you set a breakpoint as usual, then edit its properties to add a condition (an expression that evaluates to true or false). The debugger will only stop at the breakpoint if the condition is true.
They're useful for debugging complex logic, especially within loops or when dealing with large datasets. For example, you might want to break only when a variable i reaches a certain value or when a specific object property meets a certain criteria. This avoids stopping the execution at every iteration and lets you focus on the exact scenario that causes the error. For example, in Java with IntelliJ, it may look like:
if (i == 10) {
 // Breakpoint here
}
Or, even better, in IntelliJ, you can right click on a breakpoint and then add a condition such as i == 10. This means that the breakpoint will only pause execution if i == 10.
2. Explain the difference between 'step into', 'step over', and 'step out' in a debugger.
In a debugger, 'step into' allows you to move into the function or method call on the current line. If the current line has a function call, 'step into' will take you to the first line of code within that function.
'Step over' executes the function call on the current line without stepping into it. The debugger will execute the entire function and then stop at the next line of code in the current function. Finally, 'step out' allows you to finish executing the current function and returns you to the line that called the current function.
3. What is a watch expression in debugging, and how can it help you?
A watch expression in debugging is a tool that allows you to monitor the value of a variable or expression as your code executes. You specify the variable or expression you want to watch, and the debugger will continuously display its current value, updating as the program progresses step-by-step or when a breakpoint is hit. This allows you to observe how values change during the program's execution.
Watch expressions are helpful for understanding program behavior, identifying bugs, and verifying that calculations are performed correctly. They are particularly useful when dealing with complex data structures or algorithms, as they allow you to see the immediate impact of code changes on specific variables, ultimately simplifying the debugging process. For example, watching i in a for loop can instantly show how many times it has looped already.
4. How can you debug a multithreaded Java application?
Debugging multithreaded Java applications can be challenging due to the inherent complexity of managing concurrent threads. Key strategies include using a debugger that supports thread inspection, such as the one in IntelliJ IDEA or Eclipse. These debuggers allow you to suspend specific threads, inspect their stack traces, and examine variable values, which aids in identifying race conditions, deadlocks, and other concurrency-related issues. Using logging frameworks (e.g., SLF4J, Log4j) is also crucial; strategically placing log statements can provide insights into the sequence of events and the state of variables across different threads.
Furthermore, specialized tools like thread dump analyzers (e.g., jstack, VisualVM) can help diagnose deadlocks by showing the current state of all threads, including their lock ownership and waiting status. Code reviews, especially focusing on synchronization mechanisms like synchronized blocks, locks, and concurrent collections (e.g., ConcurrentHashMap), are essential for identifying potential concurrency bugs early in the development process. Pay close attention to shared mutable state and ensure proper synchronization to prevent data corruption or unexpected behavior. Consider tools like static analysis that can automatically find potential concurrency issues.
5. What are some common issues that can make debugging multithreaded code difficult?
Debugging multithreaded code can be challenging due to several factors. Race conditions, where multiple threads access and modify shared resources concurrently without proper synchronization, can lead to unpredictable and inconsistent results. Deadlocks, where two or more threads are blocked indefinitely, waiting for each other to release resources, are another common issue. Also, the Heisenbug phenomenon can occur, where the act of debugging (e.g., adding print statements) alters the timing and behavior of the program, causing the bug to disappear or change. Memory corruption can also occur if multiple threads are able to write to the same memory location at the same time.
Furthermore, the non-deterministic nature of thread scheduling makes it difficult to reproduce bugs consistently. Context switching between threads can happen at any point, leading to different execution paths each time the program is run. Finally, inadequate logging can hinder the debugging process. Without sufficient information about thread activity and resource usage, it becomes difficult to trace the root cause of problems.
6. Describe how you would use remote debugging to diagnose a problem in a deployed Java application.
To diagnose a problem in a deployed Java application using remote debugging, I would first ensure the application is started with the necessary JVM arguments to enable remote debugging. This typically involves setting the -agentlib:jdwp option with appropriate parameters for the address and server mode. For example: -agentlib:jdwp=transport=dt_socket,server=y,suspend=n,address=5005
Then, using an IDE like IntelliJ IDEA or Eclipse, I would configure a remote debugging configuration to connect to the deployed application's host and port (e.g., localhost:5005). Once the connection is established, I can set breakpoints in the application's code, step through the execution, inspect variables, and evaluate expressions in real-time to understand the program's behavior and pinpoint the root cause of the issue. I'd analyze the stack traces and variable values to understand the flow and locate the source of the bug.
7. What are some security considerations when using remote debugging?
Remote debugging, while useful, introduces security risks. Exposing debug ports can allow attackers to gain control of the application being debugged, potentially executing arbitrary code or gaining access to sensitive data. It's crucial to restrict access to the debugging port using firewalls or VPNs, allowing only trusted IPs or networks to connect.
Other considerations include using strong authentication (if supported by the debugger), encrypting the debugging traffic, and disabling remote debugging in production environments. Furthermore, be aware of potential information leakage via debug logs or exposed application state during debugging sessions. Consider using a dedicated debugging environment that is isolated from the production environment.
8. How can you use logging frameworks (like Log4j or SLF4j) to aid in debugging?
Logging frameworks are invaluable for debugging. They allow you to strategically place log statements throughout your code to record the state of your application at various points in time. These logs provide a detailed trace of execution, making it easier to pinpoint the source of errors or unexpected behavior.
Specifically, you can use logging to:
- Track variable values: Log the values of important variables to understand how they change during execution.
- Monitor control flow: Log entry and exit points of functions and methods to follow the program's path.
- Record exceptions: Log exceptions (with stack traces) to identify the root cause of errors. Example, using SLF4j:
try { // Some code that might throw an exception } catch (Exception e) { logger.error("An exception occurred: ", e); } - Measure performance: Log timestamps at the beginning and end of critical sections to analyze performance bottlenecks.
- Capture user input: Log user input to understand how users are interacting with your application. Remember to be cautious about logging sensitive information.
9. What are some best practices for writing effective log messages?
Effective logging is crucial for debugging and monitoring applications. Some best practices include using a consistent logging level (e.g., DEBUG, INFO, WARN, ERROR) to indicate the severity of the message. Include contextual information like timestamps, thread/process IDs, and relevant data to pinpoint issues quickly. For example: 2024-01-01 12:00:00.000 [INFO] [Thread-1] User 'john.doe' logged in successfully.
Keep messages concise and meaningful, avoiding jargon or overly technical terms when possible. Structure log messages in a machine-readable format (e.g., JSON) if you plan to automate log analysis. Avoid logging sensitive information like passwords or API keys. Finally, don't over-log, as it can impact performance and make it harder to find important information; log only what is necessary for debugging and auditing.
10. Explain how to use memory analysis tools (like a heap dump analyzer) to diagnose memory leaks or excessive memory usage.
Memory analysis tools like heap dump analyzers are crucial for diagnosing memory leaks and excessive memory usage in applications. The process typically involves the following steps:
- Capture a Heap Dump: Trigger a heap dump when memory usage is high or suspected to be leaking. The method varies depending on the platform (e.g.,
jmapin Java, memory profilers in .NET or Python). - Analyze the Heap Dump: Use a heap dump analyzer (e.g., Eclipse Memory Analyzer Tool (MAT), VisualVM, dotMemory) to open the dump. These tools provide insights into object allocation, references between objects, and garbage collection roots.
- Identify Memory Leaks: Look for objects that are retained in memory longer than expected and are not being garbage collected. Common indicators are large numbers of similar objects, objects referenced by unexpected roots, or increasing memory consumption over time without corresponding application activity.
- Investigate Excessive Memory Usage: Analyze the object distribution to understand which object types consume the most memory. Identify large collections or caches that may be growing unboundedly.
- Code Inspection: Once potential leak sources are identified, examine the relevant code sections to understand why objects are not being released or are being retained unexpectedly. Look for issues like unclosed resources, static collections holding references, or event listeners that are not being unregistered. Fix the code and redeploy the application. Remember to monitor memory usage after the fix to confirm that the issue is resolved.
Example (Java):
// Potential memory leak if listener is not unregistered
public class MyClass {
    private static List<MyListener> listeners = new ArrayList<>();

    public void registerListener(MyListener listener) {
        listeners.add(listener);
    }
}
11. What are some common causes of memory leaks in Java applications?
Memory leaks in Java occur when objects are no longer needed by the application but the garbage collector fails to reclaim them, leading to gradual memory exhaustion. Some common causes include:
- Static Fields: Holding object references in static fields throughout the application's lifetime.
- Unclosed Resources: Failing to close resources like input streams, database connections, and network sockets.
- Unbounded Collections: Accumulating objects in collections (e.g., lists, maps) without removing them when they are no longer needed.
- Inner Classes: Non-static inner classes holding implicit references to their outer class instances.
- Listeners: Failing to unregister listeners that hold references to other objects. This causes the objects listened to, and potentially more, to persist even when they are no longer actively used.
- String Interning: Excessive or uncontrolled use of
String.intern()can lead to memory leaks in some older JVM implementations. - Custom Caches: Implementing custom caching mechanisms without proper eviction policies.
12. How can you use profiling tools (like JProfiler or VisualVM) to identify performance bottlenecks in your code?
Profiling tools like JProfiler and VisualVM help identify performance bottlenecks by providing insights into CPU usage, memory allocation, and thread activity. To use them effectively, first, connect the profiler to your running application. Then, run the application through scenarios that exhibit slow performance. The profiler will then collect data about which methods are consuming the most CPU time (CPU profiling) or allocating the most memory (memory profiling). You can then analyze the profiler's reports to pinpoint the problematic code sections.
Specifically, look for 'hot spots' in CPU profiling reports – these are methods with high self-time or total-time. In memory profiling, examine object allocation patterns to identify memory leaks or excessive object creation. For example, high CPU usage might indicate inefficient algorithms or excessive calculations, while excessive memory allocation might point to memory leaks or suboptimal data structures. JProfiler or VisualVM helps visualise these patterns with graphs and call trees to make analysis easier.
13. What are some common performance issues that can be identified using profiling tools?
Profiling tools help identify performance bottlenecks in applications. Common issues include: excessive CPU usage, often due to inefficient algorithms or tight loops; memory leaks, where memory is allocated but not released, leading to increased memory consumption and potential crashes; excessive garbage collection, indicating frequent object creation and destruction; I/O bottlenecks, where the application spends too much time waiting for disk or network operations; and lock contention, where threads are blocked waiting for access to shared resources.
Specifically, profiling can reveal issues like:
- Hotspots: Functions consuming the most CPU time.
- Memory allocation patterns: High allocation rates or large object sizes.
- Blocking calls: Time spent waiting on I/O or locks.
- Garbage collection details: Frequency, duration, and the amount of memory reclaimed.
Identifying these issues allows developers to optimize their code and improve application performance. For example, if a profiler shows that a particular function
foo()is a hotspot, the code withinfoo()can be analyzed for algorithmic improvements. Or if excessive garbage collection is observed, object lifetimes can be examined and optimized using object pooling or other techniques.
14. Describe how you would debug a NullPointerException. What steps would you take to find the root cause?
When debugging a NullPointerException, I would first carefully examine the stack trace provided in the error message. This trace pinpoints the exact line of code where the exception occurred. I would then focus on the variables used on that line, especially any object references that could potentially be null. I'd use my IDE's debugger to inspect the values of these variables just before the exception is thrown.
Next, I'd trace back where those variables were initialized or assigned. I'd look for any conditional logic or external factors that could have led to the variable being assigned a null value. Common causes are uninitialized fields, return values from methods that can return null, or accessing elements of a collection without checking if it's empty. I'd also use logging statements to track the values of variables at different points in the program's execution to help narrow down the origin of the null value. I may also use defensive programming by adding null checks.
15. How would you debug a situation where your application is throwing an unexpected exception?
When debugging an unexpected exception, I'd start by examining the exception's stack trace to pinpoint the exact line of code where it originated. I would then analyze the surrounding code, looking for potential causes such as null references, incorrect data types, or logic errors. I'd also check the input values to the function or method in question to ensure they are within the expected range. Debugging tools are critical to inspect variable values at runtime.
Next, I would consider the application's logs to see if there are any relevant error messages or warnings that occurred before the exception. If the issue is not immediately apparent, I would use a debugger to step through the code, line by line, to observe the program's state and identify the precise moment the exception is thrown. Adding temporary logging statements strategically, especially when debugging in production, can help trace the flow of execution and variable values without halting the system. Consider using try-catch blocks around potentially problematic sections to handle the exception gracefully and provide more informative error messages. Finally, I would look at using tools for APM and tracing such as Jaeger, Zipkin etc. for distributed tracing.
16. How do you debug code that involves reflection?
Debugging code that uses reflection can be tricky because the types and methods being invoked are often determined at runtime. Here's how I approach it:
First, use a debugger and set breakpoints before and after the reflective call. Inspect the Type objects, method/field names, and arguments being passed. Verify that the correct types are being loaded and that the method/field names are spelled correctly. Logging the values of these variables is also invaluable. For example, in Java, System.out.println("Type: " + myType + ", Method: " + methodName); can help. Second, pay close attention to exception handling. Wrap the reflective call in a try-catch block and log the exception details (including the stack trace) to understand exactly what went wrong. Common issues include ClassNotFoundException, NoSuchMethodException, IllegalAccessException, and InvocationTargetException.
17. Explain how you would debug code that uses lambda expressions or streams.
Debugging lambda expressions and streams requires a slightly different approach than traditional code. Since lambdas are often anonymous and streams involve chained operations, pinpointing the exact source of an error can be tricky.
Several strategies can be employed. First, use peek() to inspect the stream's elements at various stages. For example, stream.peek(System.out::println).filter(x -> x > 5).peek(System.out::println) lets you see the elements before and after the filtering. Second, when possible, break down complex stream pipelines into smaller, more manageable steps. Assign intermediate results to variables and inspect them. Third, leverage your IDE's debugging capabilities. Set breakpoints within the lambda expressions themselves to examine the values of variables at that specific point. Additionally, when using streams, converting the stream to a list using collect(Collectors.toList()) at intermediate stages can aid in debugging by allowing direct inspection of the collected elements. Finally, ensure proper logging. Strategic log statements can provide valuable insights into the flow of data and the state of variables within lambda expressions and streams, especially when dealing with complex operations.
18. What are some challenges associated with debugging asynchronous code, and how can you overcome them?
Debugging asynchronous code presents unique challenges due to its non-linear execution flow. Key challenges include:
- Inverted Call Stack: Traditional call stacks are less helpful because the point of origin for an asynchronous operation might be far removed from the actual error.
- Race Conditions: Difficult to reproduce reliably, as they depend on timing and scheduling.
- State Management: Managing shared state across multiple asynchronous operations can lead to unexpected behavior.
- Error Handling: Errors might not be caught properly if promises are not handled or awaited correctly.
To overcome these challenges:
- Use async/await: This makes asynchronous code look and behave more like synchronous code, improving readability and debuggability.
- Implement proper error handling: Always catch errors in promises using
.catch()ortry/catchblocks withawait. - Utilize debugging tools: Modern browser developer tools and Node.js debuggers provide features for stepping through asynchronous code and inspecting promise states. For example, logging can be achieved by inserting
console.log()statements to track the execution flow and variable values at different points in the code. Also utilize features like breakpoints or stepping through code execution, enabling a closer look at the state of variables and the order of execution. - Consider state management libraries: Libraries like Redux or Zustand can help manage complex application states in a predictable way.
19. How can you use assertions to help debug your code?
Assertions are boolean expressions that you expect to be true at a specific point in your code. They help debug by halting program execution immediately when an assertion fails, pinpointing the exact location and condition causing the problem. This is far more effective than tracing through code or waiting for a general error later on. For example, assert(variable != null) ensures a variable isn't unexpectedly null at that point, and can immediately tell you if it is.
Using assertions is like adding a runtime check for assumptions you've made while coding. This is especially useful for catching unexpected states or invalid inputs early in the development process. It provides a faster and more direct route to identifying bugs compared to manual debugging or relying solely on logging.
20. What are the limitations of using assertions for debugging?
Assertions are primarily for verifying assumptions about the state of the program at specific points. They are typically disabled in production environments, meaning they can't be relied upon to catch errors or provide debugging information when the software is deployed to users. This is a key limitation, as many bugs only surface in production.
Furthermore, assertions should not be used for handling expected errors or validating user input. They are intended for detecting internal inconsistencies or programming errors that should never occur. Using assertions for error handling can lead to unexpected program behavior when assertions are disabled. assert(input != null) is bad. Always check for null and provide exception messages when expecting input. Assertions also typically provide limited or no context about the error. You only know that the assertion failed, but the specific conditions that led to the failure may not be readily apparent. Debugging complex issues with assertions alone can be difficult without additional logging or debugging tools.
21. Describe a situation where you used a debugger to solve a complex problem in a Java application.
I once worked on a Java application where a user's profile information wasn't updating correctly after they submitted a form. The front-end was sending the data, and the back-end seemed to be processing it without errors, but the changes weren't reflected in the database or the user's view. I suspected a data mapping or transaction issue within the service layer.
To debug this, I set breakpoints in the service layer methods responsible for updating the user profile, specifically before and after the database update calls. Using the debugger, I stepped through the code, inspecting the values of the user object at each stage. I discovered that the id field, used in the database update query, was being inadvertently set to null due to a faulty data transformation. Once I identified this, I fixed the transformation logic, and the profile updates started working as expected. The debugger allowed me to pinpoint the exact line of code causing the issue, saving considerable time compared to relying solely on logging.
22. Explain what a core dump is and how it can be used for debugging crashes.
A core dump is a snapshot of a process's memory at a specific point in time, typically when the process crashes or terminates abnormally. It contains the process's code, data, stack, and register values. Core dumps are invaluable for debugging because they allow developers to examine the state of the program immediately before the crash, helping to identify the root cause.
To use a core dump for debugging, developers typically use a debugger like gdb. They load the core dump file and the corresponding executable into the debugger, and then inspect the program's state at the time of the crash. This includes examining the call stack to see the sequence of function calls that led to the crash, inspecting the values of variables to identify any unexpected data, and using other debugger features to understand the program's behavior. Analyzing the core dump will often reveal the location of the error in the source code.
23. How do you analyze thread dumps to diagnose deadlocks or performance issues?
To analyze thread dumps for deadlocks, I'd first look for the BLOCKED or WAITING states. Deadlocks are often indicated by multiple threads blocked indefinitely, each waiting for a resource held by another. Thread dump analyzers (like jstack, VisualVM, or online tools) visually show these dependencies. I'd identify the threads involved, the resources they're waiting for (locks, monitors), and the threads holding those resources.
For performance issues, I'd focus on threads spending excessive time in RUNNABLE state, indicating CPU bottlenecks, or WAITING state on I/O or network operations. I'd examine the stack traces to pinpoint the problematic code sections. Tools like jcmd can assist in obtaining thread dumps and diagnosing the issue. For example, jcmd <pid> Thread.print.
24. What strategies do you use to debug integration tests?
When debugging integration tests, I focus on isolating the problem. I start by carefully examining the test logs for error messages, stack traces, and any unusual behavior. I use logging extensively within the integration tests and the services being tested to track the flow of data and pinpoint where the integration is failing. Paying close attention to timestamps can also help correlate events across different systems.
Often, I'll simplify the test case to isolate the specific integration point that's failing. This might involve mocking external dependencies or using smaller data sets. Using debuggers (like those in IDEs or remote debuggers for deployed services) allows me to step through the code and inspect variables at runtime. If the tests involve databases, I verify the data integrity directly in the database. Finally, tools for tracing distributed systems can be invaluable in complex integrations where multiple services are involved. For example, if testing a REST API I might use curl or Postman to make direct API calls and verify responses independently of the test suite.
25. How do you approach debugging code written by someone else, especially if it's poorly documented?
When debugging someone else's poorly documented code, I start by trying to understand the overall architecture and how the different parts are supposed to interact. I'll look for entry points, major control flows, and critical data structures. I use debugging tools to step through the code, paying close attention to variable values and program flow. If the documentation is poor, I generate my own by adding comments or creating diagrams as I go.
Specifically, I might:
- Use a debugger to trace execution and inspect variables.
- Add temporary logging statements to understand the code's behavior (e.g.,
console.log()orprint()statements). - Look for unit tests. Even poorly written tests can give insights into intended functionality.
- Break down the problem into smaller, more manageable parts.
- Use version control to examine the history of changes, seeking clues about the original intent.
26. What are some common mistakes that developers make when debugging, and how can you avoid them?
Common debugging mistakes include: not understanding the problem fully before jumping to solutions, which leads to inefficient debugging; making assumptions about the code's behavior without verifying them, resulting in chasing phantom bugs; and failing to reproduce the bug consistently, hindering effective analysis and resolution.
To avoid these, start by thoroughly understanding the problem through clear error messages, logs, and user reports. Then, reproduce the bug reliably in a controlled environment. Use debugging tools like breakpoints and step-by-step execution to inspect variables and understand the code flow. Don't forget to write tests that specifically trigger the bug to ensure it's truly fixed. And consider using tools like a debugger or logging frameworks to provide insight.
For example, if a user reports an error when saving a file:
- Make sure you can reproduce the error.
- Attach a debugger to the code and set a breakpoint where the saving happens. Check the value of the variables and ensure it is what you expect it to be.
- Log the values of the variables, and file names/paths involved in the function, to have a clear understanding of what happened.
27. Explain how you would debug a situation where a database query is performing slowly. What tools would you use?
To debug a slow database query, I'd start by identifying the problematic query using database monitoring tools or slow query logs. Then, I'd use EXPLAIN to analyze the query execution plan, looking for things like full table scans, missing indexes, or inefficient join operations. I would also check server resource utilization (CPU, memory, I/O) to rule out hardware bottlenecks. Finally, I might examine database configuration settings to ensure they're optimized for the workload.
Tools I would utilize include:
- Database Profilers (e.g.,
pg_stat_statementsin PostgreSQL, Performance Insights in AWS RDS) - Query analyzers (
EXPLAIN) - System monitoring tools (e.g.,
top,htop,vmstat, CloudWatch) - Database-specific monitoring dashboards (e.g., pgAdmin, MySQL Workbench)
Advanced Java Debugging interview questions
1. How can you debug memory leaks in a Java application without using a profiler?
Debugging memory leaks in Java without a profiler can be achieved through several techniques. First, meticulously review your code for potential sources of leaks, paying close attention to areas where objects are created and potentially not released. Common culprits include:
- Static fields: Holding onto objects for longer than necessary.
- Unclosed resources: Streams, connections, etc., that aren't properly closed in
finallyblocks. - Event listeners: Listeners that aren't unregistered when no longer needed.
- Caches: Continuously growing caches without eviction policies.
Secondly, utilize heap dumps and analyze them with tools like jhat (Java Heap Analysis Tool) or jmap. Generate a heap dump using jmap -dump:live,format=b,file=heapdump.bin <pid>. Then load it into jhat heapdump.bin and browse the objects to identify objects occupying large memory chunks. Another effective way is to use verbose garbage collection (-verbose:gc) to track GC activity and identify if the heap is constantly growing and reaching full GC cycles frequently. Examine the GC logs to understand memory allocation and identify potential leak candidates.
2. Explain the process of debugging a multi-threaded application where threads are deadlocking.
Debugging deadlocks in multi-threaded applications involves identifying the threads involved and the resources they are waiting for. Common techniques include using thread dumps to examine the stack traces of all threads, revealing their current state (e.g., blocked, waiting, runnable). Look for threads stuck waiting on locks that other threads are holding, creating a circular dependency. Tools like debuggers (e.g., GDB, Visual Studio Debugger, or Java Debuggers) allow you to inspect variables and step through the code of individual threads to understand the sequence of events leading to the deadlock.
Prevention is also key. Common strategies involve avoiding circular dependencies in lock acquisition, using lock timeouts to prevent indefinite blocking, and employing higher-level concurrency abstractions that manage locking automatically. Also consider a careful code review with an emphasis on lock order to prevent this.
3. What strategies can be used to debug performance bottlenecks in Java applications running in production?
Debugging performance bottlenecks in production Java applications requires a strategic approach. Start with monitoring tools like JConsole, VisualVM, or Prometheus to identify problematic areas (high CPU usage, excessive memory consumption, slow response times). Analyze thread dumps (jstack) to pinpoint blocked or long-running threads. Consider using profiling tools such as Java Flight Recorder (JFR) for detailed insights, but be mindful of the overhead. Log important operations with timestamps to trace request flows. Examine database queries for inefficiencies, use EXPLAIN PLAN where applicable, and review garbage collection logs to identify potential memory leaks or tuning opportunities.
After identifying the bottleneck, focus on targeted code analysis and testing. Create a test environment mirroring production to safely reproduce the issue and test potential fixes. Consider using techniques like code reviews and static analysis tools to find inefficiencies. Also, check configurations such as JVM settings (heap size, garbage collection algorithm) and database connection pools and ensure they're properly tuned for production load. Remember to thoroughly test any changes before deploying them to production.
4. How would you debug a Java application that is consistently throwing OutOfMemoryError?
To debug a Java application consistently throwing OutOfMemoryError, start by identifying the type of memory leak. Use tools like VisualVM, JConsole, or Eclipse Memory Analyzer (MAT) to take heap dumps. Analyze the heap dump to find which objects are consuming the most memory and identify potential memory leaks, such as collections growing unbounded or objects not being properly garbage collected. Also, check JVM arguments to ensure sufficient heap space is allocated. Experiment with different heap sizes (-Xms, -Xmx) to see if it alleviates the problem.
Next, review the code for potential issues. Look for places where large objects are created and not released, or where object references are unintentionally kept alive. Profile the application using a profiler like JProfiler or YourKit to identify memory-intensive operations. Pay special attention to loops, data structures, and resource management (e.g., closing streams, releasing database connections). If using libraries, ensure they are up to date and properly configured to avoid memory leaks. Consider using techniques such as object pooling or caching to reduce the amount of memory being used by the application. If the issue still persists, perform code reviews with other team members to identify potential issues.
5. What are some techniques to debug race conditions in concurrent Java programs?
Debugging race conditions in concurrent Java programs can be challenging. Here are some techniques:
- Code Reviews: Carefully review code for potential race conditions, focusing on shared mutable state and synchronization. Look for missing or incorrect synchronization.
- Static Analysis Tools: Use tools like FindBugs, SpotBugs, or PMD, which can detect potential concurrency issues, including race conditions, deadlocks, and other threading problems.
- Dynamic Analysis / Concurrency Testing Tools: Use tools like ThreadSanitizer (TSan), or Intel Inspector. These tools detect race conditions by instrumenting the code and monitoring memory accesses at runtime.
- Logging and Tracing: Add detailed logging to track the execution of threads, especially around critical sections and shared resource access. Use timestamps to analyze the order of events and identify potential conflicts. Tools like
jstackand profilers can also help. - Increase Concurrency: Ironically, making a system more concurrent (e.g., increasing the number of threads) can sometimes surface race conditions more quickly.
- Deterministic Concurrency Testing (DCT): Use tools that enforce a deterministic execution order to reliably reproduce race conditions.
- Use Happens-Before Relationships: Ensure proper synchronization to establish happens-before relationships between threads accessing shared variables.
- Isolate and Reproduce: Try to isolate the code section where the race condition is likely to occur. Create a minimal, reproducible test case. This makes debugging much easier.
- Assertions: Use assertions to check for expected conditions before and after accessing shared resources. This can help detect when data is being corrupted or accessed in an unexpected state.
- Thread Dumps: Analyze thread dumps (
jstack) to identify blocked threads or threads waiting on locks. This can provide clues about potential deadlocks or contention issues that might be related to race conditions.
6. Describe the steps you would take to debug a Java application using remote debugging.
To debug a Java application remotely, I would first ensure the remote application is started with the appropriate JVM options to enable debugging. This usually involves adding -agentlib:jdwp=transport=dt_socket,server=y,suspend=n,address=*:5005 to the Java command-line arguments (replacing 5005 with an available port). The suspend=n option makes the application start immediately; suspend=y waits for the debugger to connect.
Next, I would configure my IDE (e.g., IntelliJ IDEA, Eclipse) to connect to the remote JVM. This involves creating a new remote debugging configuration, specifying the host (the remote machine's IP or hostname) and the port specified in the JVM options (e.g., 5005). Finally, I'd set breakpoints in my IDE's code and start the remote debugging session. The IDE should then connect to the remote JVM, and execution will pause at the breakpoints, allowing inspection of variables and stepping through code.
7. How do you debug classloading issues or NoClassDefFoundError in Java?
Debugging NoClassDefFoundError or classloading issues in Java involves several steps. First, verify the classpath to ensure the required JAR file or directory containing the missing class is included. Use -verbose:class to trace classloading activity and identify where the JVM is searching. Look for discrepancies between the expected classpath and the actual classpath being used by the application (e.g., IDE configuration, command-line arguments, or environment variables).
Next, check for classloader conflicts, especially in web application servers or OSGi environments. Multiple classloaders may load different versions of the same class, leading to unexpected behavior. Investigate the classloader hierarchy and delegation model. Tools like JProfiler or VisualVM can help visualize classloader structures. Common causes include missing dependencies, incorrect packaging, or classloader isolation issues. If the error occurs after the application starts, it suggests a runtime dependency problem, possibly related to dynamic classloading or reflection. Verify library versions and dependencies for compatibility.
8. Explain how you would debug a situation where a Java application is consuming excessive CPU resources.
First, I would identify the process ID (PID) of the Java application consuming excessive CPU. I'd use tools like top or htop on Linux/macOS or Task Manager on Windows. Once I have the PID, I'd use jstack <PID> or jcmd <PID> Thread.print to obtain thread dumps. Analyzing the thread dumps reveals the threads that are currently running and their states. Look for threads that are running for a long time (e.g., in a loop or waiting on a resource) or are blocked. I can also use Java profilers like VisualVM or Java Mission Control to get more detailed insights into CPU usage, memory allocation, and garbage collection behavior. Profilers provide a graphical interface to identify hot spots in the code and potential performance bottlenecks. From there, I'd examine the code related to the identified threads and optimize it or resolve any resource contention issues. Tools like jstat can provide insights into garbage collection performance which could also be causing CPU spikes.
9. What tools and techniques can you use to debug issues related to garbage collection in Java?
Debugging garbage collection (GC) issues in Java involves several tools and techniques. Verbose GC logging is crucial; use JVM options like -verbose:gc and -XX:+PrintGCDetails to get detailed information about GC events, heap usage, and timings. Analyzing these logs helps identify patterns like frequent full GCs or long GC pauses. Heap dumps (using jmap or jconsole) provide a snapshot of the heap, allowing you to inspect object distribution and identify potential memory leaks or excessive object creation. Tools like VisualVM, JProfiler, and YourKit offer graphical interfaces for monitoring GC activity, analyzing heap dumps, and profiling memory allocation.
Techniques include identifying memory leaks by comparing heap dumps over time, tuning GC parameters (like -Xms, -Xmx, and GC algorithms) based on application needs, and profiling code to find hotspots of object allocation. Understanding GC algorithms and how they behave under different conditions is also helpful. Pay attention to objects that are unexpectedly retained in memory; these could indicate coding errors preventing proper garbage collection. Utilizing code analysis tools and performing regular code reviews can also assist in finding potential memory-related issues early on. Consider using a tool like jcmd to trigger GC programmatically for testing purposes.
10. How would you approach debugging a problem where a Java application's response time is unpredictable?
To debug unpredictable Java application response times, I'd start by gathering data. This includes monitoring CPU usage, memory consumption (heap and non-heap), and garbage collection activity. Tools like VisualVM, JConsole, or JProfiler can be invaluable here. I would look at thread dumps to identify any blocked or waiting threads, which could be causing delays.
Next, I'd analyze the logs for any errors or warnings. Enabling more verbose logging temporarily might reveal performance bottlenecks, especially in database interactions or external service calls. If I suspect network issues, I'd use tools like tcpdump or Wireshark to analyze network traffic. Profiling the code using tools like the built-in Java Flight Recorder or async-profiler helps pinpoint slow methods. Also, consider using APM tools like New Relic or Dynatrace for enhanced monitoring and tracing capabilities, especially in complex microservice architectures.
11. Explain how to debug issues in Java applications that involve native libraries (JNI).
Debugging JNI issues in Java applications can be tricky because it involves both Java and native code. Here's a breakdown of common techniques:
- Logging: Add extensive logging in both your Java and native code to track the flow of execution and variable values. Use
System.out.printlnin Java and appropriate logging mechanisms in your native language (e.g.,printfin C/C++). Pay special attention to the values of arguments passed between Java and native code. - JVM crash logs: When the JVM crashes due to native code issues, it usually generates a crash log (also called a hs_err_pid.log file). Examine this log carefully. It typically contains information about the thread that crashed, the native function involved, and the memory addresses at the time of the crash. These can give clues to the source of error, like segmentation faults.
- Native Debugger: Use a native debugger like GDB (for Linux) or Visual Studio Debugger (for Windows) to step through the native code execution. You'll need to attach the debugger to the running Java process. This requires configuring your IDE/debugger correctly and often involves setting breakpoints in your native code.
jdbcan be used to debug java code at the same time. - Memory tools: Use tools like Valgrind (for Linux) to detect memory leaks and other memory-related errors in your native code. These errors can often cause JVM crashes. For example, to check for memory leaks:
valgrind --leak-check=full java MyJavaApp
- Check JNI signatures: Ensure that the JNI signatures (method names and parameter types) in your Java code exactly match the corresponding native function declarations. A mismatch can lead to unexpected behavior or crashes.
- Simplified test cases: Isolate the JNI code by creating smaller, focused test cases that only exercise the native functionality. This makes it easier to identify and reproduce the issue.
12. What are some advanced techniques for debugging asynchronous code in Java?
Debugging asynchronous code in Java can be challenging due to its non-linear execution flow. Some advanced techniques include:
- Using CompletableFuture.exceptionally() and .handle(): These methods allow you to catch and handle exceptions that occur in asynchronous operations, providing a central point to log or react to errors. Code example:
future.exceptionally(ex -> { System.err.println("Error: " + ex); return null; }); - Leveraging Reactive Debugging: Tools designed for reactive streams, like RxJava or Project Reactor, offer debugging features like stepping through streams and inspecting emitted values. This helps understand data flow and pinpoint issues within the asynchronous pipeline.
- Thread-local Context Propagation: Asynchronous tasks often run in different threads. Use thread-local variables or frameworks like
TransmittableThreadLocalto propagate contextual information (e.g., request IDs, user IDs) across threads for better traceability during debugging. Logging this context information allows you to correlate logs from different threads. - Asynchronous Logging: Employ asynchronous logging frameworks (e.g., Log4j2 with AsyncAppender) to avoid blocking the execution of asynchronous tasks. Synchronous logging can introduce delays and affect the timing of events, making debugging harder.
- VisualVM or JProfiler with Asynchronous Profiling: These tools can help visualize thread activity and identify bottlenecks in asynchronous code. Pay attention to thread pools, queue sizes, and task execution times.
13. How would you debug a Java application that is interacting with a database and experiencing slow query performance?
To debug slow Java application database query performance, I'd start by enabling database query logging to see the actual queries being executed. Tools like log4jdbc or database-specific logging features are helpful. I'd then use a database profiling tool (e.g., pgAdmin for PostgreSQL, MySQL Workbench for MySQL, or SQL Server Profiler) to identify slow-running queries and analyze their execution plans. Java profilers like VisualVM or JProfiler can pinpoint bottlenecks in the Java code itself, such as inefficient data processing or excessive database calls.
Next, I'd examine the database schema, indexes, and statistics to ensure they are optimized for the queries being executed. Missing indexes or outdated statistics are common causes of slow performance. I would also consider query optimization techniques, such as rewriting queries to be more efficient, using prepared statements to prevent SQL injection and improve performance and implement caching strategies to reduce database load. Finally, I will verify that the database server has enough resources, such as CPU, memory, and disk I/O, to handle the workload.
14. Describe how to debug issues in a Java application that arise only under heavy load or stress.
Debugging Java applications under heavy load requires a strategic approach. Start by using profiling tools like VisualVM, JProfiler, or YourKit to identify performance bottlenecks, such as slow database queries, excessive garbage collection, or CPU-intensive operations. These tools help pinpoint the exact methods and lines of code causing the most significant performance impact. Also, monitor system resources like CPU, memory, and network I/O using tools like top, vmstat, or monitoring dashboards.
Next, implement logging strategically, focusing on key operations and potential failure points. Use correlation IDs to track requests across different components. Consider using distributed tracing tools like Zipkin or Jaeger to understand request flows and latencies across microservices. After identifying potential issues, try to reproduce the issue in a controlled environment like a staging server using load testing tools like JMeter or Gatling. This will allow you to test fixes and optimizations without affecting the production environment.
15. How do you debug issues related to serialization and deserialization in Java?
Debugging serialization/deserialization issues in Java involves several techniques. First, ensure that the class implements Serializable and has a serialVersionUID defined to manage versioning issues. Use logging extensively to print object states before serialization and after deserialization, helping pinpoint data loss or corruption. Common issues include:
NotSerializableException: A field is not serializable; either make it transient, serializable, or handle serialization manually.InvalidClassException: Incompatible class changes; verifyserialVersionUIDand class structure.- Data corruption: Inspect serialized data (e.g., using
ObjectOutputStreamandObjectInputStream) and deserialized objects carefully, using a debugger if necessary. Tools like a debugger and logging frameworks are invaluable for stepping through the process and inspecting object states at each stage. Examine the stack traces for exceptions to understand the root cause. Using external libraries like Jackson or Gson may require separate debugging techniques specific to the library.
16. Explain how you would debug a Java application experiencing network connectivity problems.
To debug network connectivity issues in a Java application, I'd start by verifying basic network settings using command-line tools like ping, traceroute (or tracert on Windows), and netstat (or ss). I'd check if the application server is reachable and if there are any firewall rules blocking traffic. I'd also inspect the application's configuration files to ensure the correct hostnames, ports, and protocols are being used.
Next, within the Java application itself, I'd enable detailed logging to capture network-related events. I would use tools like Wireshark to capture network packets and analyze the communication between the client and server, looking for errors, delays, or dropped packets. Code inspection using a debugger is essential to verify any network socket usage, correct API calls, and proper exception handling around network operations. Also, confirm that necessary libraries like Apache HTTP Client or OkHttp have their dependencies correctly configured in Maven/Gradle.
17. What techniques can you use to debug code generated by annotation processors in Java?
Debugging annotation processors can be tricky, but several techniques help. First, logging is crucial. Use Messager (provided by the ProcessingEnvironment) to output information at various stages of processing. Differentiate logging levels (note, warning, error) to manage verbosity. Always check the compiler output for these messages.
Second, leverage standard Java debugging tools, but configure them appropriately. Annotation processors run within the compiler's JVM. To debug effectively, you'll need to attach a remote debugger (e.g., via IntelliJ IDEA or Eclipse) to the JVM process running the compiler. You'll need to configure your build tool (Maven, Gradle) to pass the necessary JVM arguments for remote debugging during compilation. For example, in Maven you would configure the maven-compiler-plugin to include the -agentlib:jdwp=transport=dt_socket,server=y,suspend=y,address=5005 argument. suspend=y will pause the JVM until a debugger connects, allowing you to step through the annotation processor's code. Remember to recompile to reflect changes after debugging.
18. How would you approach debugging a Java application running inside a Docker container?
Debugging a Java application in Docker involves several approaches. One common method is using remote debugging. You'd configure your Java application to listen for a debugger connection on a specific port (e.g., 5005). Then, in your Dockerfile or docker-compose.yml, you'd expose this port. Finally, you would connect your IDE (like IntelliJ IDEA or Eclipse) to the container's IP address (or localhost if port forwarding is set up) and the specified port. Your IDE then allows you to set breakpoints, step through code, and inspect variables as if the application were running locally.
Another approach is using logging and monitoring. Utilize a robust logging framework (like Log4j or SLF4j) to output detailed logs to a persistent volume or a central logging system (e.g., ELK stack). Analyze these logs to identify the source of errors or unexpected behavior. Tools like docker logs can also provide real-time output from the container's standard output and standard error streams. Tools like JConsole or VisualVM can be used for monitoring the JVM inside the container, but might require adjustments to the container's network configuration to allow connections.
19. Describe the process of debugging a Java application deployed on a cloud platform like AWS or Azure.
Debugging a Java application on cloud platforms like AWS or Azure involves several steps. First, configure remote debugging for your application. This typically involves opening a specific port on your cloud instance's firewall and configuring your Java application to listen on that port for debugging connections. Use the JVM's -agentlib:jdwp=transport=dt_socket,server=y,suspend=n,address=<port> option. Then, use your IDE (like IntelliJ IDEA or Eclipse) to create a remote debugging configuration that connects to the specified port on your cloud instance's public IP address.
Alternatively, use logging extensively. Implement robust logging using a framework like Log4j or SLF4J to capture relevant application states and error messages. These logs can then be accessed through the cloud platform's logging services (e.g., AWS CloudWatch, Azure Monitor). Another approach is using distributed tracing tools like Jaeger or Zipkin, often integrated with platforms like Kubernetes. These tools help track requests across services and pinpoint the source of issues by visualizing the call flow and performance metrics.
20. How do you debug memory corruption issues in Java when using native libraries?
Debugging memory corruption issues in Java when using native libraries can be challenging. Here's an approach:
First, use tools like Valgrind (specifically Memcheck) or AddressSanitizer (ASan) when running the Java application. These tools can detect memory leaks, invalid reads/writes, and other memory-related errors within the native code. Execute your Java code through java -agentlib:path_to_your_agent if required, ensure the libraries are loaded correctly, and let valgrind/ASan do the memory tracing. Secondly, carefully review the JNI code for potential buffer overflows, incorrect pointer arithmetic, or memory leaks. Pay special attention to array access, string handling, and object creation/deletion within the native code. Use debugging techniques such as gdb or print statements to trace the execution flow and inspect memory contents. A common mistake is incorrect usage of Get<PrimitiveType>ArrayElements and Release<PrimitiveType>ArrayElements, where not releasing the array will cause a memory leak.
21. Explain how to debug issues related to bytecode manipulation libraries like ASM or Javassist.
Debugging bytecode manipulation can be tricky because you're working with low-level instructions. A common approach involves generating the modified class file to disk and then using a disassembler like javap -c to inspect the generated bytecode. Comparing the original bytecode with the modified bytecode can pinpoint the exact location of the error. You can also use a debugger like IntelliJ IDEA or Eclipse to step through the code that's performing the bytecode manipulation, setting breakpoints and inspecting variables to understand how the bytecode is being modified. Logging the bytecode instructions being added or modified can also be helpful.
When using ASM, the CheckClassAdapter can be very useful. It validates the generated bytecode to ensure it adheres to the Java Virtual Machine Specification. Enable verbose logging within your bytecode manipulation code to track the transformations. Also, write thorough unit tests that cover various scenarios to catch potential issues early on. These unit tests should ideally execute the modified bytecode and verify the expected behavior.
22. What strategies can you use to debug complex regular expressions in Java?
Debugging complex regular expressions in Java can be tricky. Several strategies can help:
- Break down the regex: Decompose the complex expression into smaller, more manageable parts. Test each part individually to ensure it behaves as expected. Use online regex testers like regex101.com which provide detailed explanations and matching information.
- Use logging or print statements: Insert
System.out.println()statements or use a logging framework to print the input string and the results of each regex operation (e.g.,matches(),find()). This allows you to track the matching process step-by-step. - Simplify the input data: Start with very simple input strings and gradually increase complexity. This helps isolate the source of the problem.
- Utilize a regex debugger (if available): Some IDEs or third-party tools offer regex debuggers that visualize the matching process. Consider using them if your IDE supports it.
- Test cases: Create a comprehensive set of test cases that cover various scenarios, including positive and negative matches. Use JUnit or similar testing frameworks to automate the testing process. Example:
assertTrue(Pattern.compile("a*").matcher("aaaa").matches()); - Escape special characters: Double-check that special characters in the regex are properly escaped (e.g.,
\.for a literal dot,\\for a literal backslash). Incorrect escaping can lead to unexpected behavior. - Use comments: Add comments to the regular expression itself using the
(?#comment)construct to explain the purpose of different parts. For example:Pattern regex = Pattern.compile("(?#Match a digit)\d+");
23. How would you debug an issue where a Java application is not properly handling character encoding?
To debug character encoding issues in a Java application, I'd start by verifying the encoding used at different stages:
First, I would check the application's source code to ensure the correct character encoding is being used when reading and writing data (e.g., InputStreamReader, OutputStreamWriter with the appropriate charset like UTF-8). I'd also examine database connections to confirm the database encoding matches the application's. Next, I'd review the server's (or environment's) default encoding settings (e.g., file.encoding system property). Tools like a debugger or logging libraries (SLF4J) can help inspect the actual byte streams and character values being processed. Monitoring the application's behavior with different input character sets can further help isolate the source of the issue.
24. Describe how to debug security vulnerabilities in Java code, such as SQL injection or cross-site scripting.
Debugging security vulnerabilities in Java requires a multi-faceted approach. For SQL injection, parameterized queries or prepared statements are crucial. Debugging involves examining the generated SQL queries to ensure user input isn't directly concatenated. Use a debugger to inspect variable values at runtime to confirm input sanitization and proper escaping. Static analysis tools can also detect potential SQL injection flaws.
For Cross-Site Scripting (XSS), focus on input validation and output encoding. Input validation should occur on the server-side. Debugging output encoding entails examining the HTML source code to ensure that user-supplied data is properly encoded before being rendered in the browser. Use the browser's developer tools to inspect the HTML, and confirm any user input is properly escaped to prevent script execution. Ensure that any data displayed from the database or request parameters in web pages is correctly encoded (e.g., using libraries like OWASP's ESAPI).
25. How would you debug a Java application that's failing due to library version conflicts?
To debug Java library version conflicts, I'd start by identifying the conflicting libraries. Tools like mvn dependency:tree (if using Maven) or gradle dependencies (if using Gradle) can visualize the dependency tree and highlight version conflicts. IDEs often provide similar dependency analysis tools. Once identified, I would try to resolve the conflict by explicitly specifying the correct version in my project's dependency management file (pom.xml for Maven, build.gradle for Gradle). This forces the project to use the specified version, potentially overriding transitive dependencies. Also, I can use dependency exclusion to prevent a conflicting library from being included. Finally, I would test the application thoroughly after making changes to ensure the conflict is resolved and no new issues are introduced. Sometimes upgrading or downgrading a parent dependency will resolve the problem.
26. Explain your approach to debugging issues caused by reflection in Java.
Debugging reflection issues in Java often requires a strategic approach. First, I would enable verbose logging, particularly around reflection calls, to track class loading, method access, and field manipulation. Using java.lang.reflect.Proxy's debug flags can be useful too.
Next, I'd carefully examine the stack traces, paying close attention to InvocationTargetException as it often wraps the actual exception thrown by the reflected method. I also double-check the accessibility of members using setAccessible(true) cautiously. Finally, I'd verify that the classloader context is appropriate, especially in environments with multiple classloaders, as reflection can be sensitive to class visibility issues arising from incorrect classloaders. Unit tests exercising the reflection code with various inputs are invaluable. I also might use a debugger to step through the reflection calls and inspect the objects being accessed.
27. What advanced techniques do you use to debug issues in reactive programming with frameworks like Reactor or RxJava?
When debugging reactive streams, I leverage several advanced techniques. I use log() operator extensively to trace signals (onNext, onError, onComplete) and data flowing through the stream. This includes specifying log levels and categories for granular control. Furthermore, I employ breakpoints in the IDE (e.g., IntelliJ's reactive streams debugger) and conditional breakpoints based on data values to pause execution at specific points in the stream's pipeline to inspect the data and state.
Another useful technique is to utilize checkpoint() operator to add contextual information to the stack trace when errors occur, making it easier to pinpoint the origin of the error within the reactive pipeline. For more complex scenarios, using tools like Micrometer's Tracing capabilities helps to visualize the entire flow of requests across multiple services involved in the reactive stream processing, giving a complete view of execution.
28. How would you debug a Java application that is behaving differently in different environments (dev, staging, prod)?
Debugging environment-specific Java application behavior involves a systematic approach. First, I'd ensure consistent configurations across environments by using a configuration management tool or environment variables. Then, I'd focus on logging: enabling detailed logging (including DEBUG level) in all environments and comparing the logs to identify discrepancies in code execution, data access, or external service calls. I'd also use remote debugging tools against non-production environments (staging) to step through the code and inspect variable values in real-time, focusing on the areas identified by log analysis. This helps pinpoint the exact line of code causing the differing behavior.
Furthermore, I'd investigate potential issues related to the JVM, libraries, and dependencies. I would make sure the Java version is consistent and compare the versions of the libraries used. Also, I would use tools like JConsole or VisualVM to monitor JVM performance metrics (memory usage, CPU utilization) in each environment. Finally, I'd thoroughly analyze differences in environment configurations, such as database connections, network settings, and file system permissions. If it interacts with external services, verify the service endpoints are configured correctly for each enviornment.
29. Explain how to debug issues with caching mechanisms in Java applications, such as using Ehcache or Redis.
Debugging caching issues in Java applications, especially with tools like Ehcache or Redis, involves several strategies. First, logging is crucial. Increase logging levels around cache interactions (put, get, evict) to observe cache behavior in real-time. For Ehcache, check the Ehcache configuration file for logging settings. For Redis, use the MONITOR command (with caution in production due to performance impact) or enable slow query logging. Then, monitoring cache statistics is key. Ehcache provides statistics via its API (hits, misses, evictions). Redis offers similar metrics via INFO command or tools like RedisInsight. Analyze hit ratios and eviction counts to identify performance bottlenecks. Finally, use profiling and debugging tools. Use a Java profiler (like VisualVM or JProfiler) to analyze application performance and identify hotspots related to cache usage. Use a debugger to step through the code and inspect cache contents and behavior during runtime. Inspect the keys being used and verify their correctness. Remember to check cache expiry configurations to ensure they are appropriate for your use case.
30. What is the process of debugging performance issues when using Java streams and parallel processing?
Debugging performance issues with Java streams and parallel processing involves several key steps. First, profile the application using tools like VisualVM, Java Mission Control, or YourKit to identify hotspots and bottlenecks. Pay close attention to CPU usage, memory allocation, and garbage collection activity. Second, carefully examine the stream pipeline for inefficient operations such as blocking calls, unnecessary data transformations or context switching. For parallel streams, check for excessive thread contention or situations where the overhead of parallelization outweighs the benefits. Use techniques like reducing the scope of parallel operations or adjusting the ForkJoinPool size to optimize performance. Consider using sequential streams to compare performance. Finally, use proper logging and metrics to monitor the program's runtime behavior.
Specifically, look for operations that might be non-splittable or short-circuiting in a way that reduces parallelism. For example:
findFirst()can limit parallelism.limit()early in the stream can reduce the amount of work to parallelize.- Stateful operations like
distinct()orsorted()can introduce bottlenecks, especially if performed in parallel. - Minimize the use of
synchronizedblocks as they can kill performance. - Measure the performance impact of switching from sequential to parallel using JMH.
Expert Java Debugging interview questions
1. How would you debug a memory leak in a long-running Java application, and what tools would you use?
To debug a memory leak in a long-running Java application, I would first identify the symptoms: increasing memory usage over time, leading to potential OutOfMemoryError exceptions. Then, I'd use a memory profiler like VisualVM or Eclipse Memory Analyzer Tool (MAT) to capture heap dumps at different intervals. These dumps can be analyzed to identify objects that are continuously growing and not being garbage collected. Common causes include static collections holding onto objects, unclosed resources (streams, connections), or cached data that is not properly evicted.
I would focus on identifying the root cause by analyzing the heap dumps for dominant objects and their references. I would also look at code related to object creation and resource management in the areas highlighted by the profiler. Tools like jmap and jstack can be used for basic heap and thread analysis, but memory profilers offer more in-depth analysis capabilities. Finally, fix the code by releasing unused resources, using appropriate data structures (e.g., using weak references if appropriate), and ensuring resources are correctly closed in finally blocks. After applying the fix, I would monitor the application to confirm that the memory leak is resolved.
2. Explain how you would approach debugging a multi-threaded application where race conditions are suspected.
Debugging multi-threaded applications with suspected race conditions requires a systematic approach. I would start by trying to reproduce the issue consistently, as race conditions are often intermittent. Tools like thread sanitizers (-fsanitize=thread in GCC/Clang) can automatically detect many race conditions at runtime. Careful code reviews, focusing on shared resources and synchronization mechanisms (locks, semaphores, atomic operations), are crucial. Logging relevant data (timestamps, thread IDs, variable values) before and after critical sections can help pinpoint the source of contention.
If runtime tools fail, I'd employ debugging techniques such as:
- Reducing the number of threads: Simplifies the execution and makes it easier to track the program flow.
- Adding strategic delays: Inserting
sleep()calls in specific threads can alter the timing and potentially expose the race condition more reliably. - Using a debugger (e.g., gdb) with thread-aware features: Set breakpoints in multiple threads and examine the call stack and variable values when a potential race condition occurs. Observe the order of execution and locking behavior.
- Consider static analysis tools: They can sometimes identify potential race conditions based on code patterns without actually running the code.
It is critical to use proper synchronization, minimize shared mutable state, and thoroughly test the code under realistic load conditions to avoid race conditions in the first place.
3. Describe a scenario where traditional debugging methods are ineffective, and how you would overcome this challenge.
Consider debugging a race condition in a multi-threaded application. Traditional methods like stepping through code in a debugger often alter the timing, making the race condition disappear. The act of observing changes the behavior (Heisenbug). To overcome this, I'd use techniques like:
- Logging: Implement detailed logging with timestamps to capture the sequence of events across threads. Tools like
perfon Linux can profile CPU usage and thread scheduling. - Static Analysis: Employ static analysis tools to identify potential race conditions by examining the code for shared resources and lock usage.
- Fuzzing / Stress Testing: Create a test environment that simulates high load and contention to increase the likelihood of triggering the race condition. Address Sanitizer (ASan) and ThreadSanitizer (TSan) are very useful.
4. How would you debug a performance bottleneck in a Java application without using a profiler?
Without a profiler, debugging a Java performance bottleneck involves a more manual, observational approach. Start by identifying the symptoms: high CPU usage, slow response times, increased memory consumption, or excessive disk I/O. Log execution times of key methods and code blocks to pinpoint slow operations. Analyze thread dumps (jstack) to identify blocked or busy threads. Look for common performance pitfalls such as:
- Excessive I/O: Optimize database queries, reduce disk access, and use caching.
- Lock contention: Analyze thread dumps for blocked threads waiting on locks. Use techniques like lock striping or concurrent data structures.
- Inefficient algorithms: Review code for O(n^2) or worse complexity. Consider using more efficient data structures and algorithms.
- Memory leaks: Monitor memory usage and look for objects that are never garbage collected. Tools like
jmapcan help analyze heap dumps. - Garbage collection overhead: Monitor GC logs to identify excessive GC pauses. Tune GC settings or reduce object creation.
Use tools like top (Linux) or Task Manager (Windows) to monitor system resource usage. jstat can provide basic JVM statistics.
5. What strategies do you use to debug issues in production environments without impacting users?
When debugging in production, my priority is to minimize user impact. I leverage strategies like: Feature Flags: Enable/disable features for a subset of users to test fixes or isolate problems.
Log Aggregation and Analysis: Centralized logging (using tools like Splunk, ELK stack) allows me to analyze patterns, identify errors, and trace requests without directly accessing production servers. I use non-intrusive logging levels such as DEBUG or TRACE sparingly and ensure they don't expose sensitive data. Shadow Traffic: Mirror production traffic to a staging environment to reproduce and debug issues without affecting real users. Monitoring and Alerting: Proactive monitoring with tools like Prometheus and Grafana help me identify anomalies early. Alerts are configured to notify me of performance degradations or errors, allowing for quick intervention. Code-level strategies: I utilize techniques like remote debugging (with extreme caution and proper security measures) and dynamic logging configuration changes to get more insights into running code, but only when necessary and with minimal impact. Finally, thorough testing in staging environments that closely mimic production is crucial to prevent issues from reaching production in the first place.
6. How would you debug a complex Spring application with numerous dependencies and layers?
Debugging a complex Spring application requires a strategic approach. I'd start by analyzing logs using tools like grep, awk, or dedicated log management systems (e.g., ELK stack) to identify error patterns and pinpoint the failing component. Enable debug logging in Spring (logging.level.root=DEBUG in application.properties or application.yml) to get more detailed insights. Utilize a debugger (e.g., within IntelliJ IDEA or Eclipse) to step through the code, focusing on areas identified by log analysis. Set breakpoints at key integration points, such as service calls, repository interactions, and controller entry points.
Furthermore, leveraging Spring Boot Actuator endpoints (e.g., /health, /metrics, /trace) is crucial for monitoring application health and performance. Review thread dumps to identify potential deadlocks or long-running processes. For database issues, examine SQL queries executed by the application using database profiling tools or Spring's logging capabilities. Consider using tools like JProfiler or VisualVM for in-depth JVM profiling to detect memory leaks or performance bottlenecks. Finally, write unit and integration tests to isolate components and ensure their correct behavior.
7. Describe your experience debugging issues related to Java garbage collection. What tools and techniques do you employ?
My experience debugging Java garbage collection (GC) issues involves identifying and resolving performance bottlenecks caused by inefficient memory management. I've used tools like VisualVM, JConsole, and jstat to monitor heap usage, GC activity (frequency, duration), and identify memory leaks. I analyze GC logs (enabled via -verbose:gc, -Xlog:gc:*, or similar JVM options) to understand GC algorithms being used, their performance characteristics, and potential problem areas such as long GC pauses. Common techniques include heap dumps analysis using tools like MAT (Memory Analyzer Tool) to pinpoint objects consuming excessive memory and identify memory leaks. I also focus on code reviews to identify potential memory leaks, inefficient object creation, and improper resource handling (e.g., not closing streams or connections). Optimizing code for object reuse, reducing object allocation, and tuning GC parameters are also strategies I use.
8. How do you approach debugging intermittent or non-deterministic bugs in Java?
Debugging intermittent or non-deterministic bugs in Java requires a systematic approach. I start by trying to reproduce the issue reliably, even if it means running the code in a loop or under specific conditions. If reproduction is difficult, I focus on gathering as much information as possible when the bug occurs, including logs, thread dumps, and heap dumps. These can be analyzed to identify potential race conditions, deadlocks, or memory leaks.
Tools and techniques I use include enhanced logging with timestamps and thread IDs, using debuggers to step through code when the issue arises, and potentially introducing assertions to validate assumptions at various points. For concurrency issues, tools like jstack to examine thread states and jmap to analyze memory usage become essential. Consider using techniques like isolated unit tests, property-based testing, and chaos engineering to expose edge cases and non-deterministic behavior. Profilers can help to identify performance bottlenecks, which can sometimes be related to intermittent issues.
9. Explain how you would debug an application that is crashing with an OutOfMemoryError.
To debug an OutOfMemoryError, I'd start by identifying the type of memory leak (heap or native). For a heap OOM, I'd use a profiler (like VisualVM or JProfiler) or heap dump analysis tools (like Eclipse MAT) to examine the heap and identify which objects are consuming the most memory. Analyzing object allocation patterns and retention paths helps pinpoint the source of the leak. Common causes include caching without proper eviction strategies, holding onto large datasets longer than necessary, or creating many short-lived objects excessively. Code review focusing on object creation and lifecycle management is crucial.
For native memory leaks, tools like perf or specialized native memory tracking tools are needed. Identifying the code path allocating the native memory is key. This often involves issues in native libraries or incorrect usage of native memory interfaces (e.g., forgetting to free() allocated memory). Also it may be required to analyze logs and metrics to determine if there are patterns prior to the error that might shed light on the underlying issue, like sudden spikes in memory usage.
10. What debugging techniques do you use when dealing with asynchronous code, such as CompletableFuture or RxJava?
When debugging asynchronous code like CompletableFuture or RxJava, I rely on several techniques. Logging is crucial; I strategically insert log statements to trace the flow of execution and observe the values of variables at different stages. I pay close attention to thread names to understand which thread is executing which part of the code. Using a debugger with breakpoints also helps, but I often need to use conditional breakpoints because stepping through asynchronous code can be challenging.
Specifically, I use tools like jstack to examine thread dumps for blocked threads or deadlocks. For RxJava, using doOnNext, doOnError, doOnComplete, and doOnSubscribe operators is invaluable for observing events in the stream. In CompletableFuture, I leverage exceptionally and handle to catch and log exceptions. Finally, understanding the underlying thread pools and schedulers is key; monitoring their utilization can reveal performance bottlenecks or unexpected behavior. I also make use of reactive debugging tools when available.
11. Imagine you're debugging code you didn't write. What's your process for understanding and fixing the bug?
My process for debugging unfamiliar code involves a systematic approach. First, I try to reproduce the bug consistently. Then, I start by reading the relevant code, focusing on the area where the bug is suspected to occur. I look for clues such as error messages, unusual variable values, and unexpected control flow. I might add logging statements (console.log() or similar) to trace the execution path and inspect variable states at different points. If I have access to a debugger, I'll use it to step through the code and examine the call stack. I also try to understand the intended functionality of the code by reading any available documentation or comments. Often, I'll use version control tools like git blame to understand the code's history and identify the author who might have more context.
Once I have a better understanding of the code, I formulate a hypothesis about the cause of the bug. I then test my hypothesis by making small, incremental changes to the code and retesting. I use a process of elimination to narrow down the source of the problem. If the bug is still unclear, I'll try to simplify the code to isolate the problem. I ask for help from more experienced colleagues if I get stuck. Finally, after fixing the bug, I write a unit test to prevent it from recurring.
12. How would you debug a Java application that is integrated with a message queue like Kafka or RabbitMQ?
Debugging a Java application integrated with a message queue like Kafka or RabbitMQ involves several strategies. First, logging is crucial. Implement detailed logging around message production, consumption, and processing. Use unique correlation IDs for tracing messages across different services. Check the logs of both the Java application and the message queue broker itself for errors or unusual activity.
Second, use debugging tools specific to the message queue and your application. For Kafka, tools like kafka-console-consumer can help you inspect messages directly from the topics. For RabbitMQ, the management UI provides insights into queues, exchanges, and message flows. In your Java application, utilize a debugger (like IntelliJ IDEA's debugger) to step through the code, inspect variables, and identify any bottlenecks or exceptions during message processing. Also, consider using message tracing tools (like Jaeger or Zipkin) for end-to-end visibility.
13. How do you typically debug a deadlock situation in a Java application?
To debug a deadlock in Java, I'd start by obtaining thread dumps using jstack, jcmd, or VisualVM. These dumps show the current state of all threads, including what locks they hold and what locks they are waiting to acquire. Analyzing the thread dumps, I'd look for threads that are blocked indefinitely, waiting for a resource held by another blocked thread, creating a circular dependency.
Specifically, I'd focus on the BLOCKED state in the thread dump. The "waiting to lock" section indicates the object monitor a thread is waiting on. By examining the owner thread of that monitor, and tracing its lock dependencies, the deadlock cycle can be revealed. Tools like Eclipse or IntelliJ IDEA can also assist in visualizing thread states and dependencies from the thread dump.
14. Describe your experience debugging complex SQL queries generated by a Java application. How do you optimize slow queries?
Debugging complex SQL queries generated by Java applications often involves a multi-pronged approach. I typically start by logging the generated SQL statements along with the input parameters. This allows me to reproduce the query outside of the application, using tools like psql or SQL Developer, where I can examine the execution plan using EXPLAIN or similar commands. I'll also inspect the Java code to understand how the query is constructed and which parameters are being used. This helps identify potential issues in the application logic contributing to the slow query. Often ORM tools generate inefficient queries and tracing the queries helps identify the root cause.
15. Explain how you would approach debugging a high CPU utilization issue in a Java application.
To debug a high CPU utilization issue in a Java application, I'd start by identifying the problematic process using tools like top or htop. Then, I'd use jstack <pid> or jcmd <pid> Thread.print to capture thread dumps. Analyzing these dumps reveals which threads are consuming the most CPU time (often stuck in loops or performing intensive operations). Tools like VisualVM or Java Mission Control can provide a visual representation of CPU usage and thread activity, making it easier to pinpoint the bottleneck.
Once I've identified the culprit threads, I'd examine the corresponding code. Common causes include inefficient algorithms, excessive logging, tight loops, frequent garbage collection, or blocking I/O operations. Profiling the application using a tool like YourKit or JProfiler can provide more detailed insights into method-level CPU usage and memory allocation patterns. After identifying the root cause, I'd implement the necessary code optimizations (e.g., using more efficient data structures, caching results, reducing logging levels, or improving I/O handling) and redeploy the application.
16. How do you debug issues related to class loading in Java, such as ClassNotFoundException or NoClassDefFoundError?
When debugging ClassNotFoundException or NoClassDefFoundError in Java, focus on the classpath and class availability. First, verify the classpath: Ensure the required JAR or class file is actually present in the classpath used during compilation and runtime. Use -verbose:class JVM option or a class loader debugging tool to identify where the class loading is failing.
Second, check for dependencies: A NoClassDefFoundError might indicate that a class was available during compile time but not at runtime, usually due to a missing or different version of a dependent library. Review dependency management configurations (e.g., Maven or Gradle), and confirm that all necessary libraries and versions are included in the deployed application. Also, be aware of class loader hierarchies in application servers or OSGi environments, as this could lead to classes being visible to some parts of the application but not others. Use the jps and jinfo commands to inspect the classpaths and system properties of running JVM processes.
17. What are your preferred methods for debugging remote Java applications, and what are the challenges involved?
My preferred methods for debugging remote Java applications include using a remote debugger (like the one in IntelliJ IDEA or Eclipse) connected to the application via JDWP (Java Debug Wire Protocol). This involves starting the Java application with specific JVM arguments to enable debugging on a particular port. I also frequently use logging frameworks (like Logback or SLF4J) extensively, setting appropriate logging levels to capture relevant information without overwhelming the system. Creating thread dumps (jstack) and heap dumps (jmap) are also helpful for diagnosing issues like deadlocks or memory leaks.
The challenges involved can include network latency, security considerations (ensuring the debugging port is properly secured), and the potential impact on application performance while debugging is active. In production environments, enabling debugging can introduce security vulnerabilities and resource contention, so it's crucial to carefully manage access and monitor performance.
18. How do you debug a security vulnerability discovered in a Java application?
Debugging a security vulnerability in a Java application involves a systematic approach. First, reproduce the vulnerability to confirm it exists and understand its scope. Analyze the application's code, focusing on areas related to the vulnerability, such as input validation, authentication, authorization, and data handling. Use a debugger (like those in IntelliJ IDEA or Eclipse) to step through the code and examine variable values at critical points to see how the application processes data. Use static analysis tools (like SonarQube or FindBugs) to identify potential weaknesses.
Once you pinpoint the root cause, implement a fix and thoroughly test it. This may involve patching the code, updating libraries, or modifying the application's configuration. After the fix, conduct regression testing to ensure other functionality isn't impacted. Use security scanning tools to confirm the vulnerability is resolved and that new vulnerabilities haven't been introduced. Monitoring is key, so ensure the application logs are capturing relevant events to prevent recurrence. Also, consider using a Web Application Firewall (WAF).
19. Let's say you're debugging a complex algorithm, how do you verify the correctness of the logic?
When debugging a complex algorithm, I employ several strategies to verify the logic's correctness. First, I break down the algorithm into smaller, manageable units and test each unit independently using unit tests or simple print statements. I create test cases that cover various scenarios, including edge cases and boundary conditions, to ensure comprehensive coverage.
Second, I use debugging tools to step through the code, inspecting variables and data structures at each step to trace the flow of execution and identify discrepancies between expected and actual behavior. I might also use assertions liberally to confirm that intermediate results are as expected. If available, I will compare the algorithm's output against a known correct solution or a simpler, alternative implementation. Finally, I would consider code reviews with colleagues to gain a fresh perspective and identify potential logical flaws.
20. How do you debug issues related to serialization and deserialization in Java?
Debugging serialization and deserialization issues in Java often involves these techniques:
- Logging: Add logging statements before and after serialization/deserialization to track object state and any exceptions.
- Inspect Stack Traces: Carefully examine stack traces for
IOException,ClassNotFoundException, orInvalidClassExceptionto pinpoint the cause. - Check SerialVersionUID: Ensure the
serialVersionUIDis consistent between the classes used for serialization and deserialization. MismatchedserialVersionUIDvalues can lead toInvalidClassException. - Use a Debugger: Step through the serialization and deserialization process using a debugger to inspect object values and identify where errors occur. Pay attention to fields being skipped or corrupted.
- Validate Data Streams: If dealing with custom serialization, use tools like a hex editor or Wireshark to examine the raw data stream and verify its structure.
- Common problems: Pay attention to transient and static variables. They are not serializable by default. Fields with custom serialization logic should be carefully reviewed. Also check for circular dependencies
21. Explain your strategy for debugging a very large codebase with limited knowledge of the system.
When facing a large codebase with limited knowledge, I employ a systematic debugging strategy. First, I reproduce the bug reliably and document the steps. Then, I use logging, print statements, or a debugger to trace the execution flow, starting from the entry point where the bug manifests. I strategically place logs to narrow down the problematic area, focusing on areas where data transformations or critical logic occur. If a debugger is available, I'd set breakpoints around suspicious code sections to inspect variable values and program state.
Second, I leverage existing resources such as documentation, commit history (git blame), and colleagues' expertise to understand the code's intended behavior and identify potential causes. I use grep or similar tools to search the codebase for relevant keywords, error messages, or function names. I adopt a divide-and-conquer approach, iteratively isolating the bug's origin by eliminating potential causes and focusing on the most likely candidates. Finally, I formulate hypotheses and test them methodically, documenting my findings throughout the process. Once isolated I can investigate the broken code. This approach combines exploratory debugging with knowledge acquisition to efficiently identify and resolve issues in unfamiliar codebases.
22. How would you debug a situation where your application's logging isn't providing enough information?
When logging is insufficient, I would start by adding more targeted logging statements. This includes:
- Increasing the logging verbosity: Temporarily switch to
DEBUGorTRACElevel to capture more granular information. - Adding contextual information: Include relevant variables, timestamps, and user IDs to help trace the execution flow.
- Using conditional breakpoints: Set breakpoints in the debugger that only trigger when specific conditions are met, allowing focused inspection.
If increasing logging doesn't immediately reveal the issue, I would use a debugger to step through the code, inspect variables, and understand the program's state at various points. I might also utilize profiling tools to identify performance bottlenecks or unexpected code paths that could be related to the problem. For example using pdb in python or similar debuggers in other languages to step through code and inspect variables. If the issue is in a production environment, consider using distributed tracing tools (like Jaeger or Zipkin) to track requests across services and identify the source of the problem.
23. Describe your process for debugging issues discovered during code review.
When debugging issues found during code review, I start by thoroughly understanding the reviewer's comments and the affected code section. I then reproduce the issue locally, often using debugging tools or logging to examine the code's behavior. If the issue isn't immediately clear, I'll step through the code, paying close attention to variable values and control flow.
Once I've identified the root cause, I implement a fix and write a test case to prevent regressions. I'll then re-run all relevant tests to ensure the fix doesn't introduce new problems. Finally, I communicate the fix and the reasoning behind it to the reviewer for confirmation and learning.
Java Debugging MCQ
Question 1.
Which of the following is the most likely cause of a NullPointerException in Java?
Options:
- (a) Dividing an integer by zero.
- (b) Accessing a method or field of a variable that currently holds a
nullreference. - (c) Attempting to access an array element using an index that is out of bounds.
- (d) Trying to convert a string to an integer when the string does not represent a valid integer.
Options:
Question 2.
Which of the following is the most likely cause of an infinite loop in Java?
options:
Options:
Question 3.
Which of the following is the MOST effective strategy for debugging a deadlock situation in a Java application?
Options:
Question 4.
Which of the following is the MOST effective technique for identifying memory leaks in a Java application?
Options:
Question 5.
A Java application is experiencing slow performance and eventually crashes with an OutOfMemoryError. After analyzing heap dumps, you determine that the heap usage is steadily increasing over time, but no single object type seems to be the primary culprit. Which of the following is the most likely cause of this issue and the most effective initial step to diagnose it?
Options:
Options:
Question 6.
Which of the following is the most effective technique for debugging race conditions in a multithreaded Java application?
Options:
Options:
Question 7.
Which of the following is the most likely cause of a StackOverflowError in a Java program?
Options:
Options:
Question 8.
Which of the following actions will reliably prevent a ConcurrentModificationException when iterating and modifying a Java ArrayList using its iterator?
options:
Options:
Question 9.
What is the most likely cause of a ClassNotFoundException in Java and how can you resolve it?
options:
Options:
Question 10.
A Java application calculates the average score of students. However, the displayed average is consistently lower than expected. Which of the following is the MOST likely cause of this discrepancy?
options:
Options:
Question 11.
Which of the following is the MOST likely cause of an ArrayIndexOutOfBoundsException in Java?
Options:
Question 12.
A Java application is experiencing significant performance degradation over time. Profiling reveals that a large number of short-lived objects are being created and quickly discarded. Which of the following strategies is MOST likely to improve performance in this scenario?
options:
Options:
Question 13.
A Java application is experiencing unexpected behavior. After examining the logs, you notice a custom exception handler that catches Exception but doesn't properly log or re-throw the exception. What is the most likely consequence of this practice?
Options:
Question 14.
Which of the following is the MOST likely cause of a ClassCastException in Java?
Options:
Options:
Question 15.
A Java application attempts to read a file, but encounters a FileNotFoundException. What is the MOST likely cause of this issue?
Options:
Options:
Question 16.
Which of the following is the MOST likely cause of a java.io.NotSerializableException during object serialization in Java?
Options:
Question 17.
Which of the following is the most likely cause of a JDBC connection leak in a Java application, leading to eventual database performance degradation?
options:
Options:
Question 18.
Which of the following scenarios is MOST likely to cause unexpected behavior when relying on the equals() method in Java?
Options:
Question 19.
Which of the following is most likely to be caused by an incorrectly implemented hashCode() method in a Java class?
Options:
Options:
Question 20.
Which of the following scenarios would NOT be effectively handled by a try-with-resources statement?
Options:
Question 21.
Consider the following Java code snippet:
package com.example;

class Data {
    private String value;

    Data(String value) {
        this.value = value;
    }

    String getValue() {
        return value;
    }
}

public class Main {
    public static void main(String[] args) {
        Data data = new Data("Sensitive Information");
        System.out.println(data.value);
    }
}
When you compile and run this code, what issue will you encounter, and how can it be resolved?
Options:
Question 22.
Which of the following issues can arise from an incorrectly implemented toString() method in Java?
options:
Options:
Question 23.
A Java application retrieves data from a database, processes it, and displays it on a web page. However, the data displayed is incorrect. Which of the following is the MOST likely primary cause of this issue?
options:
Options:
Question 24.
A Java application is configured to write logs to a specific file using a logging framework (e.g., log4j, SLF4J). However, no logs are being written to the file. Which of the following is the MOST likely cause of this issue?
Options:
Options:
Question 25.
A Java application is behaving unexpectedly only in the production environment, but it works fine during development and testing with assertions enabled. What is the most likely cause of this discrepancy?
Options:
Options:
Which Java Debugging skills should you evaluate during the interview phase?
You can't assess everything in one interview, but for Java Debugging, focus on core skills. Evaluating these ensures the candidate can effectively identify and resolve issues. These skills are key to maintaining code quality and system stability.
Problem Solving
Problem-solving skills can be assessed using targeted MCQs. Consider using a technical aptitude test that includes questions that evaluate analytical and logical reasoning.
To assess problem-solving in Java debugging, pose a scenario that requires identifying an error.
A Java program throws a NullPointerException. Describe your process for identifying the cause and fixing it. What tools or techniques would you use?
Look for a systematic approach. The candidate should mention checking variable initialization, using a debugger, and analyzing stack traces.
Code Comprehension
Assess code comprehension with MCQs that test understanding of Java syntax and semantics. Adaface's Java online test includes questions designed to evaluate code comprehension skills.
Present a code snippet with a subtle error and ask the candidate to identify it.
Examine the following Java code: for (int i = 0; i < 10; i++); { System.out.println(i); } What is the output of this code, and why?
The candidate should recognize the semicolon after the for loop, causing an empty loop. The correct answer is that it will print 10 once.
Debugging Tools Proficiency
Evaluate knowledge of debugging tools with MCQs. You can also use coding questions. Use our Java online test to filter candidates on this skill.
Ask about the candidate's experience with specific debugging tools and how they use them.
Describe your experience with using debuggers like IntelliJ IDEA's debugger or Eclipse's debugger. Can you walk me through a scenario where you used a debugger to solve a complex problem?
Look for familiarity with debugger features like breakpoints, stepping through code, and inspecting variables. The candidate should provide a clear example of using a debugger to identify and fix a bug.
Streamline Your Java Hiring with Skills Tests and Targeted Interview Questions
Hiring Java developers requires verifying their debugging skills with precision. Ensuring candidates possess the necessary abilities is key to building high-performing teams and delivering quality software.
Skills tests are the most effective way to assess a candidate's true capabilities. Adaface offers a range of assessments, including the Java Online Test and the Coding Debugging Test, designed to evaluate debugging proficiency.
Once you've used these tests to identify top performers, you can focus your interview efforts. This allows you to delve deeper into their experience and problem-solving approach with confidence.
Ready to find your next great Java debugging expert? Explore our Coding Tests to get started or sign up today.
Java Online Test
40 mins | 8 MCQs and 1 Coding Question
The Java test uses scenario-based and code-tracing questions to evaluate candidates' knowledge of core Java concepts such as OOPs, Classes, Exceptions, Collections and advanced topics such as concurrent programming with threads and handling relational databases. The test uses simple Java Coding questions to assess a candidate's ability to code in Java.
Try Java Online Test
Download Java Debugging interview questions template in multiple formats
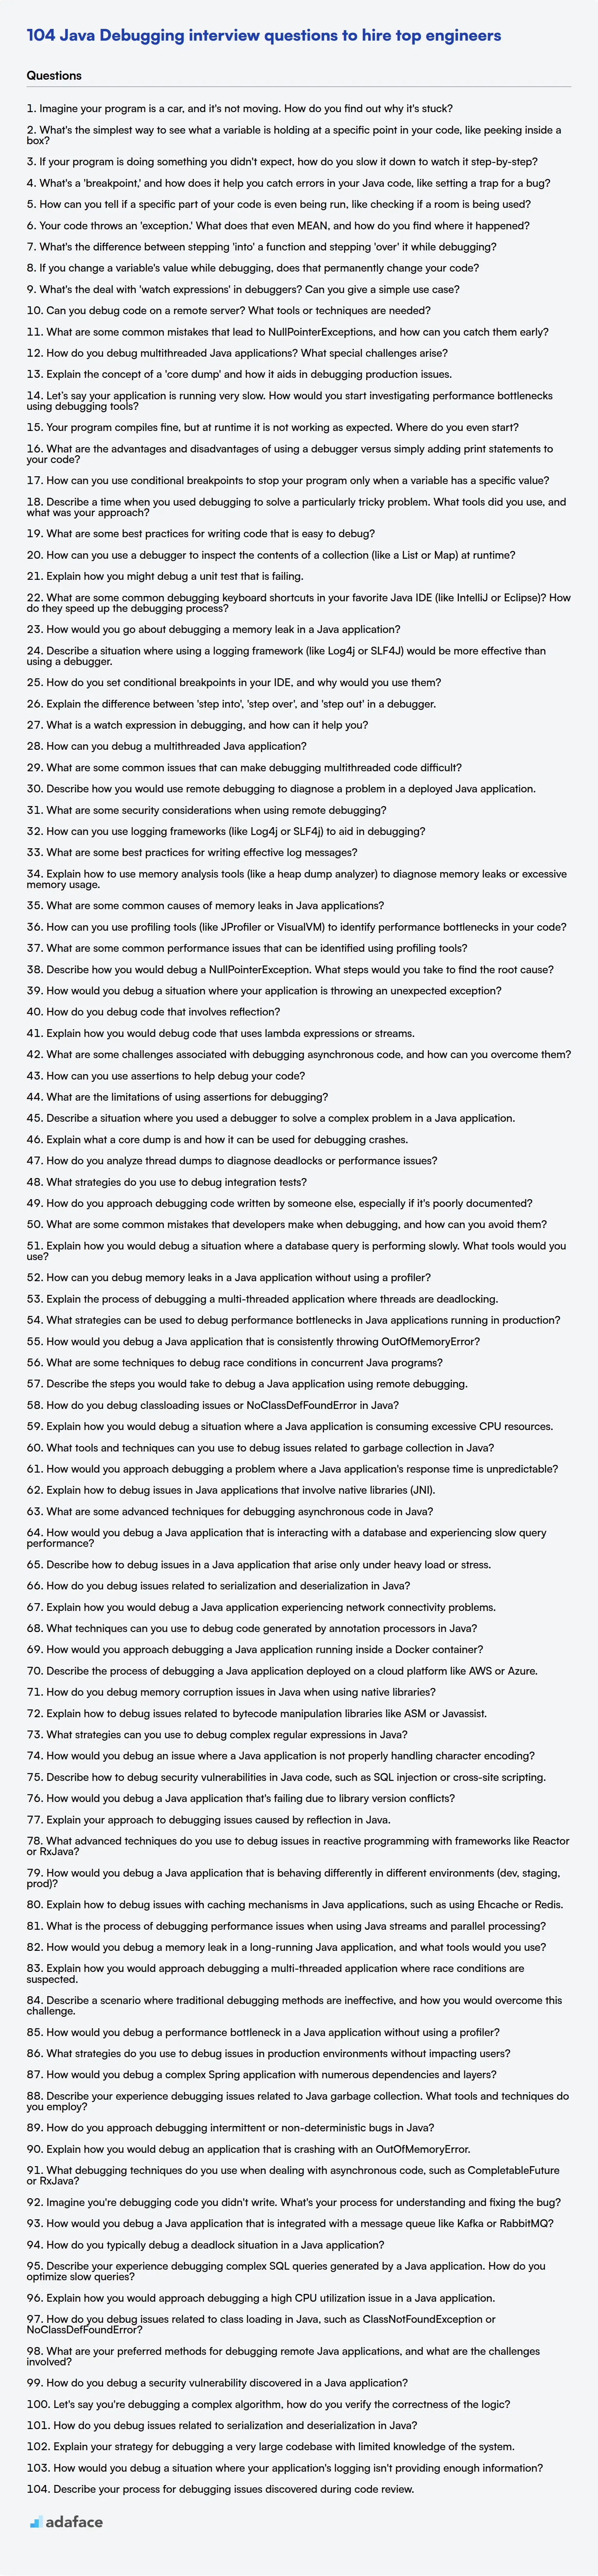
Java Debugging Interview Questions FAQs
Why is debugging knowledge important for Java developers?
Debugging skills enable developers to quickly identify and resolve issues in code, ensuring software reliability and faster development cycles.
What are some common debugging tools used in Java development?
Popular tools include IDE debuggers (like IntelliJ IDEA and Eclipse), logging frameworks (like Log4j), and profiling tools (like VisualVM).
How can I assess a candidate's debugging approach during an interview?
Present code snippets with known errors and ask the candidate to walk through their process of identifying and fixing the issues.
What are some advanced debugging techniques Java developers should know?
Techniques such as remote debugging, heap analysis, and thread dump analysis are helpful for resolving complex issues in production environments.
What are some effective strategies for preventing bugs in Java code?
Strategies include writing unit tests, performing code reviews, using static analysis tools, and following coding best practices.
40 min skill tests.
No trick questions.
Accurate shortlisting.
We make it easy for you to find the best candidates in your pipeline with a 40 min skills test.
Try for freeRelated posts
Free resources

Join 1200+ companies in 80+ countries.
Try the most candidate friendly skills assessment tool today.

40 min tests.
No trick questions.
Accurate shortlisting.
No trick questions.
Accurate shortlisting.