
7 general Excel interview questions and answers to assess candidates
10 intermediate Excel interview questions and answers to ask mid-tier analysts.
9 Excel interview questions and answers related to pivot tables
8 situational Excel interview questions with answers for hiring top analysts

Hiring the right candidate with strong Excel skills can significantly impact your team's productivity and efficiency. This article provides a list of essential Excel interview questions, ensuring you find the perfect fit for your organization.
This blog post will cover various categories of Excel interview questions, from general inquiries to specific topics like pivot tables and functions. With 68 targeted questions across different skill levels, you'll be well-equipped to evaluate candidates effectively.
Using this guide, you can streamline your interview process and identify top talent with ease. For a thorough pre-interview evaluation, consider our Excel test to further ensure candidates meet your expectations.
Table of contents
7 general Excel interview questions and answers to assess candidates
20 Excel interview questions to ask junior analysts
10 intermediate Excel interview questions and answers to ask mid-tier analysts.
14 Excel interview questions about functions and formulas
9 Excel interview questions and answers related to pivot tables
8 situational Excel interview questions with answers for hiring top analysts
Which Excel skills should you evaluate during the interview phase?
Enhance Your Hiring Process with Excel Skills Assessments and Tailored Interview Questions
Download Excel interview questions template in multiple formats
7 general Excel interview questions and answers to assess candidates

Want to cut through the noise and find out if your candidates truly know their way around Excel? This list of questions is designed to help you assess their skills quickly and effectively during an interview. Use these questions to gauge their proficiency and practical knowledge without diving into overly technical jargon.
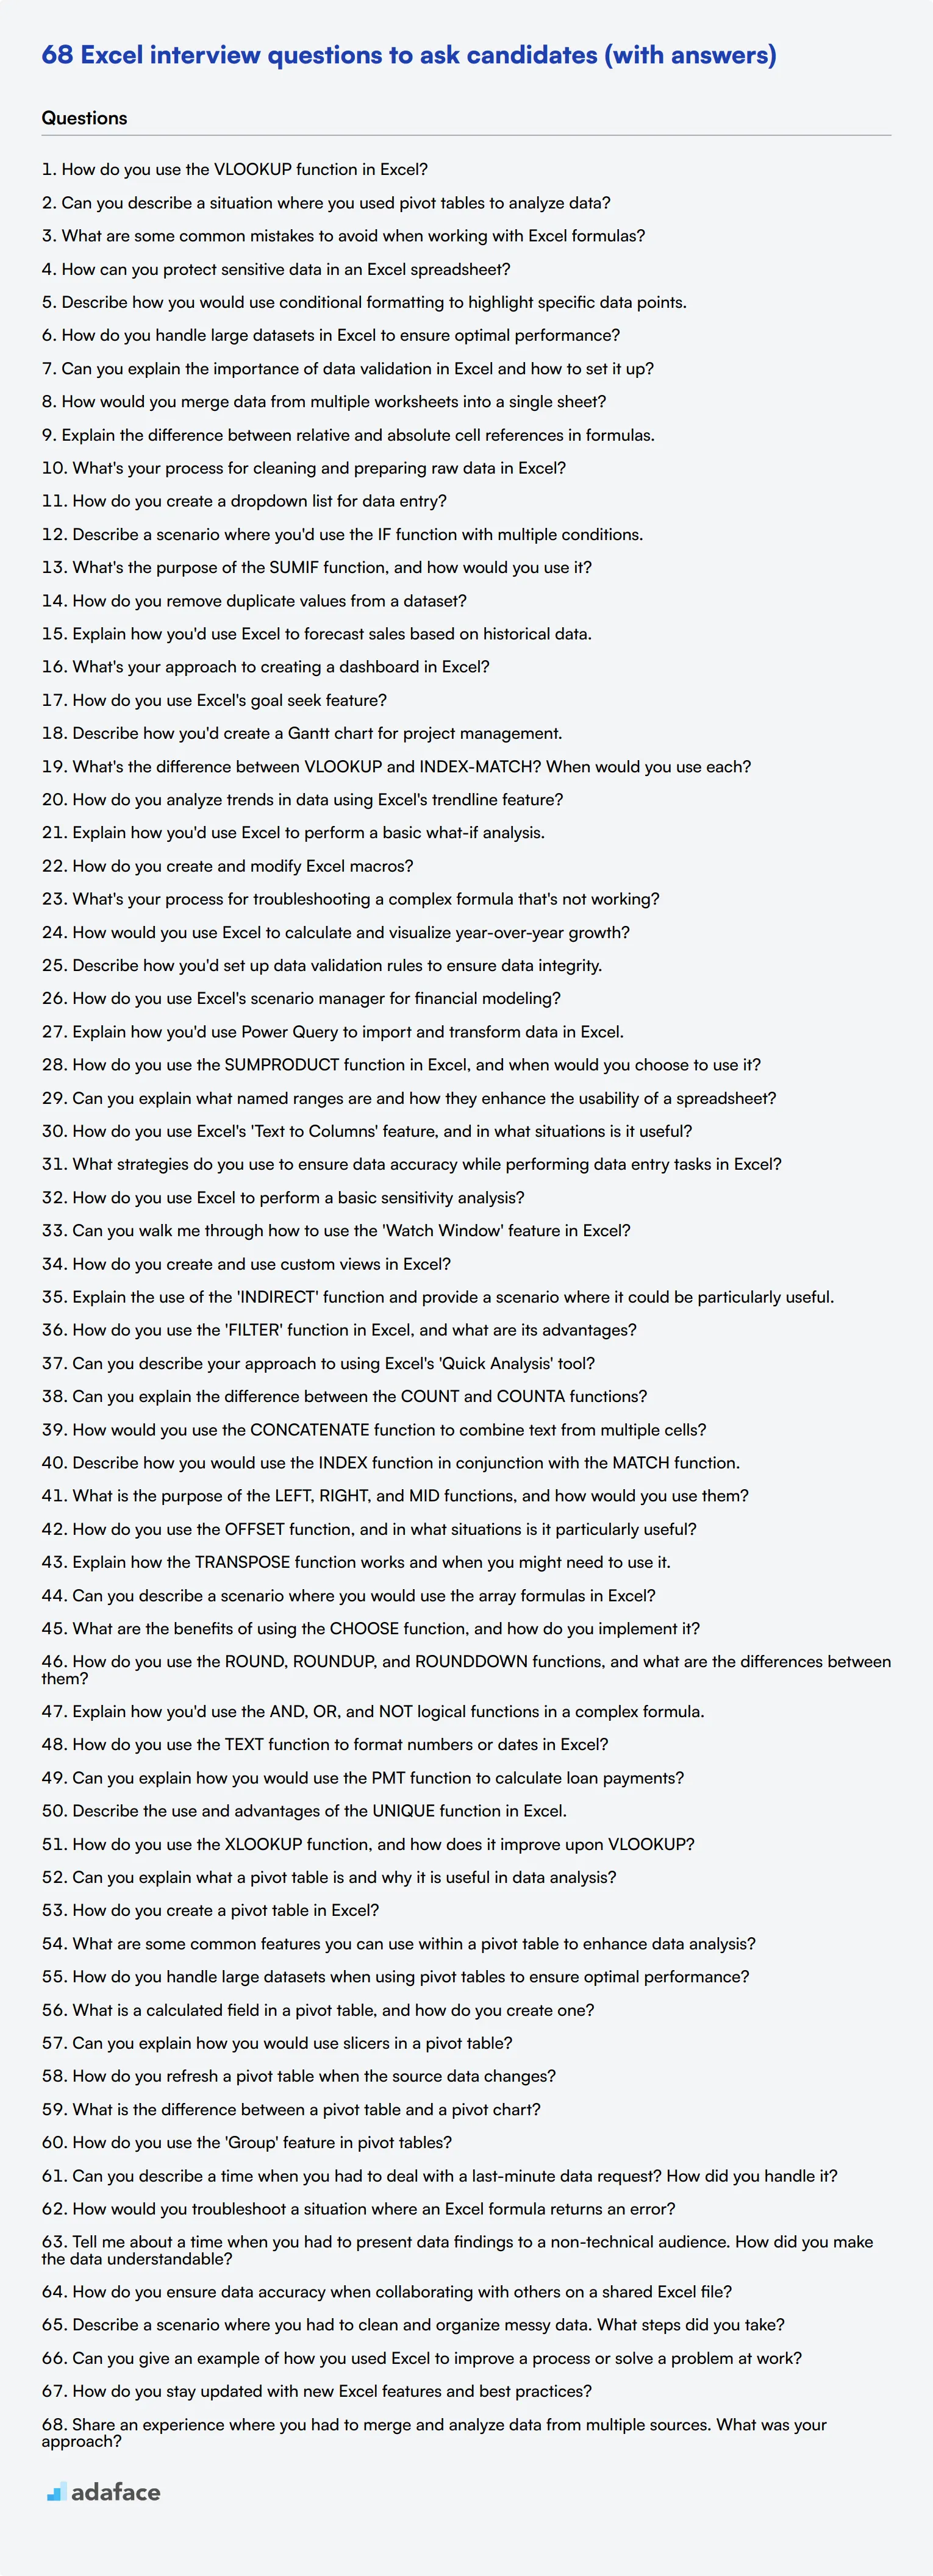
1. How do you use the VLOOKUP function in Excel?
The VLOOKUP function in Excel is used to search for a value in the first column of a table and return a value in the same row from another column. It's especially useful for finding specific data points in large datasets.
An ideal candidate should explain that the VLOOKUP function requires four parameters: the value to search for, the range to search within, the column number to return the value from, and whether you want an exact or approximate match. Look for clarity in their explanation and examples of practical usage.
2. Can you describe a situation where you used pivot tables to analyze data?
Pivot tables are powerful tools for summarizing, analyzing, exploring, and presenting data. They enable users to transform extensive datasets into insightful summaries quickly.
The ideal candidate should provide a specific example, such as using pivot tables to analyze sales data across different regions and time periods. They should mention how they set up the pivot table, chose the relevant fields, and used filters or calculated fields to gain insights. Look for a clear, step-by-step explanation and practical application.
3. What are some common mistakes to avoid when working with Excel formulas?
Common mistakes in Excel formulas include using incorrect cell references, not using absolute references when needed, and mishandling data types (e.g., mixing text with numbers).
Candidates should also mention errors like not closing parentheses, using incorrect functions, and not updating formulas when data changes. An ideal answer will include examples of how these mistakes can impact the results and how to avoid them. Look for their ability to identify and troubleshoot these common issues.
4. How can you protect sensitive data in an Excel spreadsheet?
To protect sensitive data in Excel, you can use several methods such as password-protecting the entire workbook or specific sheets, encrypting the file, and using cell-level protection to prevent editing.
Candidates should also mention the importance of regularly backing up data and using permissions to restrict access. Look for a thorough understanding of these security features and practical advice on implementing them.
5. Describe how you would use conditional formatting to highlight specific data points.
Conditional formatting in Excel is used to automatically apply formatting—such as colors, icons, or data bars—to cells that meet specific criteria. This makes it easier to visualize data trends and outliers.
An ideal candidate should explain how to set up conditional formatting rules based on conditions like cell values, text, dates, or even custom formulas. They should provide examples, such as highlighting cells with values above a certain threshold or marking duplicate entries. Look for clarity in their explanation and practical applications.
6. How do you handle large datasets in Excel to ensure optimal performance?
Handling large datasets in Excel requires strategies to optimize performance, such as using Excel's data model, minimizing the use of volatile functions like INDIRECT or OFFSET, and avoiding unnecessary formatting.
Candidates should also mention techniques like using filters and pivot tables to manage and analyze data efficiently, as well as breaking down large datasets into smaller, more manageable chunks. Look for their ability to provide specific tips and best practices from their experience.
7. Can you explain the importance of data validation in Excel and how to set it up?
Data validation in Excel is crucial for ensuring data integrity by restricting the type, format, and range of data that can be entered into a cell. This helps prevent errors and maintain consistency across datasets.
The ideal candidate should explain how to set up data validation by specifying criteria such as whole numbers, decimal numbers, lists, or custom formulas. They should provide examples, like creating a dropdown list for selecting predefined options. Look for a clear explanation and practical examples of how they've used data validation in their work.
20 Excel interview questions to ask junior analysts
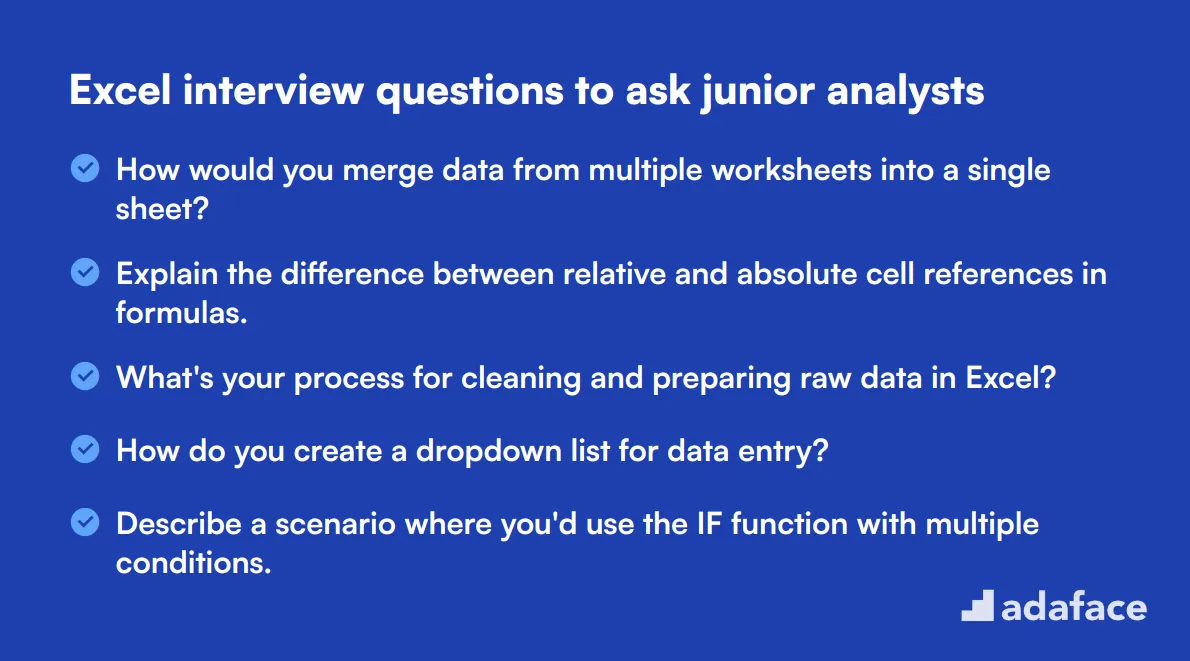
To assess the Excel proficiency of junior analysts, use these 20 interview questions. They cover essential skills and practical applications, helping you identify candidates who can hit the ground running with Excel tasks.
- How would you merge data from multiple worksheets into a single sheet?
- Explain the difference between relative and absolute cell references in formulas.
- What's your process for cleaning and preparing raw data in Excel?
- How do you create a dropdown list for data entry?
- Describe a scenario where you'd use the IF function with multiple conditions.
- What's the purpose of the SUMIF function, and how would you use it?
- How do you remove duplicate values from a dataset?
- Explain how you'd use Excel to forecast sales based on historical data.
- What's your approach to creating a dashboard in Excel?
- How do you use Excel's goal seek feature?
- Describe how you'd create a Gantt chart for project management.
- What's the difference between VLOOKUP and INDEX-MATCH? When would you use each?
- How do you analyze trends in data using Excel's trendline feature?
- Explain how you'd use Excel to perform a basic what-if analysis.
- How do you create and modify Excel macros?
- What's your process for troubleshooting a complex formula that's not working?
- How would you use Excel to calculate and visualize year-over-year growth?
- Describe how you'd set up data validation rules to ensure data integrity.
- How do you use Excel's scenario manager for financial modeling?
- Explain how you'd use Power Query to import and transform data in Excel.
10 intermediate Excel interview questions and answers to ask mid-tier analysts.
To determine if your applicants can handle mid-tier analytical tasks in Excel, use these intermediate interview questions. They're crafted to gauge the candidate's proficiency and problem-solving abilities, ensuring you identify the right skill set for your team's needs.
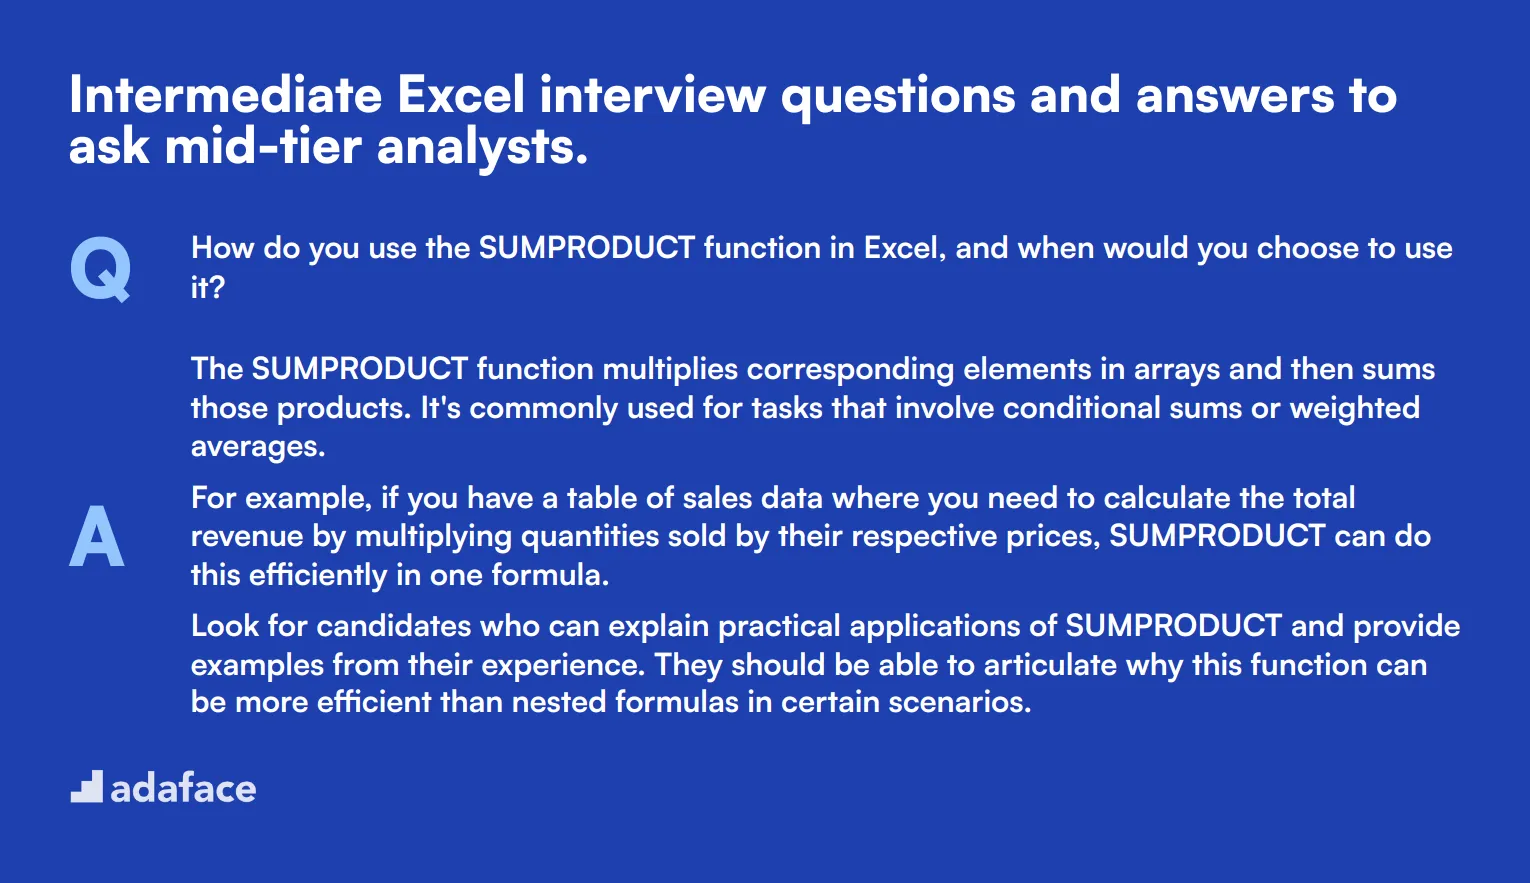
1. How do you use the SUMPRODUCT function in Excel, and when would you choose to use it?
The SUMPRODUCT function multiplies corresponding elements in arrays and then sums those products. It's commonly used for tasks that involve conditional sums or weighted averages.
For example, if you have a table of sales data where you need to calculate the total revenue by multiplying quantities sold by their respective prices, SUMPRODUCT can do this efficiently in one formula.
Look for candidates who can explain practical applications of SUMPRODUCT and provide examples from their experience. They should be able to articulate why this function can be more efficient than nested formulas in certain scenarios.
2. Can you explain what named ranges are and how they enhance the usability of a spreadsheet?
Named ranges are specific cells or groups of cells that you assign a name to. Instead of referencing cells by their coordinates, you can use the designated name, making formulas easier to read and understand.
For example, instead of writing =SUM(A1:A10), you could name the range SalesData and then write =SUM(SalesData). This not only improves readability but also reduces errors when updating formulas.
Ideal candidates should demonstrate how they use named ranges to streamline complex spreadsheets and improve collaboration among team members. They should also mention scenarios where named ranges can be particularly beneficial, such as in large financial models.
3. How do you use Excel's 'Text to Columns' feature, and in what situations is it useful?
'Text to Columns' allows you to split a single column of data into multiple columns. This is particularly useful when dealing with data that is concatenated into a single column but needs to be separated for analysis, such as a list of full names that need to be split into first and last names.
You can access this feature under the 'Data' tab. You choose the delimiter or fixed width to specify where the data should be split. For example, splitting addresses into street, city, and postal code can make data more manageable and analyzable.
Candidates should highlight their experience in scenarios where 'Text to Columns' saved time and effort, and they should demonstrate an understanding of its limitations and how to mitigate them.
4. What strategies do you use to ensure data accuracy while performing data entry tasks in Excel?
Ensuring data accuracy starts with setting up data validation rules to prevent incorrect entries. Using drop-down lists, setting allowable data ranges, and employing conditional formatting can help catch errors at the point of entry.
Regularly using functions like SUM, AVERAGE, and COUNTIF to cross-check totals and averages can also help identify discrepancies. Additionally, using the 'Remove Duplicates' feature ensures that data is unique where necessary.
Look for candidates who can discuss both preventative measures and corrective actions they take to maintain data integrity. They should also be able to provide specific examples from their past work experience.
5. How do you use Excel to perform a basic sensitivity analysis?
Sensitivity analysis in Excel can be performed using Data Tables. This feature allows you to see how changes in input variables affect output results. It's commonly used in financial modeling to understand the impact of varying assumptions.
For instance, you can create a one-variable or two-variable data table to analyze how changes in interest rates or sales volumes affect profitability. This involves setting up a table with different input values and then observing the changes in the output.
Ideal responses should include specific examples, such as analyzing how different market conditions impact revenue forecasts. Candidates should demonstrate an understanding of setting up and interpreting the results of a sensitivity analysis.
6. Can you walk me through how to use the 'Watch Window' feature in Excel?
The 'Watch Window' feature in Excel allows you to keep track of important cells and their values from anywhere in your workbook. This is particularly useful for monitoring changes in key metrics while working on different parts of a large spreadsheet.
You can add cells to the Watch Window by selecting the cells you want to monitor, right-clicking, and choosing 'Add Watch'. This feature helps in keeping an eye on critical values without constantly switching between sheets.
Candidates should show awareness of how 'Watch Window' can improve efficiency in complex workbooks. They should be able to provide examples of when they used this feature to keep track of important metrics or troubleshoot issues.
7. How do you create and use custom views in Excel?
Custom views in Excel allow you to save different display settings and quickly switch between them. This includes settings like hidden rows or columns, filter settings, and even print settings. It's particularly useful in workbooks with multiple configurations for different audiences.
You can create a custom view by going to the 'View' tab and clicking on 'Custom Views'. From there, you can add a new view and save the current display settings. This makes it easy to switch back and forth between different setups without losing your place.
Look for candidates who can explain how custom views have helped them manage complex workbooks efficiently. They should provide examples of different scenarios where this feature was useful, such as preparing different reports from the same dataset.
8. Explain the use of the 'INDIRECT' function and provide a scenario where it could be particularly useful.
The 'INDIRECT' function returns the reference specified by a text string. It allows you to create dynamic cell references, which can be very useful in complex spreadsheets where cell references need to change based on different conditions.
For example, if you have multiple sheets named 'January', 'February', and so on, you can use INDIRECT("'" & A1 & "'!B2") to reference cell B2 in the sheet named in cell A1. This makes it easier to create summary sheets that pull data from multiple sources dynamically.
Ideal candidates should demonstrate a clear understanding of how and when to use the 'INDIRECT' function. They should provide examples of its practical applications, such as creating dynamic dashboards or consolidating data from multiple sheets.
9. How do you use the 'FILTER' function in Excel, and what are its advantages?
The 'FILTER' function allows you to extract data that meets specific criteria, making it easier to analyze subsets of data. This dynamic function updates automatically when the source data changes, which is a significant advantage over static filtering methods.
For instance, if you want to extract sales data for a particular region within a large dataset, you can use FILTER(data_range, criteria_range = "Region"). This will create a dynamic list of sales data for that region, which updates as new data is added.
Candidates should highlight the benefits of using the 'FILTER' function over traditional methods, such as advanced filters or manual sorting. They should also discuss scenarios where this function has streamlined their data analysis processes.
10. Can you describe your approach to using Excel's 'Quick Analysis' tool?
The 'Quick Analysis' tool in Excel provides a fast way to analyze data. By selecting a data range and clicking the 'Quick Analysis' button, you can quickly apply formatting, create charts, add totals, and more, without writing complex formulas.
For example, if you have a table of sales data, you can use the 'Quick Analysis' tool to add conditional formatting to highlight top-performing regions, create a pivot table, or generate a chart to visualize trends in seconds.
Look for candidates who can articulate how 'Quick Analysis' has improved their efficiency. They should provide examples of when and why they opted to use this tool and demonstrate an understanding of its various features and limitations.
14 Excel interview questions about functions and formulas
To assess whether your candidates possess the necessary skills in using Excel functions and formulas, consider these 14 targeted Excel interview questions. These questions help ensure that applicants can handle complex tasks and provide accurate data analysis, key for roles requiring strong Excel proficiency.
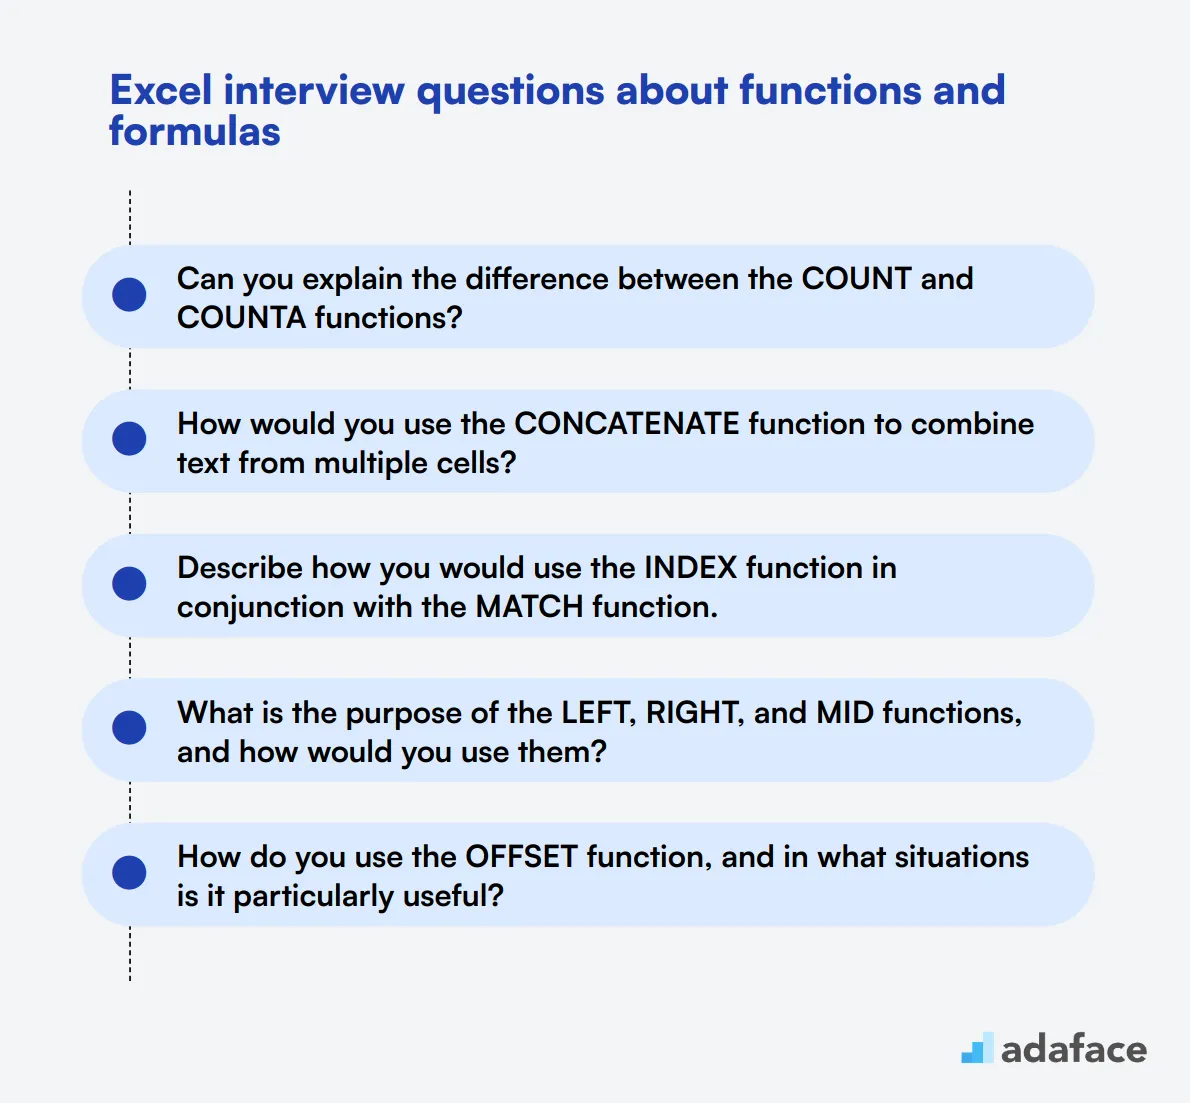
- Can you explain the difference between the COUNT and COUNTA functions?
- How would you use the CONCATENATE function to combine text from multiple cells?
- Describe how you would use the INDEX function in conjunction with the MATCH function.
- What is the purpose of the LEFT, RIGHT, and MID functions, and how would you use them?
- How do you use the OFFSET function, and in what situations is it particularly useful?
- Explain how the TRANSPOSE function works and when you might need to use it.
- Can you describe a scenario where you would use the array formulas in Excel?
- What are the benefits of using the CHOOSE function, and how do you implement it?
- How do you use the ROUND, ROUNDUP, and ROUNDDOWN functions, and what are the differences between them?
- Explain how you'd use the AND, OR, and NOT logical functions in a complex formula.
- How do you use the TEXT function to format numbers or dates in Excel?
- Can you explain how you would use the PMT function to calculate loan payments?
- Describe the use and advantages of the UNIQUE function in Excel.
- How do you use the XLOOKUP function, and how does it improve upon VLOOKUP?
9 Excel interview questions and answers related to pivot tables
If you're looking to assess an applicant's proficiency with pivot tables in Excel, these targeted interview questions are your go-to resource. Designed for recruiters and hiring managers, they help in evaluating a candidate's practical understanding of this crucial feature.
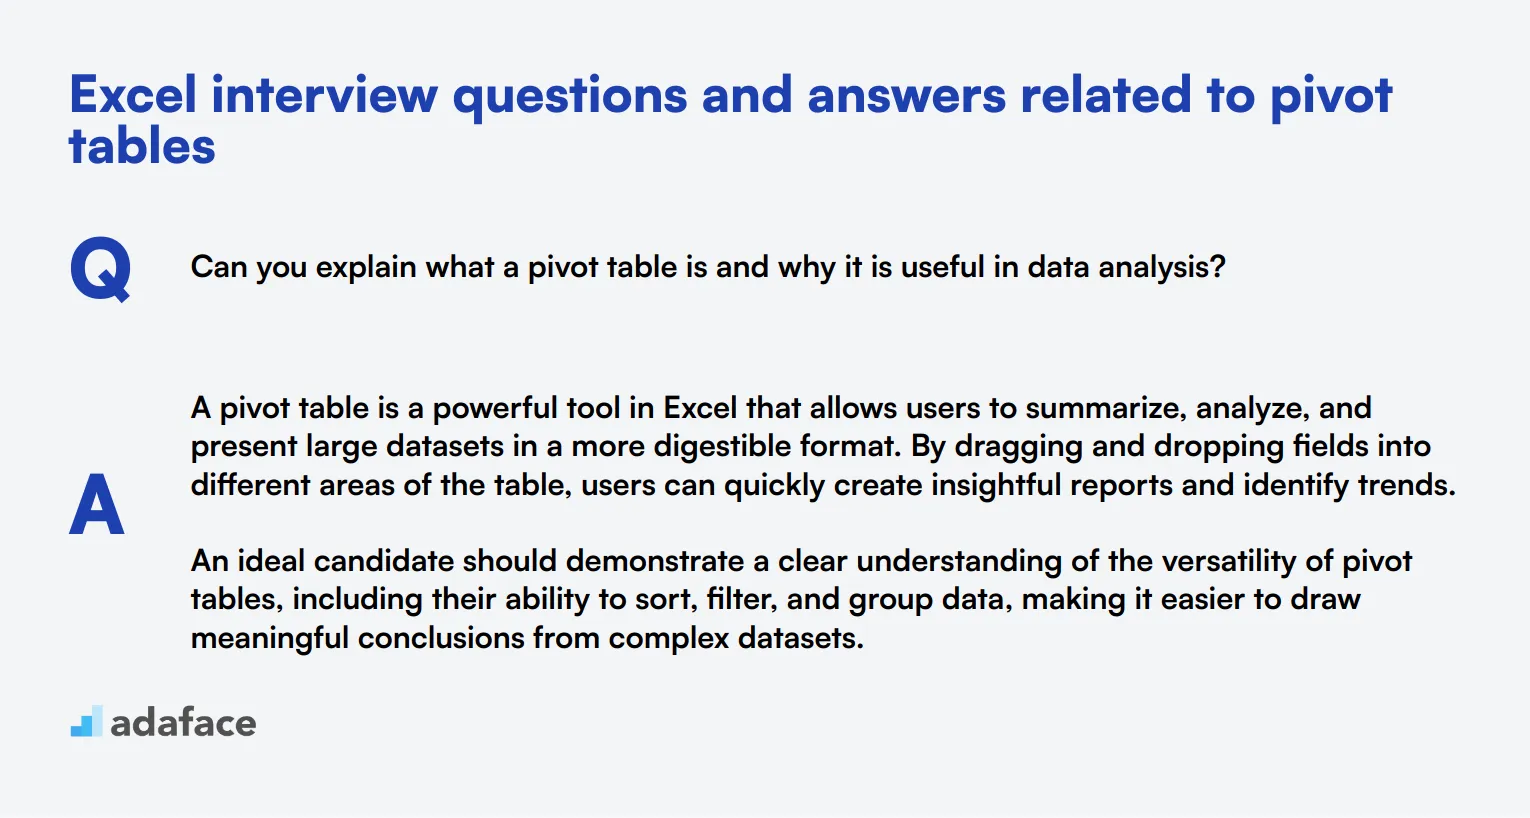
1. Can you explain what a pivot table is and why it is useful in data analysis?
A pivot table is a powerful tool in Excel that allows users to summarize, analyze, and present large datasets in a more digestible format. By dragging and dropping fields into different areas of the table, users can quickly create insightful reports and identify trends.
An ideal candidate should demonstrate a clear understanding of the versatility of pivot tables, including their ability to sort, filter, and group data, making it easier to draw meaningful conclusions from complex datasets.
2. How do you create a pivot table in Excel?
To create a pivot table, start by selecting the dataset you want to analyze. Then, go to the 'Insert' tab and choose 'PivotTable.' A dialog box will appear, allowing you to specify the location for the pivot table, either in a new worksheet or an existing one. After that, you can drag and drop fields into the Rows, Columns, Values, and Filters areas to organize the data as needed.
Look for candidates who can clearly articulate these steps and mention the flexibility of pivot tables in summarizing data from different angles. This shows that they are comfortable with basic Excel functionalities.
3. What are some common features you can use within a pivot table to enhance data analysis?
Common features within a pivot table include sorting and filtering data, creating calculated fields, and using slicers to interactively filter data. You can also group data by various time periods or categories and use conditional formatting to highlight critical insights.
Candidates should mention these features and ideally provide examples of how they have used them in past projects. This demonstrates not only their technical skills but also their ability to apply these features effectively.
4. How do you handle large datasets when using pivot tables to ensure optimal performance?
When dealing with large datasets in pivot tables, it's important to ensure optimal performance by using Excel's built-in features like data model and Power Pivot. Another common practice is to minimize the number of columns and rows before creating the pivot table and to use efficient data structures.
An ideal response would include practical tips for optimizing performance, such as reducing the data range and avoiding complex calculated fields. This shows the candidate's ability to manage and analyze large datasets efficiently.
5. What is a calculated field in a pivot table, and how do you create one?
A calculated field is a new field created from other fields in the pivot table using a formula. To create one, go to the 'PivotTable Analyze' or 'Options' tab, select 'Fields, Items & Sets,' and then choose 'Calculated Field.' You can then define the formula that combines existing fields to generate the new calculated field.
Look for candidates who can explain this process clearly and can provide examples of when they have used calculated fields. This shows their ability to customize pivot tables for advanced data analysis.
6. Can you explain how you would use slicers in a pivot table?
Slicers are a user-friendly way to filter data in a pivot table. To add a slicer, go to the 'PivotTable Analyze' tab and select 'Insert Slicer.' Choose the fields you want to use as filters. Slicers provide a visual representation of the filters, making it easier to navigate and analyze data.
Candidates should demonstrate their familiarity with slicers and their ability to use them effectively. Mentioning the ease of use and visual appeal of slicers can indicate a good understanding of data presentation techniques.
7. How do you refresh a pivot table when the source data changes?
To refresh a pivot table, simply right-click anywhere inside the pivot table and select 'Refresh.' Alternatively, you can go to the 'PivotTable Analyze' tab and click on the 'Refresh' button. This updates the pivot table to reflect any changes in the source data.
An ideal candidate should highlight the importance of keeping pivot tables up-to-date and might mention setting up automatic refresh options if working with connected data sources. This shows they understand the dynamic nature of data analysis.
8. What is the difference between a pivot table and a pivot chart?
A pivot table is a data summarization tool, whereas a pivot chart is a visual representation of the data in a pivot table. Pivot charts allow users to create graphs and charts that are linked to the pivot table, making it easier to visualize trends and patterns.
Candidates should show they understand the complementary nature of pivot tables and pivot charts and ideally provide examples of how they've used both tools together for more effective data analysis.
9. How do you use the 'Group' feature in pivot tables?
To use the 'Group' feature, right-click on the data you want to group and select 'Group.' This is particularly useful for grouping dates (by months, quarters, years) or numerical values into ranges. Grouping helps in organizing data more efficiently and making it easier to analyze.
Look for candidates who can explain this process clearly and provide specific examples of how they have used grouping in past projects. This shows their ability to organize and summarize data effectively.
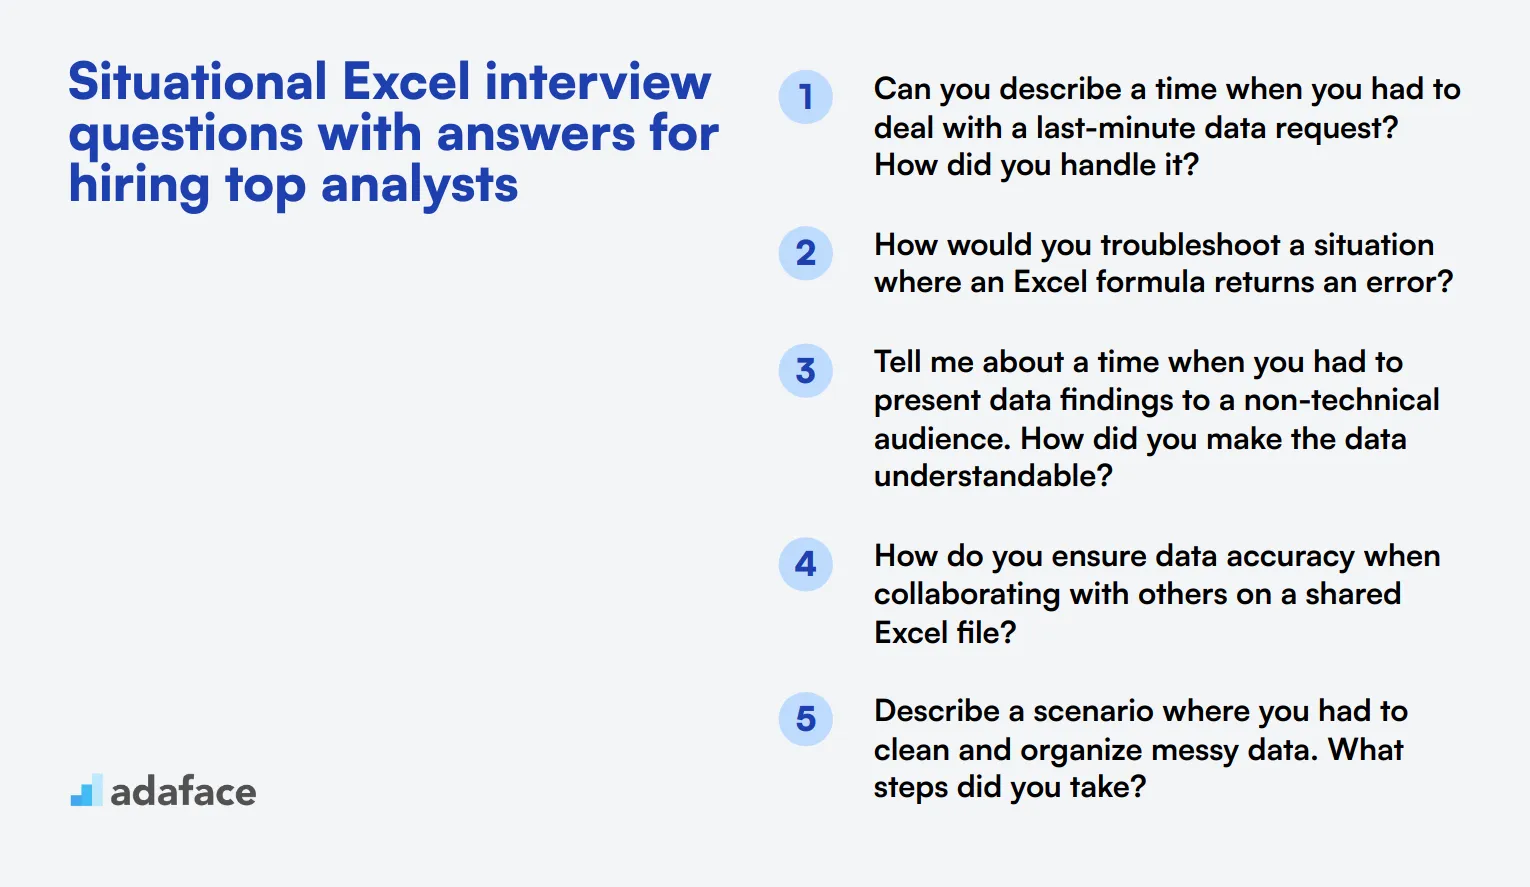
8 situational Excel interview questions with answers for hiring top analysts
To identify top-notch analysts who can handle complex data tasks with ease, it's essential to go beyond basic Excel skills. Use these situational Excel interview questions to assess how candidates think on their feet and solve real-world problems.
1. Can you describe a time when you had to deal with a last-minute data request? How did you handle it?
In a high-pressure situation where a last-minute data request comes in, the ability to prioritize and quickly deliver accurate results is crucial. An ideal candidate should explain how they assessed the urgency of the request, gathered the necessary data efficiently, and communicated clearly with the requester.
What to look for: Look for candidates who demonstrate strong organizational skills, adaptability, and effective communication. Follow up by asking about any tools or Excel features they leveraged to expedite the process.
2. How would you troubleshoot a situation where an Excel formula returns an error?
Troubleshooting Excel formulas requires a systematic approach. Candidates should mention steps like checking for typos, ensuring proper use of cell references, and using the 'Evaluate Formula' feature to debug step-by-step. They may also discuss using error-checking functions like IFERROR to handle potential issues.
What to look for: Strong candidates will describe a clear, methodical process and show familiarity with Excel's troubleshooting tools. Consider asking them to walk through a specific example or share their experience with common errors.
3. Tell me about a time when you had to present data findings to a non-technical audience. How did you make the data understandable?
Communicating data to a non-technical audience requires simplifying complex information. Candidates might discuss using visual aids like charts and graphs, avoiding jargon, and highlighting key insights. Storytelling techniques can also be effective in making data relatable.
What to look for: Look for candidates who can articulate their approach to making data accessible and engaging. Follow up by asking for examples of specific visualizations or storytelling methods they used.
4. How do you ensure data accuracy when collaborating with others on a shared Excel file?
Ensuring data accuracy in a collaborative environment involves setting clear guidelines and using Excel features like track changes, data validation, and permissions to control edits. Regular communication and periodic reviews can also help maintain data integrity.
What to look for: Strong candidates will emphasize the importance of clear communication and proactive measures to prevent errors. Ask about any specific challenges they faced and how they addressed them.
5. Describe a scenario where you had to clean and organize messy data. What steps did you take?
Cleaning and organizing messy data requires a structured approach. Candidates should mention steps like removing duplicates, standardizing data formats, and using tools like Power Query for more complex transformations. They may also discuss validating the cleaned data to ensure accuracy.
What to look for: Look for candidates who demonstrate a thorough understanding of data cleaning processes and tools. Follow up by asking about specific challenges they encountered and how they resolved them.
6. Can you give an example of how you used Excel to improve a process or solve a problem at work?
Using Excel to improve processes often involves creating automated workflows, developing dashboards, or implementing data analysis techniques. Candidates should provide a concrete example, detailing the problem, their Excel-based solution, and the impact it had on efficiency or decision-making.
What to look for: Look for candidates who can clearly explain the problem-solving process and quantify the benefits of their solution. Consider asking for specific features or functions they used to achieve the results.
7. How do you stay updated with new Excel features and best practices?
Staying updated with new Excel features and best practices involves continuous learning through online courses, webinars, and industry blogs. Candidates might also mention participating in forums or user groups to exchange knowledge with peers.
What to look for: Look for candidates who show a proactive attitude toward learning and self-improvement. Ask them to share any recent tips or tricks they've found particularly useful.
8. Share an experience where you had to merge and analyze data from multiple sources. What was your approach?
Merging and analyzing data from multiple sources requires careful planning and attention to detail. Candidates should describe their approach to data integration, including the use of tools like Power Query or VLOOKUP to combine datasets. They should also discuss how they ensured data consistency and accuracy.
What to look for: Look for candidates who demonstrate a methodical approach and familiarity with data integration tools. Ask about any specific challenges they faced and how they ensured the reliability of their analysis.
Which Excel skills should you evaluate during the interview phase?
While a single interview cannot capture all the nuances of a candidate's abilities, there are core Excel skills that can give you significant insight into their proficiency. Focusing on these skills will help you identify candidates who can effectively use Excel in their roles, ensuring they can contribute to your team's success from day one.
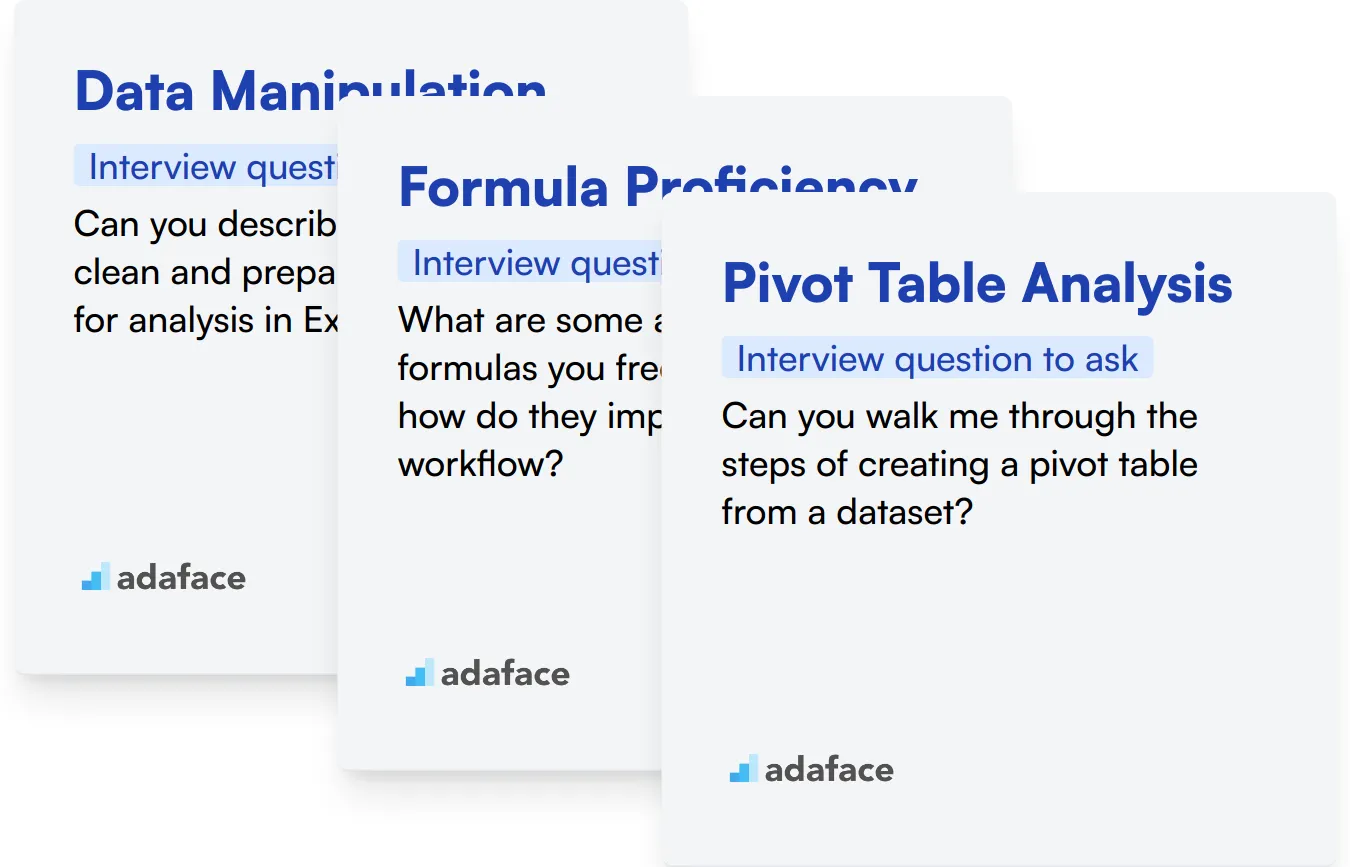
Data Manipulation
To evaluate this skill, consider administering an assessment test that includes relevant multiple-choice questions. You might find the Excel Workbook test helpful in this regard.
You can also ask targeted interview questions to gauge this subskill effectively. For instance,
Can you describe how you would clean and prepare a large dataset for analysis in Excel?
Look for responses that indicate a systematic approach to data cleaning, including specific techniques like removing duplicates, handling missing values, and utilizing functions for data transformation.
Formula Proficiency
You can evaluate formula proficiency through an assessment test with relevant questions. Consider using the Excel test available in our library.
Additionally, you may ask candidates to explain how they use formulas in their daily work. A good question to ask is,
What are some advanced Excel formulas you frequently use, and how do they improve your workflow?
Pay attention to the specificity of their examples and their understanding of functions like VLOOKUP, INDEX-MATCH, or array formulas, as these are indicators of their expertise.
Pivot Table Analysis
An effective way to assess this skill is by using an assessment test with relevant MCQs. Check out the Excel Workbook test for questions focusing on pivot tables.
To further evaluate this skill in a conversation, you might ask,
Can you walk me through the steps of creating a pivot table from a dataset?
Listen for their explanation of the process, including selecting data ranges, choosing fields to analyze, and interpreting the resulting pivot table, which demonstrates their hands-on experience.
Enhance Your Hiring Process with Excel Skills Assessments and Tailored Interview Questions
When hiring for roles requiring Excel expertise, it's imperative to verify candidates possess the necessary skills. Ensuring these skills can be challenging without a solid evaluation process.
The most effective way to assess a candidate's Excel capabilities is through targeted skill tests. Consider leveraging Adaface tests like our Excel Test, Excel Data Interpretation Test, or Data Analytics in Excel Test for a precise assessment of applicants' proficiency.
After administering these tests, you can confidently shortlist the top performers. This streamlined vetting process allows you to invite only the most promising candidates for interviews, optimizing your hiring efforts.
Ready to start finding the best Excel experts? Begin by signing up at Adaface Signup to access our specialized tests and resources tailored for effective candidate selection.
Excel Test
30 mins | 14 MCQs
The Excel test uses scenario-based MCQ questions to evaluate a candidate's ability to work with large datasets in Excel, navigate multiple spreadsheets, use advanced formulas and create reports. The test screens for the ability to sort/filter data, analyze data using PivotTables, create dashboards using charts, provide forms for user inputs, and record/ modify/ write macros.
Try Excel Test
Download Excel interview questions template in multiple formats
Excel Interview Questions FAQs
How many Excel interview questions are included in this post?
This post includes 68 Excel interview questions covering various skill levels and topics.
What types of Excel questions are covered?
The questions cover general Excel skills, functions and formulas, pivot tables, and situational scenarios for different experience levels.
Are the answers provided for these Excel interview questions?
Yes, answers are provided for the Excel interview questions to help interviewers evaluate candidates' responses.
How can these questions help in the hiring process?
These questions can help assess candidates' Excel proficiency, problem-solving skills, and ability to apply Excel in real-world scenarios.
40 min skill tests.
No trick questions.
Accurate shortlisting.
We make it easy for you to find the best candidates in your pipeline with a 40 min skills test.
Try for freeRelated posts
Free resources

Join 1200+ companies in 80+ countries.
Try the most candidate friendly skills assessment tool today.

40 min tests.
No trick questions.
Accurate shortlisting.
No trick questions.
Accurate shortlisting.