
Big Data interview questions for freshers
1. Can you explain what Big Data is, like you would to a five-year-old?
2. Why is it called 'Big' Data? What makes it so special?
3. Have you heard of Hadoop? What do you know about it?
4. What is the difference between data and information?
5. Can you give an example of a Big Data problem?
6. What are some different types of data?
7. What is data mining? What is it used for?
8. What does it mean to 'clean' data?
9. Have you ever used Excel? Is that considered 'Big Data'?
10. What are some of the tools used for Big Data?
11. What are the V's of Big Data? Can you explain each of them?
12. If you had a huge pile of toys, how would you sort them to find what you need quickly? How is this like Big Data?
13. Why do companies need Big Data engineers?
14. What do you think is the future of Big Data?
15. What is cloud computing, and how does it relate to Big Data?
16. What is a database? How does it store information?
17. How is a traditional database different from a Big Data solution?
18. What is the difference between structured and unstructured data?
19. Why is it important to process data quickly?
20. What do you know about data security and privacy in the context of Big Data?
21. What does it mean to visualize data? Why is it helpful?
22. What is machine learning? How is it connected to Big Data?
23. Have you ever used SQL? What do you know about it?
24. What are some of the challenges when working with Big Data?
25. What is data warehousing?
26. What is a data lake?
27. Can you describe a project where you had to analyze a large dataset?
28. What are some common programming languages used in Big Data?
29. What is NoSQL? When would you use it?
30. How does Big Data help in making better decisions?
Big Data interview questions for juniors
1. What is Big Data, like you're explaining it to a friend in elementary school?
2. Can you give a simple example of how Big Data is used in everyday life?
3. What are the Vs of Big Data? Pretend each V is a superhero. Who are they, and what powers do they have?
4. What is Hadoop, in very simple terms?
5. What is the difference between structured and unstructured data? Give an example of each.
6. What is cloud computing, and how does it relate to Big Data?
7. Have you ever used a database? If so, what kind, and what did you use it for?
8. What does ETL stand for? Imagine you're explaining it to someone who's never heard of it.
9. What are some basic tools used for working with Big Data?
10. What is data warehousing? Explain it as if you're building a toy warehouse.
11. Why is data security important in Big Data?
12. What is the difference between data and information?
13. What is data mining? Can you give a simple example?
14. What is data visualization? Why is it important?
15. What is machine learning? How is it related to Big Data?
16. Have you heard of SQL? What is it used for?
17. What is a data lake? How is it different from a data warehouse?
18. What does scalability mean in the context of Big Data?
19. What is data governance? Why is it important for companies?
20. What is data integration? Why do companies need it?
21. What are the main components of the Hadoop ecosystem?
22. Explain the concept of MapReduce in simple terms.
23. What is the purpose of HDFS in Hadoop?
24. What is a NoSQL database? Why would you use one?
25. What is the role of a data engineer? What do they do?
26. What is data quality? Why is it important?
27. What are some common challenges in working with Big Data?
28. What is data analytics? Give a real-world example.
Big Data intermediate interview questions
1. How would you handle skewed data in a MapReduce job, and what are the potential consequences of not addressing it?
2. Describe your experience with optimizing Hive queries for performance. What techniques have you used?
3. Explain the difference between 'narrow' and 'wide' transformations in Spark. Give examples.
4. How do you ensure data consistency when working with distributed data systems?
5. Walk me through the process of setting up and configuring a Hadoop cluster. What are the key considerations?
6. What are the advantages and disadvantages of using Parquet versus Avro file formats in a Big Data environment?
7. How do you monitor the health and performance of a Big Data cluster? What metrics are important?
8. Describe a situation where you had to debug a complex Big Data pipeline. What tools and techniques did you use?
9. Explain the concept of data partitioning in Hadoop and how it impacts performance.
10. How would you design a Big Data solution for processing real-time streaming data?
11. What is the role of a YARN ResourceManager in a Hadoop cluster?
12. Explain the difference between HDFS and object storage (like AWS S3) and when you would use each.
13. How can you use Bloom filters to optimize query performance in Big Data systems?
14. Describe a time when you had to optimize a Spark application for memory usage. What steps did you take?
15. Explain how you would implement data governance and security policies in a Big Data environment.
16. How do you handle data versioning and lineage in a Big Data project?
17. Discuss the challenges of integrating Big Data technologies with traditional data warehousing systems.
18. Explain the concept of lambda architecture and its benefits and drawbacks.
19. How would you approach building a data lake for a large organization? What are the key considerations?
20. Describe your experience with using different types of NoSQL databases (e.g., Cassandra, MongoDB) in Big Data applications.
21. How do you ensure data quality in a Big Data pipeline, and what tools do you use?
22. Explain how you would use machine learning techniques to improve the performance of a Big Data system.
23. How can you leverage cloud-based Big Data services (e.g., AWS EMR, Google Dataproc) to reduce costs and improve scalability?
24. Describe your experience with using Apache Kafka for real-time data ingestion.
25. How would you design a system to detect and prevent fraud using Big Data analytics?
26. Explain the importance of data compression in Big Data systems and the different compression algorithms available.
27. How do you handle evolving data schemas in a Big Data environment?
28. Discuss the challenges of working with unstructured data in Big Data projects and how you would address them.
29. Explain how you can use Apache Zeppelin or Jupyter notebooks for data exploration and visualization in a Big Data context.
30. Describe your experience with using Apache Airflow or similar workflow management tools to orchestrate Big Data pipelines.
Big Data interview questions for experienced
1. Explain a complex data pipeline you designed, detailing the challenges and how you overcame them. What trade-offs did you make?
2. Describe a time you had to optimize a Big Data system for performance. What tools and techniques did you use?
3. How do you ensure data quality and consistency across a large-scale distributed system?
4. Discuss your experience with different Big Data storage solutions (e.g., HDFS, cloud storage). What are the pros and cons of each?
5. Explain how you would approach building a real-time data processing system for a high-volume data stream.
6. Describe your experience with different Big Data processing frameworks (e.g., Spark, Flink). When would you choose one over the other?
7. How do you handle data security and privacy in a Big Data environment, especially concerning sensitive information?
8. Explain your understanding of data governance and its importance in a Big Data context.
9. Describe a time you had to debug a complex issue in a distributed Big Data system. What was your approach?
10. How do you monitor and maintain a large-scale Big Data infrastructure to ensure its reliability and availability?
11. Discuss your experience with data modeling for Big Data, including different schema designs (e.g., star, snowflake).
12. Explain how you would design a system to handle data ingestion from multiple sources with varying data formats and speeds.
13. Describe your experience with using machine learning on Big Data. What algorithms have you used, and what were the challenges?
14. How do you approach capacity planning for a Big Data system to handle future growth and changing data volumes?
15. Discuss your understanding of the CAP theorem and its implications for designing distributed Big Data systems.
16. Explain how you would implement data lineage in a Big Data environment to track the origin and transformations of data.
17. Describe your experience with using cloud-based Big Data services (e.g., AWS, Azure, GCP). What are the benefits and drawbacks?
18. How do you ensure fault tolerance and high availability in a Big Data system?
19. Discuss your understanding of data warehousing and its relationship to Big Data technologies.
20. Explain how you would design a Big Data system to support both batch and real-time analytics.
21. Describe a time you had to collaborate with a team of data scientists, engineers, and business stakeholders on a Big Data project. What were the key challenges and how did you overcome them?

Big data roles are in high demand, requiring professionals with expertise in areas like Hadoop, Spark, and data warehousing; just like how to hire big data engineers is also a trending topic. Preparing for interviews can be daunting, but having a targeted question list can greatly streamline the process.
This blog post provides a carefully curated list of big data interview questions, tailored for various experience levels, from freshers to experienced professionals, and even includes multiple-choice questions. It aims to equip interviewers with the right questions to assess candidates thoroughly.
By using these questions, you can ensure you're evaluating candidates against the skills you need. To further refine your hiring process, consider using Adaface's Big Data assessments, Spark assessments and other related tests to identify top talent before the interview stage.
Table of contents
Big Data interview questions for freshers
Big Data interview questions for juniors
Big Data intermediate interview questions
Big Data interview questions for experienced
Big Data MCQ
Which Big Data skills should you evaluate during the interview phase?
Ace Your Big Data Hiring with Skills Tests and Targeted Interview Questions
Download Big Data interview questions template in multiple formats
Big Data interview questions for freshers
1. Can you explain what Big Data is, like you would to a five-year-old?
Imagine you have a HUGE box of toys, bigger than your house! That's kind of like Big Data. It's lots and lots of information, so much that a normal computer can't easily handle it. Think about trying to count every grain of sand on the beach - it's a lot!
This 'big' information can be things like videos everyone watches, or all the numbers on a game, or even pictures. Because it's so much, we need special ways to look at it and learn from it, so we can find the toys we're looking for or maybe understand what everyone likes to play with the most.
2. Why is it called 'Big' Data? What makes it so special?
Big Data is called 'big' due to the sheer volume of data involved, but size isn't the only factor. It's also about the velocity (speed at which data is generated), variety (different data types and sources), veracity (data quality and accuracy), and sometimes value (the insights gained).
What makes it special is the need for specialized tools and techniques to process and analyze this data. Traditional databases often struggle with the scale and complexity. Technologies like Hadoop, Spark, and cloud-based solutions are commonly used to handle Big Data, enabling organizations to extract meaningful insights that were previously impossible to obtain. For example, analyzing log files from thousands of servers to identify security threats or customer behavior patterns.
3. Have you heard of Hadoop? What do you know about it?
Yes, I have heard of Hadoop. It's a distributed processing framework designed to handle large datasets across clusters of computers using simple programming models. At its core, it comprises the Hadoop Distributed File System (HDFS) for storage and MapReduce for parallel processing.
Specifically, HDFS provides a fault-tolerant, high-throughput way to store data, splitting files into blocks and replicating them across multiple nodes. MapReduce enables parallel processing by dividing a task into smaller map and reduce jobs, distributing them across the cluster, and aggregating the results. YARN (Yet Another Resource Negotiator) is the resource management layer in Hadoop, responsible for allocating cluster resources to different applications.
4. What is the difference between data and information?
Data is raw, unorganized facts that need to be processed. It can be numbers, letters, symbols, or even images. It doesn't have any inherent meaning on its own.
Information, on the other hand, is processed, organized, and structured data. It provides context, meaning, and insights. Information is essentially data that has been made useful and understandable.
5. Can you give an example of a Big Data problem?
A classic Big Data problem is analyzing social media sentiment. Imagine trying to understand public opinion about a new product launch. You'd need to collect and process massive amounts of data from platforms like Twitter, Facebook, and Instagram. This data is unstructured (text, images, videos), arrives at a high velocity (real-time streams), and varies greatly in content, necessitating distributed processing and specialized techniques like natural language processing to extract meaning and identify sentiment (positive, negative, neutral) at scale.
Another example is fraud detection in financial transactions. Banks handle millions of transactions daily. Identifying fraudulent activity requires analyzing patterns across vast datasets, including transaction history, location data, and user behavior. Machine learning models can be trained on this data to detect anomalies indicative of fraud, but the sheer volume and speed of transactions necessitate a Big Data approach for real-time analysis.
6. What are some different types of data?
Different types of data can be categorized in several ways. At a high level, we often distinguish between qualitative (descriptive) and quantitative (numerical) data. Qualitative data includes things like colors, textures, smells, tastes, appearance, beauty, etc. Quantitative data includes things like length, height, area, volume, weight, speed, time, temperature, humidity, sound levels, cost, members, ages, etc.
In computer science and programming, data types are more specific. Common examples include:
- Primitive types:
integer,float,boolean,character(orstringfor a sequence of characters) - Abstract/Complex data types:
arrays,lists,trees,graphs,dictionaries,objectsand custom-defined classes/structs.
7. What is data mining? What is it used for?
Data mining is the process of discovering patterns, trends, and useful information from large datasets. It involves using various techniques, including statistical analysis, machine learning, and database systems, to extract knowledge that can be used for decision-making.
Data mining is used for a wide range of purposes, such as:
- Customer Relationship Management (CRM): Identifying customer segments, predicting customer churn, and personalizing marketing campaigns.
- Fraud Detection: Detecting fraudulent transactions in banking, insurance, and other industries.
- Market Basket Analysis: Identifying products that are frequently purchased together.
- Risk Management: Assessing and mitigating risks in financial institutions.
- Healthcare: Improving diagnosis, treatment, and patient care.
8. What does it mean to 'clean' data?
Data cleaning, also known as data cleansing, is the process of identifying and correcting inaccuracies, inconsistencies, and redundancies in a dataset. It aims to improve the data's quality, making it suitable for analysis and decision-making.
This often involves several steps, including:
- Handling missing values: Imputing or removing records with missing data.
- Correcting errors: Fixing typos, inconsistencies in formatting, and invalid entries.
- Removing duplicates: Eliminating redundant records.
- Standardizing data: Ensuring consistent units, formats, and naming conventions.
- Resolving inconsistencies: Addressing conflicting information across different data sources. The goal is always to have 'clean', accurate, and reliable data.
9. Have you ever used Excel? Is that considered 'Big Data'?
Yes, I have used Excel. While Excel is a useful tool for data analysis and manipulation, it is generally not considered a 'Big Data' technology.
Big Data typically refers to datasets that are too large, complex, and fast-moving for traditional data processing applications like Excel. Big Data often involves technologies such as Hadoop, Spark, cloud-based storage and processing, and specialized databases to handle the volume, velocity, and variety of data.
10. What are some of the tools used for Big Data?
Several tools are essential for working with Big Data, and they span across different categories such as data storage, processing, and analytics. Some commonly used tools include:
- Hadoop: A distributed storage and processing framework.
- Spark: A fast, in-memory data processing engine.
- Kafka: A distributed streaming platform.
- Hive: A data warehouse system for querying and analyzing large datasets stored in Hadoop.
- Pig: A high-level platform for creating MapReduce programs used with Hadoop.
- NoSQL databases: Databases like Cassandra and MongoDB for handling unstructured data.
- Cloud-based solutions: Services like Amazon Web Services (AWS), Google Cloud Platform (GCP), and Azure offer various Big Data tools, including data lakes, data warehousing, and analytics services.
11. What are the V's of Big Data? Can you explain each of them?
The V's of Big Data are characteristics that define it. Common ones include:
- Volume: Refers to the sheer amount of data. Big Data deals with massive datasets, often terabytes or petabytes in size.
- Velocity: Represents the speed at which data is generated and processed. Think of real-time streaming data.
- Variety: Denotes the different types of data. This includes structured data (databases), semi-structured data (XML, JSON), and unstructured data (text, images, video).
- Veracity: Concerns the accuracy and reliability of the data. Big Data often comes from many sources, making data quality a challenge.
- Value: The ability to turn large amount of data into a actionable result.
- Volatility: How long you need the data for.
12. If you had a huge pile of toys, how would you sort them to find what you need quickly? How is this like Big Data?
To quickly find a specific toy in a huge pile, I would first categorize the toys based on easily identifiable characteristics like:
- Type: (e.g., cars, dolls, puzzles, building blocks)
- Size: (e.g., small, medium, large)
- Color: (e.g., red, blue, green)
Then, within each category, I could use further sub-categorization or indexing (e.g., alphabetical order for doll names) to narrow down the search. This is similar to Big Data because Big Data involves massive datasets that need to be organized and processed efficiently. Techniques like data partitioning (similar to categorizing toys), indexing, and using appropriate data structures (like hash tables or B-trees) are used to quickly search and retrieve specific data points. Just as efficiently sorting toys helps you find a specific one quickly, Big Data techniques enable fast access to valuable information within large datasets.
13. Why do companies need Big Data engineers?
Companies need Big Data engineers to manage and process large volumes of data that traditional systems can't handle. These engineers build and maintain the infrastructure required to store, process, and analyze data from various sources. This enables businesses to gain valuable insights, improve decision-making, and develop new products and services.
Specifically, they:
- Build data pipelines: Efficiently move data from source to storage.
- Implement data storage solutions: Designing and managing databases like Hadoop, NoSQL databases, and cloud storage.
- Develop data processing frameworks: Utilizing technologies such as Spark and Flink to transform and analyze big data.
14. What do you think is the future of Big Data?
The future of Big Data is likely to be defined by increased accessibility, automation, and integration with other emerging technologies. We'll see a shift towards democratized data access, empowering more users to leverage insights without requiring specialized expertise. Technologies like AutoML and AI-driven data pipelines will automate data preparation, analysis, and model deployment, reducing manual effort and accelerating time-to-value.
Furthermore, expect deeper integration with cloud computing, IoT, and edge computing. This will enable real-time data processing and analysis closer to the source, leading to faster and more responsive decision-making. Focus areas will also include enhancing data privacy and security in handling large datasets, developing improved data governance frameworks and focusing on more explainable AI (XAI) for building trust in model predictions. Techniques for working with unstructured data like video and natural language will gain prominence.
15. What is cloud computing, and how does it relate to Big Data?
Cloud computing is the on-demand delivery of computing services—including servers, storage, databases, networking, software, analytics, and intelligence—over the Internet ("the cloud") to offer faster innovation, flexible resources, and economies of scale. You typically pay only for cloud services you use, helping lower your operating costs, run your infrastructure more efficiently, and scale as your business needs change.
Cloud computing provides the infrastructure, platform, and software needed for Big Data processing and analytics. Big Data often involves massive datasets that require significant computing power and storage, which can be expensive and difficult to manage on-premises. Cloud platforms offer scalable and cost-effective solutions for storing, processing, and analyzing Big Data using services like distributed storage (e.g., Amazon S3, Azure Blob Storage), data processing frameworks (e.g., Apache Spark, Hadoop on AWS EMR or Azure HDInsight), and data warehousing solutions (e.g., Amazon Redshift, Azure Synapse Analytics). Without cloud computing, managing and processing Big Data would be significantly more complex and expensive.
16. What is a database? How does it store information?
A database is an organized collection of structured information, or data, typically stored electronically in a computer system. Databases are designed to efficiently manage and retrieve large volumes of data. They act as a digital filing system, allowing users to create, read, update, and delete data in a controlled and secure manner.
Databases store information in various ways depending on the type of database. Relational databases, for example, store data in tables with rows and columns, defining relationships between different pieces of data. Non-relational databases (NoSQL) use different models such as document-based, key-value, or graph databases, each optimized for specific use cases and data structures. The data is physically stored on storage devices like hard drives or SSDs in a format that the database management system (DBMS) can understand and manage. Indexes are also commonly used to speed up data retrieval.
17. How is a traditional database different from a Big Data solution?
Traditional databases are typically relational databases (RDBMS) designed for structured data that can fit on a single machine. They emphasize ACID properties (Atomicity, Consistency, Isolation, Durability) and are optimized for transactional workloads with well-defined schemas and smaller data volumes. Scaling often involves vertical scaling (increasing the resources of a single server). Big Data solutions, on the other hand, are designed to handle massive volumes of structured, semi-structured, and unstructured data that cannot be processed using traditional database systems. They prioritize scalability, fault tolerance, and horizontal scaling (adding more machines to the cluster).
Big Data solutions often employ distributed processing frameworks like Hadoop and Spark, and NoSQL databases, such as Cassandra or MongoDB. While ACID properties might be relaxed (often focusing on eventual consistency), they can handle a much larger variety of data types and processing needs like batch processing, real-time analytics and complex transformations. They use techniques like data sharding, replication, and distributed computing to achieve high throughput and availability, trading some consistency guarantees for speed and scalability.
18. What is the difference between structured and unstructured data?
Structured data is organized in a predefined format, making it easily searchable and analyzable. Think of a relational database with rows and columns, or a CSV file. It adheres to a schema. Unstructured data, on the other hand, doesn't have a predefined format. Examples include text documents, images, audio files, and video files. It's harder to search and analyze directly.
Key differences include:
- Format: Structured data has a predefined format (e.g., tabular), while unstructured data does not.
- Storage: Structured data is typically stored in databases, while unstructured data is often stored in data lakes or object storage.
- Analysis: Structured data is easier to query and analyze using SQL or similar tools. Unstructured data often requires more advanced techniques like NLP or machine learning.
19. Why is it important to process data quickly?
Processing data quickly is crucial for several reasons. Primarily, faster processing enables quicker decision-making. In many scenarios, such as financial trading or real-time monitoring, timely insights derived from data are essential to capitalize on opportunities or mitigate risks. Delaying analysis can lead to missed opportunities or increased potential for negative outcomes.
Furthermore, quick data processing improves efficiency and resource utilization. By reducing the time spent on data processing, organizations can free up computational resources and personnel for other tasks. This can lead to significant cost savings and increased productivity. Consider an e-commerce site - quick data processing to handle orders leads to a better customer experience and potentially more sales.
20. What do you know about data security and privacy in the context of Big Data?
Data security and privacy in Big Data are crucial due to the volume, velocity, and variety of information involved. Security focuses on protecting data from unauthorized access, use, disclosure, disruption, modification, or destruction. This involves measures like encryption, access controls, and regular security audits. Privacy, on the other hand, concerns the rights of individuals to control how their personal data is collected, used, and shared.
Key challenges include anonymization and pseudonymization techniques to protect identities, compliance with regulations like GDPR and CCPA, and implementing robust data governance frameworks. Special consideration should be given to data minimization (collecting only necessary data), purpose limitation (using data only for specified purposes), and transparency (being clear about data usage practices).
21. What does it mean to visualize data? Why is it helpful?
Visualizing data means representing information in a graphical or pictorial format. Instead of just looking at rows and columns of numbers, we use charts, graphs, maps, and other visual elements to understand the data more easily.
It's helpful because it allows us to quickly identify patterns, trends, and outliers that might be missed if we only look at raw data. Data visualization can:
- Make complex information more accessible.
- Help in identifying relationships between variables.
- Communicate findings effectively to a wider audience.
- Reveal insights and inform decision-making.
22. What is machine learning? How is it connected to Big Data?
Machine learning (ML) is a field of computer science that allows computer systems to learn from data without being explicitly programmed. Instead of relying on pre-defined rules, ML algorithms identify patterns in data and use those patterns to make predictions or decisions. These algorithms improve their accuracy over time as they are exposed to more data.
ML and Big Data are closely connected because ML algorithms often require large amounts of data to train effectively. Big Data provides the volume, variety, and velocity of data needed for ML models to learn complex patterns and generalize well to new, unseen data. Without sufficient data, ML models can suffer from overfitting or underfitting, leading to poor performance. Thus, Big Data is a crucial enabler for many successful machine learning applications.
23. Have you ever used SQL? What do you know about it?
Yes, I have used SQL extensively. I know it's a standard language for managing and querying relational databases. I've used it for tasks like retrieving data, inserting, updating, and deleting records. I'm familiar with basic SQL commands like SELECT, INSERT, UPDATE, DELETE, CREATE, and DROP.
I also understand concepts such as:
- Data Definition Language (DDL): For defining the database schema (e.g.,
CREATE TABLE,ALTER TABLE). - Data Manipulation Language (DML): For manipulating data within the database (e.g.,
INSERT,UPDATE,DELETE). - Data Control Language (DCL): For controlling access to the database (e.g.,
GRANT,REVOKE). - Joins (INNER, LEFT, RIGHT, FULL OUTER)
- Aggregate functions (COUNT, SUM, AVG, MIN, MAX)
- Subqueries
- Indexes
- Constraints (primary key, foreign key, unique, not null)
24. What are some of the challenges when working with Big Data?
Working with Big Data presents several challenges. One major hurdle is data volume and velocity. The sheer size of datasets makes storage, processing, and analysis computationally expensive and time-consuming. High data velocity (speed at which data is generated) requires real-time or near-real-time processing capabilities. Traditional database systems often struggle to cope, necessitating distributed computing frameworks like Hadoop and Spark to manage and process such large volumes of data efficiently.
Another challenge lies in data variety and veracity. Big Data often includes structured, semi-structured, and unstructured data from diverse sources. Integrating and analyzing this heterogeneous data can be complex, requiring sophisticated data integration and transformation techniques. Ensuring data quality and accuracy (veracity) is also crucial, as noisy or inconsistent data can lead to incorrect insights and flawed decision-making. Data governance and data quality management practices are essential in dealing with big data effectively.
25. What is data warehousing?
Data warehousing is the process of collecting and storing data from various sources within an organization into a central repository. This repository is designed for analytical purposes, enabling businesses to gain insights and make informed decisions.
Data warehouses are typically characterized by their subject-oriented, integrated, time-variant, and non-volatile nature. They facilitate business intelligence activities such as reporting, online analytical processing (OLAP), and data mining, providing a historical perspective on business performance.
26. What is a data lake?
A data lake is a centralized repository that allows you to store all your structured, semi-structured, and unstructured data at any scale. It's like a large container where you can keep data in its native format until you need it. This differs from a data warehouse, which typically stores transformed, structured data for specific analytical purposes.
Key characteristics include:
- Schema-on-read: Data structure is defined when the data is queried, not when it's stored.
- Scalability: Handles vast amounts of data.
- Flexibility: Supports diverse data types and use cases.
27. Can you describe a project where you had to analyze a large dataset?
In my previous role, I worked on a project to analyze a large dataset of customer transactions for a retail company. The dataset contained several million records with details such as transaction ID, customer ID, product purchased, purchase date, and amount spent. The primary goal was to identify customer segments and understand their purchasing patterns to improve targeted marketing campaigns.
I used Python with libraries like Pandas and Scikit-learn to clean, preprocess, and analyze the data. Specifically, I performed feature engineering, created customer profiles based on transaction frequency, recency, and monetary value, and then applied clustering algorithms (K-means) to segment customers. The insights from this analysis were used to create more effective marketing strategies, leading to a significant increase in sales.
28. What are some common programming languages used in Big Data?
Several programming languages are prevalent in the Big Data domain due to their capabilities in handling large datasets and distributed processing. Some of the most common ones include:
- Java: Known for its portability and scalability, Java is widely used for developing Big Data applications on platforms like Hadoop and Spark.
- Python: With its rich set of libraries (like
Pandas,Dask, andPySpark) and ease of use, Python is popular for data analysis, machine learning, and scripting in Big Data environments. - Scala: Scala is designed to be compatible with Java and often used for developing Spark applications because it provides concise and expressive syntax.
- R: A language specifically designed for statistical computing and graphics, R is used extensively for data analysis, visualization, and statistical modeling in Big Data.
- SQL: Essential for data querying and manipulation in relational databases and data warehouses.
- C++: Used for performance-critical components and systems programming in some Big Data infrastructure.
These languages provide different strengths and are often used in combination to address the diverse needs of Big Data processing and analysis.
29. What is NoSQL? When would you use it?
NoSQL (Not Only SQL) is a type of database that differs from traditional relational databases (SQL databases). NoSQL databases often use different data structures like document, key-value, graph, or wide-column stores, which are optimized for specific needs.
NoSQL is suitable when you require high scalability, availability, and flexibility, especially with large volumes of unstructured or semi-structured data. Common use cases include social media platforms, real-time analytics, content management systems, and mobile applications where rapid development and frequent schema changes are necessary. SQL databases are better when strong ACID properties (Atomicity, Consistency, Isolation, Durability) and complex relationships are critical.
30. How does Big Data help in making better decisions?
Big Data empowers better decision-making by providing a comprehensive and granular view of information. By analyzing large volumes of structured, semi-structured, and unstructured data from various sources, organizations can identify trends, patterns, and anomalies that would be impossible to detect using traditional methods.
This deeper understanding enables data-driven decisions based on evidence rather than intuition or guesswork. For example, retailers can optimize inventory management based on real-time sales data and customer behavior, while healthcare providers can improve patient outcomes through predictive analytics. Furthermore, big data facilitates A/B testing and experimentation, allowing organizations to evaluate the impact of different strategies before implementing them on a large scale. This iterative process leads to continuous improvement and more effective decision-making across all business functions.
Big Data interview questions for juniors
1. What is Big Data, like you're explaining it to a friend in elementary school?
Imagine you have a giant box of LEGOs, way more than you could ever count easily! That's kind of like big data. It's lots and lots of information, like every book in the library or every toy in every store.
Because there's so much, we need special tools to help us find patterns and understand what's inside. It's like using a super-powered magnifying glass and sorting machine to discover cool things about all those LEGOs, like which colors are most popular or how many different ways you can build a car!
2. Can you give a simple example of how Big Data is used in everyday life?
Think about personalized recommendations when you stream a movie on Netflix or shop on Amazon. These platforms analyze massive amounts of user data – what you've watched/bought before, what similar users enjoyed, your browsing history, and even time of day – to suggest content you're likely to be interested in. This is a classic example of Big Data in action. They use algorithms to process and make sense of the huge datasets and improve the customer experience.
Another common example is in navigation apps like Google Maps or Waze. These apps collect real-time traffic data from millions of users to identify traffic jams, suggest alternative routes, and estimate arrival times. The app processes large amounts of data to improve driving efficiency.
3. What are the Vs of Big Data? Pretend each V is a superhero. Who are they, and what powers do they have?
The Vs of Big Data are often described as Volume, Velocity, Variety, Veracity, and Value.
Volume is Volumon, a giant who can store and manage massive amounts of data, limited only by his physical size. Velocity is Speedster, possessing the power of super-speed to process data streams in real-time. Variety is Shapeshifter, capable of transforming and integrating different data formats (structured, semi-structured, unstructured). Veracity is Truth Seeker, possessing the ability to identify and filter out noise, biases, and inconsistencies in the data, ensuring data quality and reliability. Value is Profit Prophet, turning raw data into actionable insights and strategic advantages that generate revenue.
4. What is Hadoop, in very simple terms?
Hadoop is essentially a way to store and process massive amounts of data across a cluster of computers. Think of it like a super-powered file system and a task manager working together.
Specifically, it consists of two main components: HDFS (Hadoop Distributed File System) which stores the data, and MapReduce (or newer frameworks like Spark or Flink) which processes that data in parallel across the cluster.
5. What is the difference between structured and unstructured data? Give an example of each.
Structured data has a predefined format, making it easily searchable and analyzable. It typically resides in relational databases. An example is a customer database with columns like customer_id, name, address, and phone_number. Each entry follows the same structure.
Unstructured data, on the other hand, lacks a predefined format, making it difficult to search and analyze directly. Examples include text documents, images, audio files, and video files. While metadata may be present, the core content doesn't adhere to a rigid schema.
6. What is cloud computing, and how does it relate to Big Data?
Cloud computing is the on-demand delivery of computing services—including servers, storage, databases, networking, software, analytics, and intelligence—over the Internet (“the cloud”) to offer faster innovation, flexible resources, and economies of scale. Instead of owning and maintaining physical data centers and servers, organizations can access these resources from a cloud provider.
Cloud computing is intrinsically linked to Big Data because it provides the infrastructure, scalability, and services required to store, process, and analyze massive datasets. Big Data applications often require significant computing power and storage capacity, which can be costly and difficult to manage on-premises. Cloud platforms offer services like distributed storage (e.g., Amazon S3, Azure Blob Storage), data processing frameworks (e.g., Hadoop, Spark managed services like AWS EMR, Azure HDInsight, Google Dataproc), and analytical tools (e.g., cloud-based data warehouses and machine learning platforms) that make it easier and more cost-effective to handle Big Data workloads.
7. Have you ever used a database? If so, what kind, and what did you use it for?
Yes, I have used databases extensively. I primarily work with relational databases like PostgreSQL and MySQL. I've used them for storing and retrieving application data, managing user accounts and permissions, and building data warehouses for reporting and analytics. I also have experience with NoSQL databases like MongoDB for storing semi-structured data.
Specifically, I've used SQL for tasks such as: SELECT, INSERT, UPDATE, DELETE operations, creating and managing tables, defining constraints, and writing stored procedures. I've also worked with ORMs (Object-Relational Mappers) like SQLAlchemy and Django ORM to interact with databases in a more Pythonic way. More recently I have worked with vector databases such as Chroma and Pinecone, using them for storing vector embeddings to support Retrieval Augmented Generation (RAG) pipelines.
8. What does ETL stand for? Imagine you're explaining it to someone who's never heard of it.
ETL stands for Extract, Transform, and Load. It's a process used to move data from various sources into a central repository, like a data warehouse, so it can be analyzed. Think of it like this: you have ingredients from different stores (extract), you prepare them by chopping, mixing, and cooking (transform), and then you serve the final dish (load) onto a plate.
- Extract: Gathering data from different systems (databases, applications, files, etc.).
- Transform: Cleaning, filtering, and converting the data into a consistent and usable format. This might involve data type conversions, calculations, joining tables, or removing duplicates.
- Load: Moving the transformed data into the target system (data warehouse, data lake, etc.)
9. What are some basic tools used for working with Big Data?
Some basic tools for working with Big Data include:
- Hadoop: A distributed storage and processing framework.
- Spark: A fast, in-memory data processing engine. Can be used for batch and stream processing.
- Hive: A data warehouse system for querying and analyzing large datasets stored in Hadoop.
- Pig: A high-level platform for creating MapReduce programs used with Hadoop.
- Kafka: A distributed streaming platform for building real-time data pipelines.
- NoSQL databases (e.g., Cassandra, MongoDB): Databases designed for handling large volumes of unstructured or semi-structured data. For instance, querying a MongoDB could look like this:
db.collection.find({}) - Cloud-based services (e.g., AWS, Azure, GCP): Offer a range of big data tools and services, like data storage, compute, and analytics.
10. What is data warehousing? Explain it as if you're building a toy warehouse.
Imagine you're building a toy warehouse. Instead of storing all the toys mixed up in the kids' rooms (like raw data spread across different operational systems), you want a neatly organized warehouse where you can easily find and analyze toy trends. That's data warehousing. It's the process of collecting data from various sources, cleaning it up, and storing it in a structured format that's optimized for querying and analysis. Think of it as taking all the different toys, categorizing them (cars, dolls, games), cleaning them (making sure they are in good shape), and placing them on shelves labeled with information like 'Toy Type,' 'Manufacturer,' and 'Year of Production'.
The goal isn't to directly use the toys for playing (like operational systems handle transactions), but to analyze the whole collection. For example, you might want to know which toy brand is most popular, or which color of toy car sells best. This analysis helps you make informed decisions, such as deciding which new toys to stock or which suppliers to focus on. So, data warehousing is all about organizing and storing data in a way that makes it easy to extract meaningful insights.
11. Why is data security important in Big Data?
Data security is crucial in Big Data due to the sheer volume, velocity, and variety of sensitive information processed and stored. A breach can expose personal details, financial records, intellectual property, and other confidential data, leading to significant financial losses, reputational damage, legal repercussions, and erosion of customer trust.
Furthermore, Big Data environments often involve complex architectures and distributed systems, creating more entry points for attackers. Robust security measures are essential to protect against unauthorized access, data theft, modification, and destruction, ensuring data integrity, availability, and confidentiality while complying with privacy regulations.
12. What is the difference between data and information?
Data is raw, unorganized facts that need to be processed. It can be any character, text, word, number, or raw observation, and is meaningless until it is organized and processed. For example, 16, 25, 32 are all data points.
Information, on the other hand, is processed, organized, structured, or presented data given context to make it meaningful and useful. It provides answers to questions like who, what, where, and when. Using the previous example, if we say "The ages of three students are 16, 25, and 32," then that is information.
13. What is data mining? Can you give a simple example?
Data mining is the process of discovering patterns, trends, and useful information from large datasets. It involves using techniques from statistics, machine learning, and database systems to extract knowledge that can be used for decision-making.
For example, a supermarket might analyze its sales data to identify which products are frequently purchased together. This information can then be used to optimize product placement in the store, offer targeted promotions, or develop new product bundles. For example, analysis might show that customers who buy coffee also tend to buy milk and sugar. The supermarket can then place these items close to each other to increase sales.
14. What is data visualization? Why is it important?
Data visualization is the graphical representation of information and data. By using visual elements like charts, graphs, and maps, data visualization tools provide an accessible way to see and understand trends, outliers, and patterns in data.
It's important because it helps:
- Identify trends and outliers: Quickly spot patterns that might be missed in raw data.
- Communicate insights: Share findings with a broader audience, regardless of their technical expertise.
- Improve decision-making: Make data-driven decisions based on clear, visual evidence.
- Increase understanding: Grasp complex data sets more easily and efficiently.
15. What is machine learning? How is it related to Big Data?
Machine learning (ML) is a subfield of artificial intelligence (AI) that focuses on enabling systems to learn from data without being explicitly programmed. It involves developing algorithms that can identify patterns, make predictions, and improve their performance over time as they are exposed to more data. Common types of machine learning include supervised learning, unsupervised learning, and reinforcement learning.
Big Data and machine learning are closely related because ML algorithms often require large amounts of data to train effectively. The more data available, the better the algorithm can learn and generalize to new, unseen data. Big Data provides the raw material for machine learning models to improve their accuracy and make better predictions. In many applications, Big Data is essentially useless without the application of ML techniques to extract meaningful insights.
16. Have you heard of SQL? What is it used for?
Yes, I have heard of SQL. SQL stands for Structured Query Language, and it is the standard language for interacting with relational database management systems (RDBMS).
It is primarily used for:
- Data retrieval: Querying and retrieving data from databases.
- Data manipulation: Inserting, updating, and deleting data within databases.
- Data definition: Creating, altering, and deleting database objects like tables, views, and indexes.
- Data control: Managing access and permissions to the database.
17. What is a data lake? How is it different from a data warehouse?
A data lake is a centralized repository that allows you to store all your structured, semi-structured, and unstructured data at any scale. It's typically stored in its native format, without requiring it to be processed first.
Data warehouses, on the other hand, are designed for structured, filtered data that has already been processed for a specific purpose. Key differences:
- Data Type: Data lakes store all types; data warehouses store structured data only.
- Processing: Data lakes process data on read ('schema-on-read'); data warehouses on write ('schema-on-write').
- Purpose: Data lakes are for exploration and discovery; data warehouses are for reporting and analysis.
- Cost: Data lakes generally utilize less expensive storage because data is not transformed upon ingestion.
18. What does scalability mean in the context of Big Data?
Scalability in Big Data refers to the system's ability to handle increasing amounts of data, users, or workload without negatively impacting performance. A scalable Big Data system can efficiently process, store, and analyze large datasets, even as the data volume grows exponentially.
This often involves horizontal scaling (adding more machines to the cluster) rather than vertical scaling (upgrading a single machine). Key characteristics include maintaining acceptable latency, throughput, and resource utilization as the system scales. Technologies like distributed processing frameworks (e.g., Hadoop, Spark) and distributed storage systems (e.g., HDFS, cloud object storage) are fundamental to achieving scalability in Big Data.
19. What is data governance? Why is it important for companies?
Data governance is the establishment of policies, processes, and standards to ensure data is managed properly across its lifecycle. It encompasses aspects like data quality, data security, data lineage, and compliance. The goal is to create a framework where data is trustworthy, consistent, and readily available for informed decision-making.
Data governance is crucial for companies because it helps them:
- Improve data quality: Ensures accurate and reliable data for analysis and reporting.
- Reduce risks: Protects sensitive data and ensures compliance with regulations (e.g., GDPR, HIPAA).
- Enhance decision-making: Provides a single source of truth for business insights.
- Increase efficiency: Streamlines data management processes and reduces data-related errors.
- Promote data literacy: Improves data understanding and usage across the organization.
20. What is data integration? Why do companies need it?
Data integration is the process of combining data from different sources into a unified view. This often involves extracting, transforming, and loading (ETL) data into a central repository like a data warehouse or data lake. Data virtualization can also be used to achieve this without physically moving data.
Companies need data integration to gain a holistic view of their business, enabling better decision-making, improved operational efficiency, and enhanced customer experiences. Without it, data silos can lead to inconsistent information, redundant efforts, and missed opportunities. Integrated data supports accurate reporting, advanced analytics, and AI/ML initiatives, thus making organizations more competitive.
21. What are the main components of the Hadoop ecosystem?
The Hadoop ecosystem is a collection of related projects built around the core Hadoop Distributed File System (HDFS) and MapReduce processing model. Key components include:
- HDFS: A distributed file system that provides high-throughput access to application data.
- MapReduce: A programming model for distributed processing of large datasets.
- YARN (Yet Another Resource Negotiator): A resource management platform responsible for allocating system resources to various applications.
- HBase: A NoSQL, column-oriented database that runs on top of HDFS.
- Hive: A data warehouse system that provides an SQL-like interface to query data stored in HDFS.
- Pig: A high-level data flow language and execution framework for parallel data processing.
- Spark: A fast and general-purpose cluster computing system.
- ZooKeeper: A centralized service for maintaining configuration information, naming, providing distributed synchronization, and group services.
- Flume: A distributed, reliable, and available service for efficiently collecting, aggregating, and moving large amounts of streaming data.
- Sqoop: A tool designed to transfer data between Hadoop and relational databases.
22. Explain the concept of MapReduce in simple terms.
MapReduce is a programming model and software framework for processing vast amounts of data in parallel on large clusters of computers. Think of it like dividing a huge task into smaller, manageable pieces that can be worked on simultaneously. The process involves two main stages:
- Map: This stage takes the input data and breaks it down into key-value pairs. Each pair represents a portion of the larger problem. The map function then processes these pairs to produce intermediate key-value pairs.
- Reduce: This stage takes the intermediate key-value pairs produced by the map stage and aggregates the values for each key. This combines the results of the parallel processing to produce the final output.
23. What is the purpose of HDFS in Hadoop?
HDFS (Hadoop Distributed File System) is the primary storage system used by Hadoop applications. It's designed to reliably store very large files across machines in a large cluster.
Essentially, HDFS provides a distributed, scalable, and fault-tolerant way to store data for Hadoop to process. It achieves this by splitting files into blocks and replicating those blocks across multiple nodes in the cluster. This replication ensures data availability even if some nodes fail.
24. What is a NoSQL database? Why would you use one?
A NoSQL database (often interpreted as "not only SQL") is a type of database that doesn't adhere to the traditional relational database management system (RDBMS) model. It offers a flexible schema and is designed to handle large volumes of unstructured or semi-structured data.
You would use a NoSQL database when:
- Handling Big Data: When you need to store and process massive datasets that exceed the capabilities of relational databases.
- Flexible Schema: When your data structure is constantly evolving or you have diverse data types.
- High Performance: When you need fast read and write speeds, particularly for high-traffic applications.
- Cloud Computing: NoSQL databases often integrate well with cloud platforms and can scale horizontally.
- Specific Data Models: When your data is better represented by document, graph, key-value, or column-family data models.
Examples include MongoDB (document-oriented), Cassandra (column-family), Redis (key-value), and Neo4j (graph database).
25. What is the role of a data engineer? What do they do?
A data engineer builds and maintains the infrastructure required for data to be reliably used by data scientists and analysts. They are responsible for data pipelines, data warehousing, and ETL processes.
Typical tasks include designing and implementing data storage solutions, building and maintaining data pipelines to ingest and process data from various sources, ensuring data quality and reliability, and optimizing data infrastructure for performance. They might use tools like Spark, Kafka, and cloud-based data warehousing solutions such as Snowflake or BigQuery. They also collaborate with other teams to understand data requirements and ensure data accessibility.
26. What is data quality? Why is it important?
Data quality refers to the overall accuracy, completeness, consistency, validity, and timeliness of data. High-quality data is fit for its intended use in operations, decision-making, and planning.
Data quality is important because poor data quality can lead to inaccurate insights, flawed decisions, inefficient operations, and increased costs. For example, incorrect customer addresses can result in failed deliveries, costing the company money and frustrating customers. Poor data quality can also lead to compliance issues and reputational damage. Good data quality ensures reliability and trustworthiness of information, resulting in improved business outcomes.
27. What are some common challenges in working with Big Data?
Working with Big Data presents several challenges. Data volume is a key issue; managing, storing, and processing massive datasets requires scalable infrastructure and efficient algorithms. Data variety, with structured, semi-structured, and unstructured data from various sources, necessitates robust data integration and transformation techniques. Data velocity, or the speed at which data is generated and processed, demands real-time or near real-time processing capabilities.
Other challenges include data veracity (dealing with data quality and inconsistencies), ensuring data security and privacy, and acquiring the necessary skills and expertise to effectively work with Big Data technologies. Resource management and high infrastructure cost can also be a common problem.
28. What is data analytics? Give a real-world example.
Data analytics is the process of examining raw data to draw conclusions about that information. It involves applying algorithmic or mechanical processes to derive insights. The goal is to discover patterns, trends, and correlations that can inform decision-making.
For example, a retail company might use data analytics to understand customer purchasing behavior. By analyzing sales data, they can identify which products are frequently bought together, which demographics are most likely to purchase certain items, and the optimal timing for promotional campaigns. This information can then be used to optimize product placement, personalize marketing efforts, and improve overall sales performance.
Big Data intermediate interview questions
1. How would you handle skewed data in a MapReduce job, and what are the potential consequences of not addressing it?
Skewed data in a MapReduce job occurs when some keys have significantly more data associated with them than others. To handle this, several strategies can be employed. One common approach is to use a combiner function to perform partial aggregation before the data is sent to the reducers. This reduces the amount of data transferred over the network. Another strategy involves salting the keys; adding a random prefix to the skewed keys distributes the load more evenly across reducers. You can also implement custom partitioning to ensure that data associated with a skewed key is distributed across multiple reducers, and then use a final reducer to aggregate the results from these partial reductions.
If skewed data isn't addressed, it can lead to several negative consequences. The most significant is that some reducers will take much longer to complete than others, leading to straggler tasks and significantly increasing the overall job completion time. This inefficiency wastes cluster resources. Furthermore, a single reducer might run out of memory if it receives too much data for a particular key, causing the job to fail.
2. Describe your experience with optimizing Hive queries for performance. What techniques have you used?
I've optimized Hive queries using several techniques. Partitioning tables based on frequently queried columns (like date or region) dramatically reduces the amount of data scanned. Bucketing further improves query performance by distributing data evenly across buckets, enabling faster joins and aggregations. Using appropriate file formats like ORC or Parquet offers significant performance gains due to their columnar storage and compression capabilities. ORC also allows predicate pushdown which further enhances performance.
Other optimization strategies include: enabling Hive's cost-based optimizer (CBO) which automatically optimizes query execution plans; tuning Hive configuration parameters (e.g., hive.exec.parallel to enable parallel execution); and using vectorized query execution when supported by file format and query type. I've also employed techniques like map-side joins (using hints like /*+ MAPJOIN(small_table) */) for small tables to avoid shuffles, and rewriting complex queries to break them down into smaller, more manageable stages.
3. Explain the difference between 'narrow' and 'wide' transformations in Spark. Give examples.
Narrow transformations in Spark are those where each partition of the RDD has all the information needed to complete the computation. This means that data from other partitions is not required. A narrow transformation results in a new partition where each input partition contributes to only one output partition. Examples include map, filter, and union. Conversely, wide transformations (or shuffle transformations) require data from multiple partitions to compute the results. This involves shuffling data across the network, which is a costly operation. Each input partition may contribute to many output partitions. Examples include groupByKey, reduceByKey, and sortByKey.
4. How do you ensure data consistency when working with distributed data systems?
Ensuring data consistency in distributed systems is challenging but crucial. Common strategies include employing distributed transactions (e.g., two-phase commit), which guarantee atomicity across multiple nodes. However, these can impact performance. Another approach is eventual consistency, where data converges to a consistent state over time. This often involves techniques like conflict resolution and versioning (using vector clocks).
Techniques like Paxos or Raft can be used for consensus among nodes, ensuring agreement on data values. Choosing the right approach depends on the application's tolerance for inconsistency and performance requirements. For example, a banking system needs strong consistency, while a social media platform might tolerate eventual consistency for some features. Additionally, proper monitoring and alerting systems are required to detect and address inconsistencies.
5. Walk me through the process of setting up and configuring a Hadoop cluster. What are the key considerations?
Setting up a Hadoop cluster involves several key steps. First, you need to plan your cluster, considering factors like the number of nodes, hardware specifications (CPU, memory, storage), and network configuration. Then you install Hadoop on each node. This involves downloading the Hadoop distribution, configuring environment variables (JAVA_HOME, HADOOP_HOME), and setting up SSH access for passwordless communication between nodes. Configuration files like core-site.xml, hdfs-site.xml, mapred-site.xml, and yarn-site.xml need to be configured to define the cluster's behavior, including the NameNode, DataNodes, ResourceManager, and NodeManagers.
Key considerations include high availability (setting up a secondary NameNode), resource management (configuring YARN for efficient resource allocation), security (implementing Kerberos authentication), monitoring (using tools like Ambari or Cloudera Manager to track cluster health), and data locality (ensuring data is processed on the nodes where it's stored to minimize network traffic). Also consider using an orchestration tool like Ansible or Puppet to automate installation and configuration.
6. What are the advantages and disadvantages of using Parquet versus Avro file formats in a Big Data environment?
Parquet and Avro are both popular columnar storage formats in Big Data, each with strengths and weaknesses. Parquet excels in analytical workloads due to its efficient data compression and encoding schemes, resulting in faster query performance, especially when selecting specific columns. Its columnar nature allows for predicate pushdown and efficient filtering. However, Parquet's schema evolution support is less robust than Avro's.
Avro, on the other hand, is row-based and well-suited for evolving schemas. It uses a schema-on-read approach, making it flexible for handling data with changing structures. Avro is favored in data streaming and message serialization scenarios. However, the row-based format and generic encoding can lead to less efficient query performance compared to Parquet, particularly for analytical queries requiring only a subset of columns.
7. How do you monitor the health and performance of a Big Data cluster? What metrics are important?
Monitoring a Big Data cluster involves tracking various metrics to ensure health and optimal performance. Key metrics include CPU utilization, memory usage, disk I/O, and network I/O across all nodes. For distributed systems, it's crucial to monitor HDFS utilization (used/total capacity), YARN resource utilization (available vs. allocated resources), and the number of active/failed tasks or jobs. You can use tools such as Ganglia, Nagios, Prometheus, or cloud-specific monitoring solutions like AWS CloudWatch or Azure Monitor. Also crucial is monitoring application-specific metrics, for example, spark application execution time, number of records processed, and task failures.
Regularly analyzing these metrics helps identify bottlenecks, resource constraints, and potential failures, allowing for proactive intervention and optimization. Setting up alerts based on predefined thresholds ensures timely notifications when critical metrics deviate from expected values. Log aggregation and analysis using tools like ELK stack (Elasticsearch, Logstash, Kibana) or Splunk aids in troubleshooting and identifying root causes of issues.
8. Describe a situation where you had to debug a complex Big Data pipeline. What tools and techniques did you use?
During a project involving real-time fraud detection, we had a complex Spark Streaming pipeline that started exhibiting inconsistent results. The pipeline involved multiple stages: data ingestion from Kafka, feature engineering, model scoring, and writing alerts to a database. To debug, I first used Spark UI to identify bottlenecks and resource contention. We discovered that a custom UDF in the feature engineering stage was occasionally causing skewed data partitions, leading to memory issues and incorrect results. I used spark.explain() and examined the execution plan to confirm this. We then used sampling and logging to isolate the problematic input data triggering the UDF issue.
To address this, we rewrote the UDF to handle edge cases and introduced a more robust partitioning strategy (using repartition() and coalesce()) based on feature value ranges. We also implemented more extensive logging with structured logging tools like Kibana to better track data flow and identify anomalies in the future. Finally, we added unit tests around the rewritten UDF and integration tests for the entire pipeline using simulated data to ensure future stability. We also monitored key metrics using Grafana to alert us to issues earlier.
9. Explain the concept of data partitioning in Hadoop and how it impacts performance.
Data partitioning in Hadoop involves dividing a large dataset into smaller, more manageable pieces called partitions or splits. These partitions are distributed across different nodes in the Hadoop cluster. The partitioner determines which node each record is sent to.
Data partitioning significantly impacts performance. By distributing data, Hadoop enables parallel processing. This means multiple nodes can process different partitions simultaneously, dramatically reducing the overall processing time. Effective partitioning ensures a balanced distribution of data across the cluster, preventing any single node from becoming a bottleneck. Poor partitioning, on the other hand, can lead to data skew, where some nodes are overloaded while others are underutilized, negatively impacting performance. Consistent Hashing or Range Partitioning are typical strategies to spread the load fairly.
10. How would you design a Big Data solution for processing real-time streaming data?
A Big Data solution for processing real-time streaming data typically involves a multi-stage architecture. First, data is ingested using a distributed message queue like Kafka or Pulsar. This provides buffering and fault tolerance. Next, a stream processing engine like Apache Flink, Spark Streaming, or Apache Beam processes the data.
The choice of processing engine depends on the required latency, complexity of transformations, and fault tolerance needs. For example, Flink excels at low-latency processing with exactly-once semantics. Processed data is then typically stored in a data lake (e.g., Hadoop HDFS, AWS S3) for batch analytics or a real-time database (e.g., Apache Cassandra, Apache Druid) for immediate querying. The output can also feed dashboards or trigger alerts. Monitoring is crucial, employing tools like Prometheus and Grafana to track performance and identify issues.
11. What is the role of a YARN ResourceManager in a Hadoop cluster?
The YARN ResourceManager is the central authority in a Hadoop YARN cluster, responsible for managing cluster resources and scheduling applications. It acts as the ultimate arbiter of resources, allocating them to various applications running in the cluster based on their resource requests and constraints. The ResourceManager has two main components: the Scheduler, which performs the actual resource allocation, and the ApplicationsManager, which manages the lifecycle of applications.
Specifically, the ResourceManager receives resource requests from ApplicationMasters, which are responsible for managing individual applications. Based on the Scheduler's algorithms (e.g., FIFO, Capacity Scheduler, Fair Scheduler), the ResourceManager grants resources to these applications in the form of containers, which are allocations of CPU, memory, and other resources on specific nodes in the cluster. It also monitors node health through NodeManagers and redistributes workload from failed nodes to other healthy nodes to ensure job completion.
12. Explain the difference between HDFS and object storage (like AWS S3) and when you would use each.
HDFS (Hadoop Distributed File System) is a distributed file system designed for large-scale data processing, closely tied to the Hadoop ecosystem. It's optimized for sequential read/write operations on large files. Object storage, like AWS S3, is a service that stores data as objects, offering features like high durability, scalability, and accessibility over HTTP. S3 is designed for storing and retrieving any amount of data, at any time, from anywhere.
You would use HDFS when you need to perform large-scale data processing and analytics within a Hadoop environment, leveraging its data locality and optimized MapReduce integration. Object storage is preferred when you require highly durable, scalable, and globally accessible storage for various use cases, such as storing backups, media files, or data for web applications. S3 is often used for general-purpose storage needs where tight integration with Hadoop is not essential.
13. How can you use Bloom filters to optimize query performance in Big Data systems?
Bloom filters are probabilistic data structures used to test whether an element is a member of a set. In Big Data systems, they can significantly optimize query performance by reducing the number of expensive lookups to the main dataset. Before querying the larger dataset (e.g., a database or a distributed file system like Hadoop), the query is first checked against a Bloom filter. If the Bloom filter returns 'false', indicating the element is definitely not in the set, then the expensive lookup is skipped. If it returns 'true', indicating the element might be in the set (with a small false positive probability), then the full lookup is performed.
This approach is especially beneficial when a large proportion of queries are for elements that are not present in the dataset. By filtering out these negative queries quickly and efficiently, Bloom filters reduce I/O operations, network traffic, and overall query latency, resulting in significant performance improvements in Big Data environments. Note the trade-off is the possibility of false positives, where the Bloom filter suggests the element is present when it's actually not, leading to an unnecessary lookup. The size of the Bloom filter determines the false positive rate; larger filters have lower false positive rates but consume more memory.
14. Describe a time when you had to optimize a Spark application for memory usage. What steps did you take?
In a previous project, I faced memory issues while processing large datasets with a Spark application. The application kept crashing with OutOfMemoryError exceptions. I addressed this by first identifying the largest consumers of memory. I used the Spark UI to monitor the storage memory usage of different RDDs and DataFrames. It pinpointed a large intermediate DataFrame created during a complex join operation as the main culprit.
To optimize, I took several steps: 1) I repartitioned the DataFrame before the join to ensure even data distribution across executors, preventing data skew. 2) I persisted only the necessary RDDs/DataFrames and unpersisted them immediately after use to free up memory. 3) I also explicitly called df.cache() where appropriate and df.unpersist() after usage. 4) I reviewed the data types and converted columns to smaller, more appropriate types where possible (e.g., IntegerType instead of LongType). Finally, I enabled tungsten mode and cost based optimizer (CBO) which significantly improved performance. These measures reduced memory consumption and stabilized the application.
15. Explain how you would implement data governance and security policies in a Big Data environment.
Implementing data governance and security policies in a Big Data environment involves several key steps. First, establish a data governance framework that defines roles, responsibilities, and processes for managing data assets. This includes defining data ownership, data quality standards, and data lineage. Then, implement access control mechanisms such as role-based access control (RBAC) to restrict data access based on user roles. Encryption both at rest and in transit is critical, as is data masking or tokenization for sensitive data. Regularly monitor data access and usage patterns for anomalies. Data loss prevention (DLP) tools can also be employed to prevent unauthorized data exfiltration.
Furthermore, data security and governance require continuous monitoring and auditing. Tools like Apache Ranger or Apache Sentry can enforce security policies across the Hadoop ecosystem. Implement data retention policies to ensure compliance with regulations. Conduct regular security audits and vulnerability assessments. Define incident response plans to address potential security breaches. Automate as many processes as possible, especially those related to access control and data quality monitoring. Finally, ensure that all big data technologies and systems are compliant with the established governance framework.
16. How do you handle data versioning and lineage in a Big Data project?
Data versioning and lineage are crucial in Big Data to track changes and understand data origins. For versioning, I'd employ techniques like immutable data storage (e.g., append-only data lakes) or version control systems integrated with data pipelines. This ensures that historical data is preserved. For lineage, I would leverage metadata management tools and implement a robust data catalog. These tools automatically track data transformations and dependencies, enabling end-to-end data flow visualization. This helps with debugging and auditing.
Specifically, this may include using tools like Apache Atlas, Apache Ranger, or commercial solutions. Also, within the data pipeline itself, logging and capturing transformation details (e.g., via Spark's lineage capabilities) is vital. Consider implementing unique identifiers for each version of the dataset or data object.
17. Discuss the challenges of integrating Big Data technologies with traditional data warehousing systems.
Integrating Big Data technologies like Hadoop or Spark with traditional data warehouses presents several challenges. Data warehouses are typically designed for structured data and SQL-based queries, while Big Data technologies can handle diverse data types (structured, semi-structured, unstructured) and offer different processing paradigms. A significant challenge lies in data integration – moving and transforming data between the systems often requires specialized tools and expertise, and ensuring data consistency can be complex. Furthermore, the cost and complexity of managing two separate infrastructures can be substantial. There is also often a skills gap within existing teams, with a need for training in new technologies and architectures.
Another challenge is query performance. While data warehouses are optimized for analytical queries on structured data, querying unstructured data in Big Data systems or across both systems can be slow and require different optimization techniques. Security and governance also need careful consideration to ensure consistent policies across both environments. Finally, deciding which data and workloads are best suited for each system (data warehouse vs. Big Data platform) requires careful analysis of data characteristics, query patterns, and business needs.
18. Explain the concept of lambda architecture and its benefits and drawbacks.
Lambda architecture is a data processing architecture designed to handle massive quantities of data by taking advantage of both batch and stream processing methods. It aims to provide low latency access to data while also providing a comprehensive and accurate view of the data. It consists of three layers: the batch layer (processes historical data), the speed layer (processes real-time data), and the serving layer (merges results from both layers).
Benefits include fault tolerance, scalability, and the ability to provide both real-time and comprehensive views of data. Drawbacks include operational complexity due to managing two separate processing pipelines (batch and speed), and challenges in maintaining consistency between the two layers. Code duplication can also be a significant issue, as the same logic often needs to be implemented in both the batch and speed layers.
19. How would you approach building a data lake for a large organization? What are the key considerations?
Building a data lake for a large organization involves careful planning and execution. I'd start by understanding the organization's specific data needs, sources, and use cases. This involves collaborating with various stakeholders to identify data requirements, security policies, and governance standards. Next, I'd focus on selecting appropriate technologies for storage (e.g., cloud-based object storage like AWS S3, Azure Blob Storage, or Google Cloud Storage), data ingestion (e.g., Apache Kafka, Apache NiFi, AWS Kinesis), data processing (e.g., Apache Spark, Hadoop), and data access/querying (e.g., Presto, Apache Hive, Spark SQL). Security at rest and in transit is critical, so encryption, access controls, and audit logging must be implemented. Data governance, including metadata management, data lineage tracking, and data quality monitoring, is also essential for maintaining data integrity and trustworthiness. Lastly, ensure there is clear documentation of all components and processes, including data dictionaries and usage guidelines.
Key considerations include scalability to handle growing data volumes, performance to enable efficient querying and analysis, cost optimization to minimize storage and processing expenses, security to protect sensitive data, and governance to ensure data quality and compliance. A phased approach, starting with a pilot project, can help to validate the architecture and identify potential issues early on. Furthermore, it's important to consider regulatory compliance requirements (e.g., GDPR, HIPAA) that may impact data storage and processing practices.
20. Describe your experience with using different types of NoSQL databases (e.g., Cassandra, MongoDB) in Big Data applications.
I've worked with both Cassandra and MongoDB in Big Data contexts. With Cassandra, I focused on its strengths in handling high-velocity, high-volume data streams for time-series analysis and real-time monitoring applications. I have experience designing data models optimized for write-heavy workloads using wide-column stores and utilizing Cassandra's tunable consistency to balance data availability with consistency requirements.
For MongoDB, my experience lies in scenarios demanding flexible schema and rapid iteration, such as storing semi-structured data from diverse sources. I used MongoDB for developing recommendation systems and customer profiling where the data structure evolved frequently. I've utilized its indexing capabilities to optimize query performance for complex aggregations and reporting tasks.
21. How do you ensure data quality in a Big Data pipeline, and what tools do you use?
Ensuring data quality in a Big Data pipeline involves implementing several checks and balances throughout the data ingestion, processing, and storage phases. I focus on preventing bad data from entering the system and correcting it when it does. Some core strategies include data validation (checking data types, formats, and ranges), data completeness checks (identifying missing values), data consistency checks (ensuring data aligns across different sources), and data deduplication (removing redundant entries).
Tools vary depending on the specific pipeline, but common choices include:
- Data validation frameworks: Great Expectations, Deequ (for Spark)
- Data profiling tools: Apache Griffin, t-digest algorithm for quantile estimation
- Workflow management tools: Apache Airflow, Apache NiFi (for data governance features)
- Monitoring tools: Prometheus, Grafana (to monitor data quality metrics over time).
- Custom scripts using languages like Python with libraries like Pandas for specific checks.
22. Explain how you would use machine learning techniques to improve the performance of a Big Data system.
Machine learning can significantly improve the performance of a Big Data system by optimizing resource allocation, predicting failures, and enhancing data processing. For instance, we can use regression models to predict query execution times based on features like data size, query complexity, and system load. This enables dynamic resource allocation, ensuring that critical queries receive adequate resources, preventing bottlenecks and improving overall throughput.
Furthermore, anomaly detection techniques, like clustering or autoencoders, can identify unusual patterns in system logs and metrics, helping predict potential hardware failures or software bugs. Early detection allows for proactive maintenance, minimizing downtime and ensuring system stability. Machine learning can also be used to optimize data compression algorithms and data partitioning strategies, further improving storage efficiency and query performance in the Big Data environment.
23. How can you leverage cloud-based Big Data services (e.g., AWS EMR, Google Dataproc) to reduce costs and improve scalability?
Cloud-based Big Data services like AWS EMR and Google Dataproc offer cost reduction and improved scalability through several mechanisms. Primarily, they utilize a pay-as-you-go model, eliminating the need for upfront infrastructure investments and ongoing maintenance costs associated with on-premise solutions. You only pay for the compute and storage resources you consume. Scalability is enhanced by the ability to dynamically provision resources based on workload demands. EMR and Dataproc allow you to easily scale up or down your cluster size to handle varying data processing needs, ensuring optimal resource utilization.
Further cost optimization can be achieved through techniques like using spot instances (AWS) or preemptible VMs (Google) for non-critical workloads, choosing the right instance types and storage classes, and leveraging auto-scaling features. These services also simplify management, reducing operational overhead and allowing teams to focus on data analysis rather than infrastructure management. By optimizing cluster configuration and leveraging cost-effective pricing models, organizations can significantly reduce their Big Data processing expenses while benefiting from on-demand scalability.
24. Describe your experience with using Apache Kafka for real-time data ingestion.
I have experience using Apache Kafka for building real-time data pipelines. I've worked with Kafka to ingest data from various sources like application logs, sensor data, and database change streams. My work involved designing Kafka topics, configuring producers and consumers, and monitoring the Kafka cluster's performance. I've also used Kafka Connect to integrate with different data sources and sinks.
Specifically, I've used tools like kafka-console-producer.sh and kafka-console-consumer.sh for testing. I have also worked with different serialization formats like Avro and JSON to efficiently store and process data. I also used Kafka Streams for some basic stream processing tasks, like filtering and aggregating events in real time. I ensured the pipelines were robust and scalable using techniques such as replication and partitioning.
25. How would you design a system to detect and prevent fraud using Big Data analytics?
To design a fraud detection system using Big Data analytics, I'd focus on several key aspects. First, I'd ingest diverse data sources like transaction logs, user activity, and device information into a data lake. Then, I'd implement real-time data processing using tools like Apache Kafka and Spark Streaming to analyze incoming data for suspicious patterns. These patterns can be identified using machine learning models trained on historical fraud data to detect anomalies.
Specifically, the system would:
- Data Ingestion: Gather data from various sources (transactions, user profiles, logs).
- Feature Engineering: Create features like transaction frequency, amount deviations, and location anomalies.
- Model Training: Train machine learning models (e.g., Random Forest, Gradient Boosting) to identify fraudulent transactions.
- Real-time Scoring: Score new transactions in real-time and flag suspicious ones.
- Alerting and Investigation: Send alerts to fraud analysts for investigation. We can also create rules based system for quick action.
26. Explain the importance of data compression in Big Data systems and the different compression algorithms available.
Data compression is crucial in Big Data systems because it reduces storage space, decreases I/O operations, accelerates data transfer, and lowers overall costs. Big Data datasets are massive, and without compression, storing and processing them would be prohibitively expensive and slow.
Several compression algorithms are available, each with its trade-offs between compression ratio and decompression speed. Some common algorithms include: Gzip (good general-purpose compression, relatively fast), LZO (very fast decompression, lower compression ratio), Snappy (designed for speed and reasonable compression), Bzip2 (higher compression ratio than Gzip, but slower), and LZ4 (extremely fast compression and decompression). The choice of algorithm depends on the specific needs of the application. For example, if fast query performance is critical, Snappy or LZO might be preferred, while if storage space is the primary concern, Bzip2 might be more suitable. Newer algorithms such as Zstandard (Zstd) offer improved compression ratios and speeds compared to older methods.
27. How do you handle evolving data schemas in a Big Data environment?
Handling evolving data schemas in a Big Data environment requires careful planning and execution. Strategies include schema evolution techniques like adding new columns with default values, using nullable fields, or employing schema versioning. Data formats like Avro and Parquet inherently support schema evolution. Data pipelines should be designed to be resilient to schema changes by incorporating validation and transformation steps to handle different versions. Downstream applications must be able to handle data in different schema versions.
28. Discuss the challenges of working with unstructured data in Big Data projects and how you would address them.
Working with unstructured data in Big Data projects presents several challenges. The primary hurdle is the lack of a predefined format, making it difficult to process and analyze directly. This necessitates significant preprocessing efforts, including data cleaning, transformation, and feature extraction. Traditional relational database systems are often ill-suited for handling the volume and variety of unstructured data, requiring the adoption of alternative storage and processing technologies like Hadoop, Spark, and NoSQL databases. Furthermore, extracting meaningful insights from unstructured data requires advanced techniques like Natural Language Processing (NLP), machine learning, and text mining, which can be computationally intensive and require specialized expertise.
To address these challenges, I would implement a multi-stage approach. First, I would employ data discovery and profiling to understand the nature and characteristics of the unstructured data. Second, I would establish a robust data ingestion pipeline using tools like Apache Kafka or Flume to collect and stream the data into a data lake. Next, I would implement data preprocessing using Spark or other distributed processing frameworks to clean, transform, and extract relevant features from the data. Finally, I would leverage machine learning algorithms and NLP techniques to analyze the preprocessed data and extract valuable insights. I would consider tools like NLTK or SpaCy for NLP tasks and frameworks like TensorFlow or PyTorch for machine learning. Code examples using python:
import nltk
from nltk.sentiment.vader import SentimentIntensityAnalyzer

nltk.download('vader_lexicon')
sid = SentimentIntensityAnalyzer()

def analyze_sentiment(text):
    scores = sid.polarity_scores(text)
    return scores

text = "This is an amazing product!"
sentiment = analyze_sentiment(text)
print(sentiment)
29. Explain how you can use Apache Zeppelin or Jupyter notebooks for data exploration and visualization in a Big Data context.
Apache Zeppelin and Jupyter notebooks are powerful tools for data exploration and visualization in Big Data due to their interactive nature and support for various data processing engines like Spark, Flink, and Hive. They allow users to write and execute code in cells, immediately visualizing the results through charts, graphs, and tables. This iterative process is essential for understanding large datasets and identifying patterns.
In a Big Data context, these notebooks can connect to distributed computing clusters to process massive amounts of data. For example, you can use Zeppelin with Spark to load data from HDFS, perform transformations using Spark DataFrames, and then visualize the results using Zeppelin's built-in charting libraries or by integrating with other visualization tools like Plotly or Bokeh. This allows for quick prototyping, data validation, and the creation of dashboards for monitoring key metrics.
30. Describe your experience with using Apache Airflow or similar workflow management tools to orchestrate Big Data pipelines.
I have used Apache Airflow extensively to orchestrate Big Data pipelines. My experience includes defining Directed Acyclic Graphs (DAGs) to manage dependencies between tasks such as data extraction, transformation, and loading (ETL) operations. I've configured Airflow to schedule pipeline runs, monitor task execution, and handle retries or failures. I'm familiar with various Airflow operators, including those for interacting with cloud storage (e.g., S3, Google Cloud Storage), data warehouses (e.g., Snowflake, BigQuery), and compute engines (e.g., Databricks, Spark).
Specifically, I built pipelines to process large datasets from various sources, transforming them into usable formats for downstream analytics and reporting. I implemented error handling and alerting mechanisms to ensure data quality and pipeline reliability. I also optimized DAGs for performance, considering factors like task parallelism and resource allocation. I monitored DAG runs through Airflow's UI and configured alerts to proactively identify and address issues.
Big Data interview questions for experienced
1. Explain a complex data pipeline you designed, detailing the challenges and how you overcame them. What trade-offs did you make?
I designed a data pipeline to ingest clickstream data from a high-volume e-commerce website, enrich it with product and user information, and load it into a data warehouse for analytics. A major challenge was handling the sheer volume and velocity of the incoming data (several million events per minute). We used Kafka as a message queue to buffer the data, allowing us to decouple the ingestion layer from the processing layer. Spark Streaming was used to process the data in micro-batches, performing transformations and aggregations. We chose Parquet as the storage format in the data warehouse for efficient querying. One trade-off was the latency introduced by micro-batching. We accepted a slight delay (a few minutes) to ensure data reliability and scalability. Another challenge was data quality. We implemented data validation checks at multiple stages of the pipeline to identify and correct errors early on. For example, we used schema validation to ensure that incoming events conform to the expected structure and implemented custom validation rules to check for inconsistencies or missing data. We also used a dead-letter queue to store events that failed validation, allowing us to investigate and reprocess them later.
2. Describe a time you had to optimize a Big Data system for performance. What tools and techniques did you use?
In my previous role, I worked on optimizing a Hadoop-based data pipeline that processed website clickstream data. The initial performance was slow, with jobs taking several hours to complete. I identified the primary bottleneck as inefficient MapReduce job configurations and suboptimal data partitioning.
To address this, I used several techniques. First, I profiled the jobs using Hadoop's built-in monitoring tools and YARN's ResourceManager UI to identify the most resource-intensive tasks. I then optimized the MapReduce job configurations, adjusting parameters like mapreduce.map.memory.mb, mapreduce.reduce.memory.mb, and mapreduce.task.io.sort.mb to better utilize available resources. I also implemented custom partitioners to ensure even data distribution across reducer nodes, reducing data skew. Furthermore, I used compression techniques like Snappy to reduce the data size, improving I/O performance. Finally, I leveraged Apache Spark for specific data transformation steps, as it offered significantly faster processing speeds compared to MapReduce for those tasks. This resulted in a substantial reduction in processing time, bringing the pipeline's completion time down to under an hour.
3. How do you ensure data quality and consistency across a large-scale distributed system?
Ensuring data quality and consistency in a large-scale distributed system involves a multi-faceted approach. Key strategies include:
- Data Validation: Implementing rigorous input validation at all entry points. This can include schema validation, data type checks, and range constraints.
- Data Lineage Tracking: Maintaining a clear record of where data originates from and how it's transformed throughout the system. This helps in identifying and resolving data quality issues.
- Data Reconciliation: Regularly comparing data across different systems or data stores to identify discrepancies. Tools like checksums and data audits can be used.
- Idempotency: Designing operations to be idempotent, meaning that executing an operation multiple times has the same effect as executing it once. This is crucial for handling failures and retries in distributed environments.
- Distributed Transactions (or eventual consistency): Utilizing mechanisms like two-phase commit (2PC) where appropriate, or embracing eventual consistency models with conflict resolution strategies for scenarios where strong consistency is not essential.
- Monitoring and Alerting: Continuously monitoring data quality metrics (e.g., completeness, accuracy, timeliness) and setting up alerts for anomalies.
- Data Governance: Establish clear policies and procedures for data management, including data ownership, access control, and data quality standards.
4. Discuss your experience with different Big Data storage solutions (e.g., HDFS, cloud storage). What are the pros and cons of each?
I have experience working with both HDFS and cloud-based storage solutions like AWS S3 and Azure Blob Storage. HDFS, being a distributed file system designed for Hadoop, offers high throughput for batch processing and is cost-effective for large-scale data storage on-premise. However, it requires significant operational overhead for cluster management, scaling, and maintenance. It's tightly coupled with the Hadoop ecosystem. Cloud storage solutions, on the other hand, provide scalability, durability, and pay-as-you-go pricing models. They offer easier management and integration with various cloud services. The cons are potential vendor lock-in, network latency, and egress costs for accessing data. Choosing the right solution depends on factors like data volume, access patterns, budget, and existing infrastructure.
5. Explain how you would approach building a real-time data processing system for a high-volume data stream.
For a real-time, high-volume data stream, I'd focus on scalability, fault tolerance, and low latency. I'd start with a distributed message queue like Kafka or RabbitMQ to ingest and buffer the data. Following that, a stream processing engine such as Apache Flink or Apache Spark Streaming would perform transformations and aggregations. I would also consider using a time-series database like InfluxDB or Prometheus for storing the processed data efficiently.
To ensure high availability, I'd deploy the system across multiple nodes, use replication for data storage, and implement monitoring and alerting to detect and respond to failures quickly. Furthermore, optimizing data serialization formats (e.g., Avro or Protocol Buffers) and tuning processing parameters can significantly improve throughput and reduce latency. The choice of appropriate data partitioning strategy plays a vital role too for scaling the system.
6. Describe your experience with different Big Data processing frameworks (e.g., Spark, Flink). When would you choose one over the other?
I have experience with both Spark and Flink. Spark is a general-purpose distributed processing engine suitable for batch and near real-time processing, leveraging resilient distributed datasets (RDDs) and DataFrames for data manipulation. Flink, on the other hand, is designed specifically for stateful stream processing.
I would choose Spark when dealing with large-scale batch processing, ETL pipelines, or iterative machine learning tasks where fault tolerance and ease of use are paramount. Spark's SQL support and extensive library ecosystem also make it attractive. Flink is my go-to choice when low-latency stream processing, complex event processing (CEP), and exactly-once semantics are critical requirements. Flink's state management and windowing capabilities are superior for real-time analytics and streaming applications that require maintaining state across events.
7. How do you handle data security and privacy in a Big Data environment, especially concerning sensitive information?
Data security and privacy in Big Data, especially with sensitive information, is handled through a multi-layered approach. This includes data encryption both in transit and at rest, robust access controls using role-based access control (RBAC) and multi-factor authentication (MFA), and data masking or anonymization techniques to protect sensitive fields. Regular security audits and vulnerability assessments are crucial for identifying and addressing potential weaknesses. We also implement data loss prevention (DLP) measures and monitor data access patterns for anomalous behavior.
Privacy is ensured by adhering to relevant regulations like GDPR or HIPAA, implementing data retention policies, and providing users with control over their data through consent mechanisms. Data minimization, which means collecting only the data that is absolutely necessary, is another key principle. Data governance frameworks are used to define data quality standards, ownership, and usage policies. We also maintain an incident response plan to address any security breaches promptly.
8. Explain your understanding of data governance and its importance in a Big Data context.
Data governance in a Big Data context refers to the policies, processes, and standards established to ensure data quality, security, compliance, and usability across the entire data lifecycle. It's about managing data as a valuable asset, defining who can access what data, how it should be used, and ensuring it meets business requirements. Data governance dictates how organizations collect, store, process, and dispose of Big Data.
Its importance stems from several factors. Big Data environments often involve diverse data sources, formats, and velocity, increasing the risk of inconsistencies, errors, and security breaches. Effective data governance helps to maintain data integrity, reduce risks associated with regulatory compliance (like GDPR or HIPAA), improves decision-making by ensuring data reliability, and enhances operational efficiency by streamlining data management processes. Without proper governance, Big Data projects can become unmanageable, unreliable, and potentially harmful to the organization.
9. Describe a time you had to debug a complex issue in a distributed Big Data system. What was your approach?
During a project involving real-time fraud detection, we experienced intermittent data loss in our Kafka pipeline. The symptoms were inconsistent, making root cause identification difficult. My approach was multi-faceted: First, I focused on monitoring and logging. I enhanced logging across all components (producers, Kafka brokers, consumers) to capture timestamps, message IDs, and system resource usage. Next, I employed correlation techniques. I traced individual messages throughout the system, using unique IDs, to pinpoint where messages were being dropped. We discovered the data loss stemmed from occasional producer overload causing timeouts. To resolve this, we implemented a combination of rate limiting on the producer side and increased buffer sizes on the Kafka brokers, ensuring better resilience to traffic spikes. The key was iteratively testing and validating each change in a staging environment mirroring production.
10. How do you monitor and maintain a large-scale Big Data infrastructure to ensure its reliability and availability?
Monitoring a large-scale Big Data infrastructure requires a multi-faceted approach focusing on key metrics and proactive maintenance. We'd use tools like Prometheus, Grafana, or cloud-native monitoring solutions (e.g., AWS CloudWatch, Azure Monitor) to track resource utilization (CPU, memory, disk I/O), network latency, and application-specific metrics (e.g., query latency, data ingestion rates, job completion times). Alerting should be configured for anomalies and thresholds to trigger automated remediation or notify on-call engineers.
Maintenance involves regular tasks such as patching operating systems and Big Data platform components (Hadoop, Spark, Kafka, etc.), performing capacity planning based on usage trends, optimizing configurations for performance, and implementing robust backup and recovery strategies. Automation, using tools like Ansible or Terraform, is crucial for managing configurations and deployments at scale. Further, regular testing of disaster recovery plans is essential to ensure business continuity.
11. Discuss your experience with data modeling for Big Data, including different schema designs (e.g., star, snowflake).
My experience with data modeling for Big Data involves designing schemas optimized for large datasets and complex analytical queries. I've worked with both star and snowflake schemas, choosing the appropriate model based on the specific requirements. For instance, I implemented a star schema for a sales analytics project where simplicity and query performance were paramount. The fact table contained sales transactions, and dimension tables held customer, product, and date information. This provided fast aggregations.
I also utilized a snowflake schema in a supply chain optimization project. The initial design had a star schema structure but the product dimension required normalization. A snowflake schema was implemented to reduce data redundancy and improve data integrity, particularly around product categories and sub-categories. While adding complexity to joins, it streamlined data maintenance and allowed for more granular reporting on product attributes. I considered denormalized designs for certain high-volume tables, trading storage space for improved read performance.
12. Explain how you would design a system to handle data ingestion from multiple sources with varying data formats and speeds.
To handle data ingestion from multiple sources with varying data formats and speeds, I would design a system with a multi-layered architecture. First, a data ingestion layer would receive data from different sources. This layer includes data connectors/adapters tailored for each source's format (e.g., REST APIs, databases, message queues like Kafka). These adapters would be responsible for initial data validation and transformation into a standardized format (e.g., JSON or Avro). Then, a data processing layer built on a distributed processing framework like Apache Spark or Flink would handle further transformations, cleansing, and enrichment. This layer allows for parallel processing to accommodate varying data speeds. Finally, the processed data would be loaded into a data storage layer, which could be a data warehouse, data lake, or a NoSQL database, depending on the analytical requirements. Using message queues between layers provides asynchronous data transfer and buffering, improving fault tolerance and scalability.
Specifically, to handle varying speeds, I'd implement rate limiting at the ingestion layer to prevent overwhelming downstream systems. I would also use a combination of batch and stream processing within the data processing layer. High-velocity data would be processed in near real-time using stream processing, while lower-velocity data could be processed in batches. Monitoring tools would be crucial for identifying bottlenecks and performance issues, allowing for adjustments to resource allocation and data processing pipelines. For example, we could use jq command line tool for transforming data.
jq '. | {field1: .original_field1, field2: .original_field2}'
13. Describe your experience with using machine learning on Big Data. What algorithms have you used, and what were the challenges?
I have experience applying machine learning techniques to large datasets using distributed computing frameworks like Spark. I've worked with algorithms such as: linear regression, logistic regression, decision trees, random forests, and k-means clustering. These algorithms are often optimized using techniques like stochastic gradient descent or mini-batch gradient descent for scalability.
Some challenges included: managing data skew which required careful sampling or re-weighting techniques, feature engineering at scale, and optimizing hyperparameters for large models. The limited RAM of worker nodes was often a challenge. Furthermore, debugging distributed ML pipelines can be complex compared to traditional single-machine setups, so I often relied on logging and metrics visualization to identify bottlenecks and errors. Another common challenge was handling missing data in large datasets and using imputation techniques without introducing bias.
14. How do you approach capacity planning for a Big Data system to handle future growth and changing data volumes?
Capacity planning for a Big Data system involves a multi-faceted approach. First, you need to understand the current system capacity and utilization. This includes metrics like storage space, processing power (CPU, memory), and network bandwidth. Monitor these metrics regularly to establish a baseline. You also need to forecast future data growth and user activity. This might involve analyzing historical trends, business projections, and planned system expansions.
Next, translate the data growth into resource requirements. For example, estimate the additional storage needed for the anticipated data volume, the processing power required for new analytics workloads, and the network bandwidth needed to handle increased data transfer. Then, plan for scaling strategies: Vertical scaling (upgrading existing hardware) and Horizontal scaling (adding more nodes to the cluster). Consider utilizing cloud-based solutions for on-demand scalability. Regularly review and adjust the capacity plan as data volumes and user activity evolve. Performance test with simulated workloads to validate the plan.
15. Discuss your understanding of the CAP theorem and its implications for designing distributed Big Data systems.
The CAP theorem states that a distributed system can only guarantee two out of the following three properties: Consistency (all nodes see the same data at the same time), Availability (every request receives a response, without guarantee that it contains the most recent version of the information), and Partition Tolerance (the system continues to operate despite arbitrary partitioning due to network failures).
In the context of Big Data systems, partition tolerance is usually a must-have. Therefore, we need to make a trade-off between consistency and availability. For systems requiring strong consistency, like financial transactions, we may choose CP (Consistency and Partition Tolerance). For systems where eventual consistency is acceptable, such as social media feeds or recommendation engines, we may opt for AP (Availability and Partition Tolerance). This choice profoundly impacts the system's architecture, data replication strategy, and how conflicts are resolved.
16. Explain how you would implement data lineage in a Big Data environment to track the origin and transformations of data.
To implement data lineage in a Big Data environment, I would use a combination of metadata management, data governance tools, and custom scripting. The goal is to capture and track the data's journey from source to destination, including all transformations. This can be achieved by:
- Metadata Extraction: Automatically extracting metadata from source systems, ETL pipelines, and data processing jobs (e.g., Spark, Hadoop). This metadata includes information about data sources, table schemas, transformation logic (SQL queries, Python scripts), and job execution details.
- Lineage Graph Construction: Building a graph representation of the data flow based on the extracted metadata. Nodes in the graph represent datasets, and edges represent transformations. Tools like Apache Atlas, Apache Ranger, or custom-built solutions can be used to manage and visualize this graph.
- Instrumentation and Auditing: Instrumenting data pipelines to capture data lineage information during runtime. This can involve logging transformation steps, tracking data dependencies, and generating audit trails. For example, in Spark, we can use Spark Listeners to track the lineage of RDDs/DataFrames. In SQL, parsing SQL queries and storing it in the metadata database. Integrating lineage capture into the CI/CD pipeline to ensure changes to ETL jobs are reflected in the lineage information.
17. Describe your experience with using cloud-based Big Data services (e.g., AWS, Azure, GCP). What are the benefits and drawbacks?
I have experience working with AWS and Azure for Big Data solutions. On AWS, I've used services like S3 for data storage, EC2 for compute, EMR (Hadoop/Spark), Athena for querying data in S3, and Redshift for data warehousing. On Azure, I've worked with Azure Blob Storage, Azure VMs, Databricks (Spark), Azure Synapse Analytics (data warehouse), and Azure Data Lake Storage. The benefits of using these services include scalability, cost-effectiveness (pay-as-you-go), and reduced infrastructure management overhead. You can scale resources up or down as needed, and you don't have to worry about maintaining the underlying hardware.
Drawbacks include vendor lock-in (switching cloud providers can be complex), potential cost overruns if resources are not managed carefully, and the need to learn the specific services and configurations for each cloud provider. Security also becomes a shared responsibility model, requiring careful configuration to protect sensitive data. For example, ensuring proper IAM roles and permissions in AWS or using Azure Active Directory for authentication.
18. How do you ensure fault tolerance and high availability in a Big Data system?
Fault tolerance and high availability in a Big Data system are typically achieved through redundancy and automated recovery mechanisms. Data replication across multiple nodes is crucial, ensuring that if one node fails, data is still accessible from others. Systems like Hadoop use HDFS, which by default replicates data three times.
Techniques like data partitioning and distributed processing also contribute. Using resource managers such as YARN, the system can automatically reschedule failed tasks onto healthy nodes. Furthermore, monitoring tools continuously track the health of the system, triggering alerts and automated failover procedures when issues arise. This approach minimizes downtime and ensures continuous operation.
19. Discuss your understanding of data warehousing and its relationship to Big Data technologies.
Data warehousing involves consolidating data from various sources into a central repository for reporting and analysis. It's designed for structured data and optimized for fast querying using SQL. Big Data technologies, on the other hand, handle massive volumes of structured, semi-structured, and unstructured data that are difficult to process using traditional database systems.
The relationship is that a data warehouse can be a consumer of Big Data. Data extracted and transformed from Big Data sources can be loaded into a data warehouse for further analysis alongside existing structured data. Big Data technologies like Hadoop and Spark can be used for the ETL (Extract, Transform, Load) processes before loading the refined data into a data warehouse. In some architectures, Big Data platforms can act as a data lake, a raw, less-processed data repository, while the data warehouse serves as a curated and optimized repository for analytical workloads.
20. Explain how you would design a Big Data system to support both batch and real-time analytics.
To design a Big Data system for both batch and real-time analytics, I would use a lambda architecture or a kappa architecture. The lambda architecture separates data processing into three layers: a batch layer (e.g., Hadoop/Spark) for historical data processing, a speed layer (e.g., Apache Storm/Flink/Spark Streaming) for real-time processing, and a serving layer to merge the outputs. Kappa Architecture simplifies by using a single streaming system (e.g., Kafka Streams, Flink) to process all data, treating historical data as a re-playable stream.
In both architectures, a message queue like Kafka acts as a central data hub. For batch processing, data is periodically processed to generate aggregated views. For real-time, the stream processing engine computes near-instantaneous results. The serving layer materializes these views/results, enabling fast querying for both historical and up-to-the-second data.
21. Describe a time you had to collaborate with a team of data scientists, engineers, and business stakeholders on a Big Data project. What were the key challenges and how did you overcome them?
In a project aimed at predicting customer churn for a telecommunications company, I collaborated with a team consisting of data scientists, engineers, and business stakeholders. The data scientists focused on model development and feature engineering using tools like Python with libraries like scikit-learn and Spark for distributed computing. Engineers were responsible for building and maintaining the data pipeline using technologies like Kafka, Hadoop, and cloud-based data warehouses (e.g., AWS S3). Business stakeholders provided domain expertise and defined the key performance indicators (KPIs) for the project, such as churn rate reduction and ROI. A key challenge was aligning the technical feasibility of the models developed by the data scientists with the business requirements and the engineering infrastructure limitations. For example, data scientists initially wanted to incorporate real-time social media sentiment data, which was technically feasible but challenging and expensive to integrate into the existing data pipeline. To overcome this, we facilitated iterative meetings with all stakeholders to prioritize the most impactful features that were also practical to implement. We used A/B testing of different model versions, along with clear communication of the costs and benefits, which helped us reach a consensus and streamline the project scope.
Big Data MCQ
Question 1.
Which type of NoSQL database is best suited for storing and retrieving data based on relationships between data points, offering high performance for complex queries involving connections between entities?
Options:
Options:
Question 2.
In the context of MapReduce, what is the primary function of a 'Combiner'?
Options:
Question 3.
Which of the following best describes the primary function of the ResourceManager in Hadoop YARN?
Options:
Question 4.
In Apache Spark, which of the following operations triggers immediate execution and returns a value to the driver program, rather than creating a lineage graph?
Options:
Question 5.
Which of the following best describes the primary purpose of the Hadoop Distributed File System (HDFS)?
options:
Options:
Question 6.
Which of the following is the primary purpose of using data serialization in Hadoop?
options:
Options:
Question 7.
In Hadoop's HDFS architecture, what is the primary responsibility of the NameNode?
Options:
Question 8.
In Apache Spark, what does 'lazy evaluation' refer to?
Options:
Question 9.
Which of the following is the most accurate description of a DataFrame in Apache Spark?
Options:
Question 10.
In Hadoop, what is the primary benefit of data locality?
Options:
Question 11.
Which of the following best describes the primary function of Apache Kafka?
Options:
Question 12.
Which of the following statements BEST describes the primary function of Apache Hive?
options:
Options:
Question 13.
Which of the following is the primary role of Apache ZooKeeper in a Hadoop cluster?
Options:
Question 14.
Which of the following statements best describes the key difference between a Data Lake and a Data Warehouse?
Options:
Options:
Question 15.
In Hadoop YARN architecture, what is the primary responsibility of the ResourceManager?
Options:
Question 16.
In Apache Spark, what is the primary purpose of an Accumulator?
Options:
Question 17.
Which of the following file formats is most suitable for efficient data processing and storage in Hadoop, especially when dealing with large datasets and complex data structures?
Options:
Question 18.
Which of the following statements best describes Resilient Distributed Datasets (RDDs) in Apache Spark?
options:
Options:
Question 19.
In Hadoop MapReduce, what is the primary function of the Partitioner?
Options:
Question 20.
Which of the following statements best describes the primary purpose of Broadcast Variables in Apache Spark?
options:
Options:
Question 21.
In Apache Spark Streaming, what is the primary purpose of micro-batching?
Options:
Question 22.
In Apache Spark Streaming, what is the primary purpose of windowing operations?
Options:
Question 23.
Which of the following data serialization formats generally offers the best performance and space efficiency in Spark, at the cost of potential limitations in cross-language compatibility and schema evolution?
options:
Options:
Question 24.
In Apache Spark, what is the primary purpose of the shuffle operation?
Options:
Question 25.
What is the primary role of the Secondary NameNode in Hadoop's HDFS?
Options:
Which Big Data skills should you evaluate during the interview phase?
Assessing every facet of a candidate in a single interview is challenging. However, for Big Data roles, focusing on key skills will help you identify top talent. These core skills are essential for anyone working with large datasets and distributed computing.
Data Modeling
See how well the candidate knows data modeling concepts by using a Data Modeling assessment. This helps you screen candidates effectively, especially for positions where this skill is needed.
Ask candidates targeted questions to reveal their practical knowledge in Data Modeling. This helps gauge their grasp of the topic beyond theoretical knowledge.
Describe a situation where you had to choose between a relational and a NoSQL database for a Big Data project. What were your considerations and final decision?
Look for a structured answer that weighs the pros and cons of each database type. The candidate should demonstrate understanding of scalability, data consistency, and query performance.
Hadoop
Gauge the candidate's proficiency in Hadoop by using an Hadoop assessment. This helps you ensure that they have the requisite knowledge to handle Big Data challenges.
Probing into a candidate's practical Hadoop experience through specific questions is useful. This can validate their skills beyond what's on paper.
Explain how you would troubleshoot a slow-running MapReduce job in a Hadoop cluster.
The answer should cover debugging steps such as checking resource utilization, analyzing logs, and optimizing the MapReduce code. They should show a good understanding of the importance of problem solving skills.
Spark
Utilize a Spark assessment to effectively screen candidates on their Spark skills. This can help filter out candidates who are strong theoretically but lack practical skills.
To assess real-world Spark skills, ask situation-based interview questions. This approach helps to gauge how candidates handle real-world challenges.
Describe a scenario where you used Spark for data transformation. What challenges did you face, and how did you overcome them?
Look for specific examples where the candidate demonstrates knowledge of Spark's data transformation capabilities. Their answer should showcase problem-solving skills and the ability to optimize Spark jobs for performance.
Ace Your Big Data Hiring with Skills Tests and Targeted Interview Questions
Hiring individuals with the right Big Data skills is paramount for success. Accurately assessing their capabilities is the first step towards building a strong team. It's not just about the resume; it's about verifying the skills.
The most effective way to evaluate candidates' abilities is through skills tests. Adaface offers a range of assessments, including our Hadoop Online Test, Spark Online Test, Hive Test, and Map Reduce Online Test to help you measure technical proficiency.
After administering these tests, you can shortlist the top-performing candidates and invite them for interviews. This approach helps you focus your time and resources on the most promising individuals, ensuring a smoother hiring process.
Ready to streamline your Big Data hiring? Explore Adaface's Big Data skills tests or sign up for a free trial to get started.
Hadoop Online Test
30 mins | 15 MCQs
The Hadoop Online Test uses scenario-based MCQ questions to evaluate candidates' ability to install Hadoop clusters on the cloud, run optimized MapReduce jobs on Hadoop clusters and write efficient Pig instructions and Hive queries to perform data analysis on complex datasets. The test screens for core Hadoop framework knowledge that hiring managers look for in Hadoop developers and administrators.
Try Hadoop Online Test
Download Big Data interview questions template in multiple formats
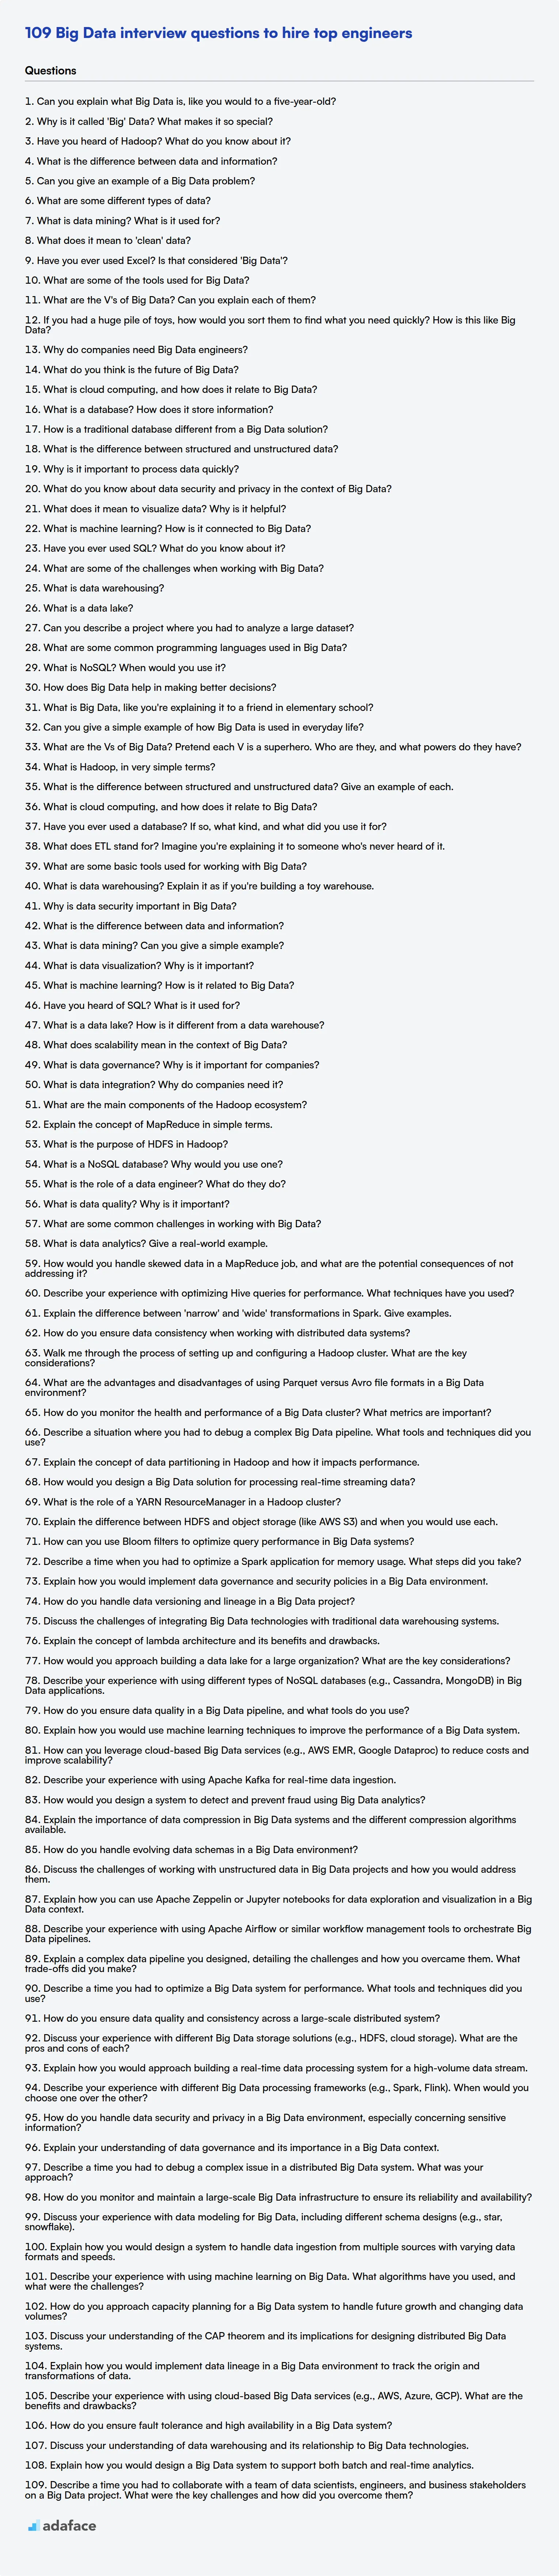
Big Data Interview Questions FAQs
What are some common Big Data interview questions for freshers?
Common questions for freshers often revolve around fundamental concepts like Hadoop architecture, MapReduce, and basic data warehousing principles.
What Big Data skills should I assess during an interview?
Assess skills like Hadoop, Spark, SQL, NoSQL databases, data modeling, and the ability to handle large datasets.
How can I evaluate a candidate's problem-solving abilities in Big Data?
Present candidates with hypothetical scenarios involving data analysis or system design to see how they approach and solve complex issues.
What are some behavioral interview questions relevant to Big Data roles?
Ask about their experience working in teams, handling pressure, and dealing with conflicting priorities in data-driven projects.
What are the key differences between the interview questions for different levels of experience?
The interview questions for freshers would focus on the basics and fundementals. While, for more experience, the questions shift to system design, problem solving and prior project experience.
How can skills tests help in the Big Data hiring process?
Skills tests offer a standardized way to assess technical skills and programming proficiency, ensuring candidates possess the capabilities they claim to have.
40 min skill tests.
No trick questions.
Accurate shortlisting.
We make it easy for you to find the best candidates in your pipeline with a 40 min skills test.
Try for freeRelated posts
Free resources

Join 1200+ companies in 80+ countries.
Try the most candidate friendly skills assessment tool today.

40 min tests.
No trick questions.
Accurate shortlisting.
No trick questions.
Accurate shortlisting.