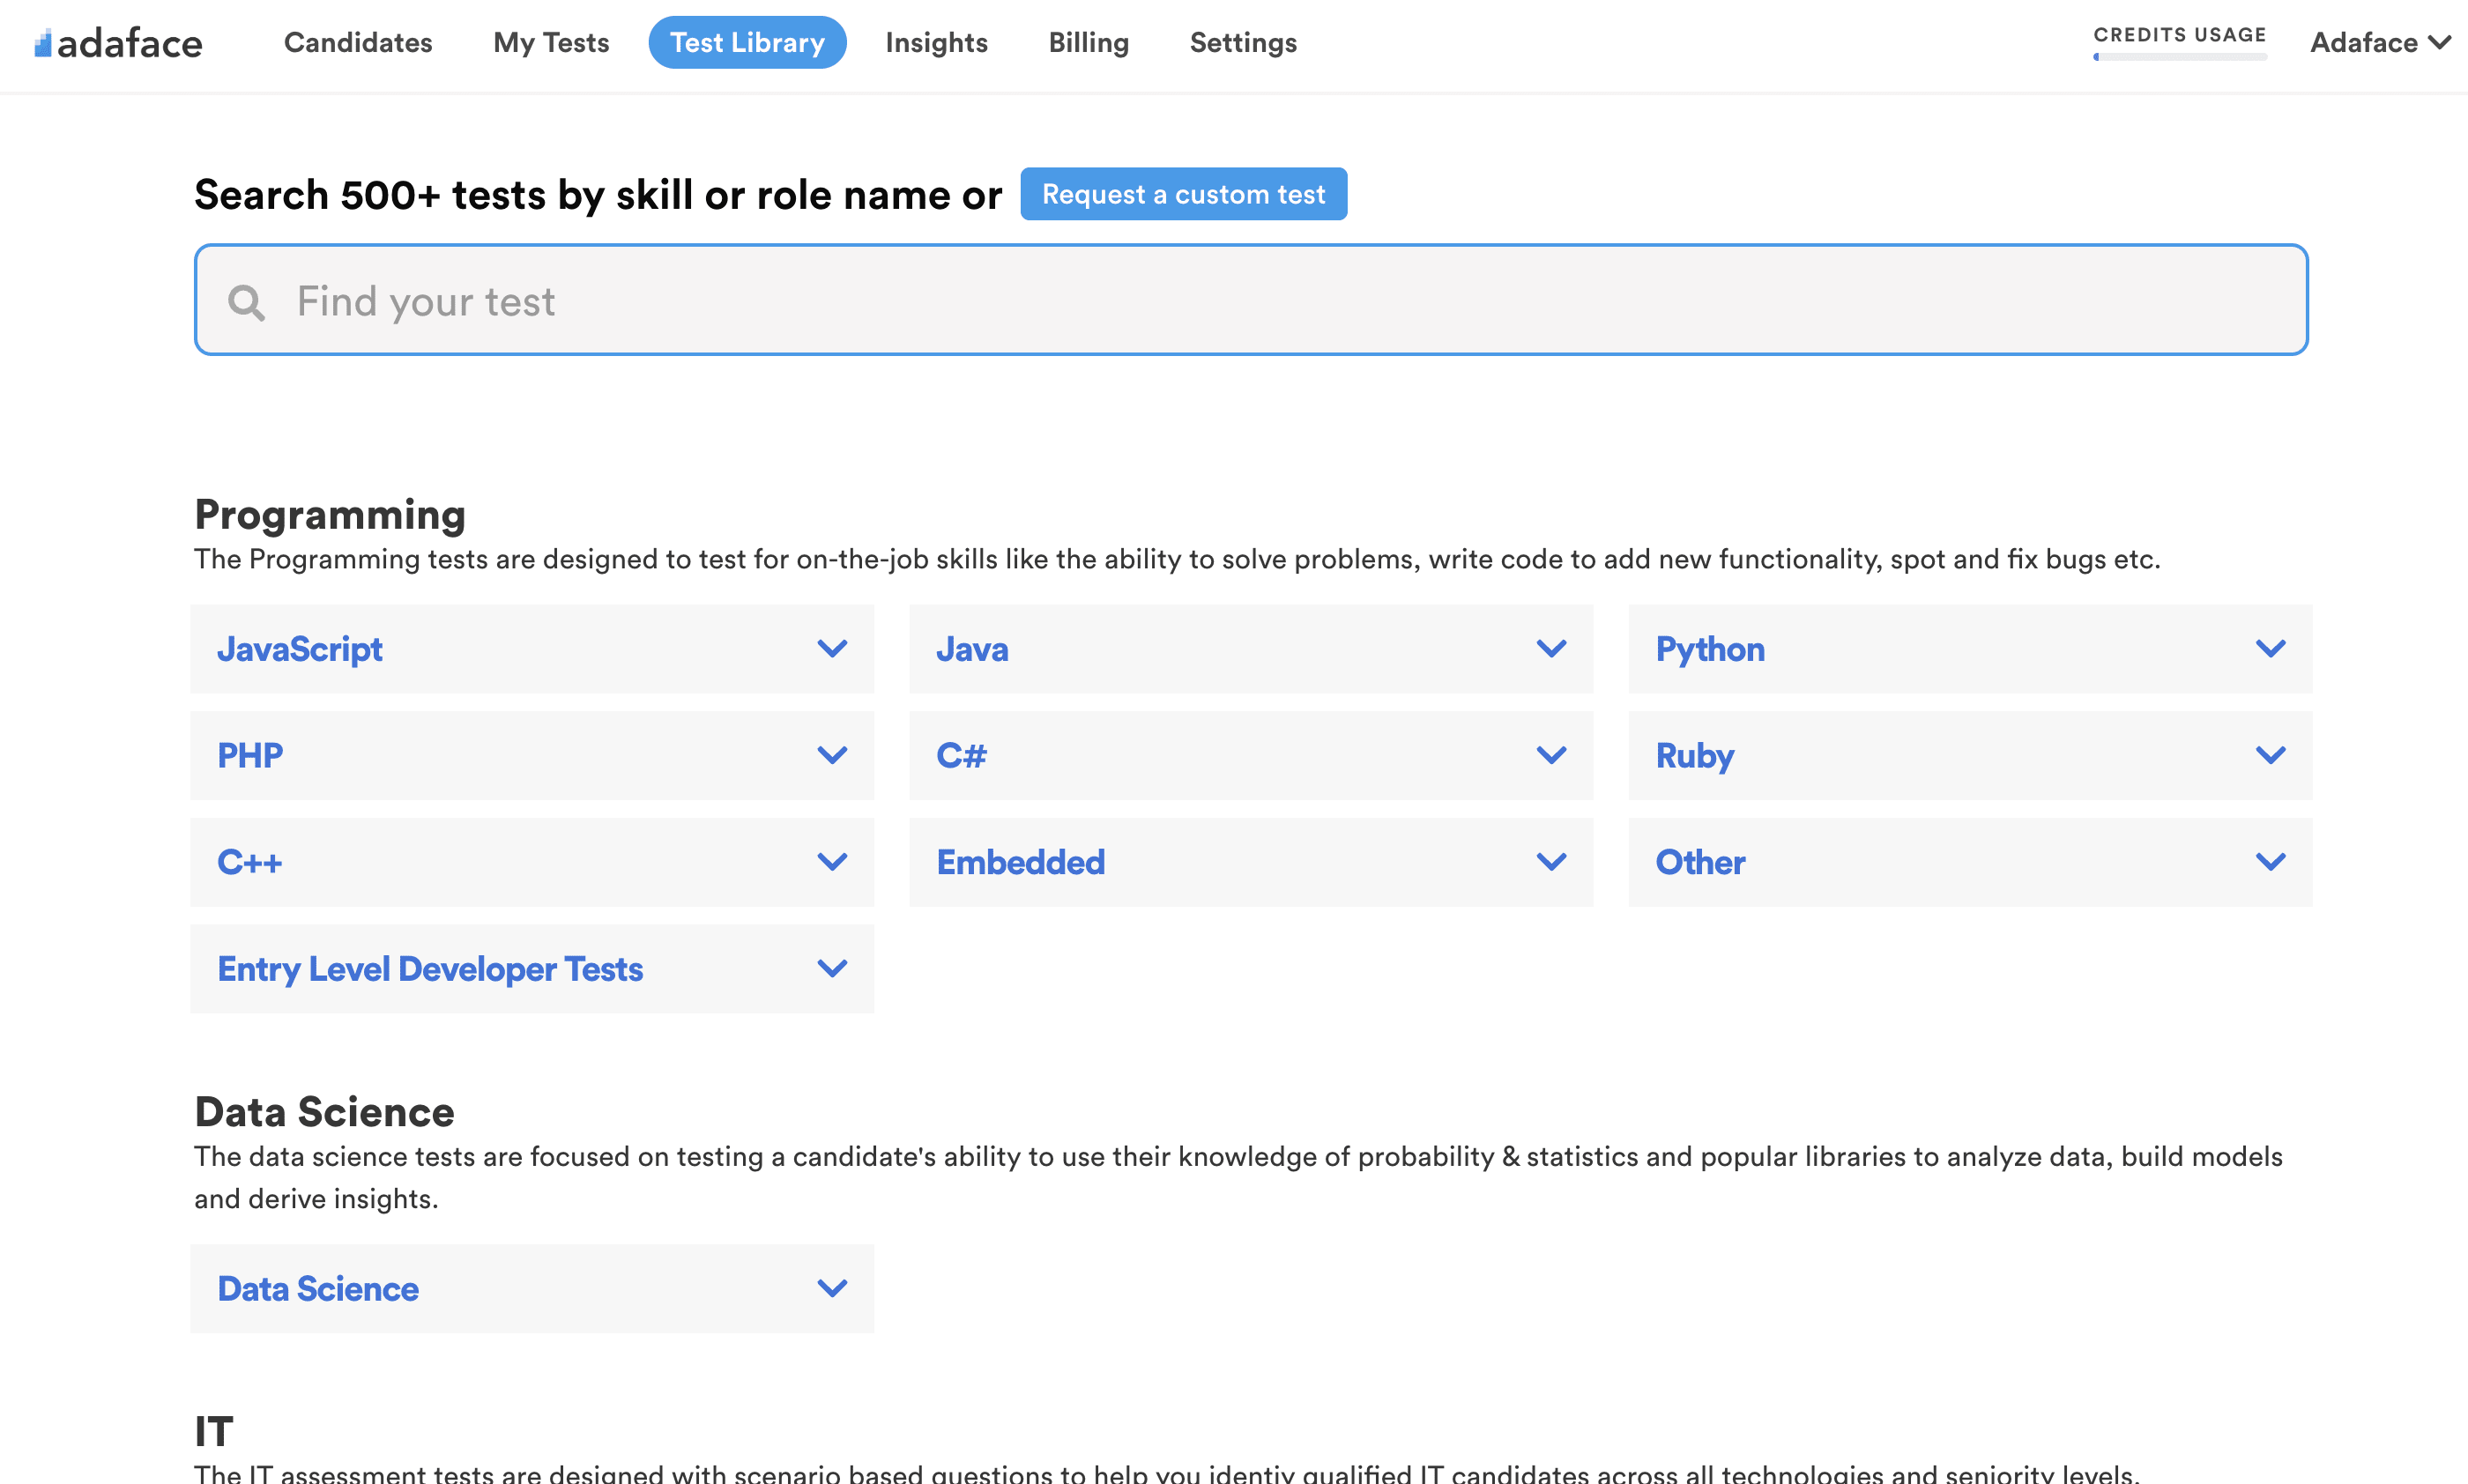
Search test library by skills or roles
⌘ K

About the test:

The Data Analytics in Excel test evaluates a candidate's ability to use Excel for data analysis and interpretation. It covers topics such as data manipulation, functions, formulas, charts, and data visualization using Excel. The test also includes scenario-based multiple-choice questions to assess problem-solving skills and critical thinking in a business context.

Covered skills:

  • Data Interpretation
  • Charts and Graphs in Excel
  • Creating and sharing reports
  • Excel functions
  • Data Analysis fundamentals

9 reasons why
9 reasons why

Adaface Data Analytics in Excel Assessment Test is the most accurate way to shortlist Data Analysts


Reason #1

Tests for on-the-job skills

The Data Analytics in Excel Test helps recruiters and hiring managers identify qualified candidates from a pool of resumes, and helps in taking objective hiring decisions. It reduces the administrative overhead of interviewing too many candidates and saves time by filtering out unqualified candidates at the first step of the hiring process.

The test screens for the following skills that hiring managers look for in candidates:

  • Efficiently analyze and interpret complex data sets
  • Apply advanced Excel functions to perform data analysis
  • Create visually appealing charts and graphs to present data
  • Demonstrate proficiency in fundamental data analysis techniques
  • Generate accurate and informative reports using Excel
  • Effectively share and communicate findings from data analysis
  • Utilize Excel formulas and functions to manipulate and transform data
  • Apply statistical analysis methods to draw meaningful insights
  • Perform data cleansing and preprocessing tasks in Excel
  • Interpret trends and patterns in data for decision-making
Reason #2

No trick questions

no trick questions

Traditional assessment tools use trick questions and puzzles for the screening, which creates a lot of frustration among candidates about having to go through irrelevant screening assessments.

View sample questions

The main reason we started Adaface is that traditional pre-employment assessment platforms are not a fair way for companies to evaluate candidates. At Adaface, our mission is to help companies find great candidates by assessing on-the-job skills required for a role.

Why we started Adaface
Reason #3

Non-googleable questions

We have a very high focus on the quality of questions that test for on-the-job skills. Every question is non-googleable and we have a very high bar for the level of subject matter experts we onboard to create these questions. We have crawlers to check if any of the questions are leaked online. If/ when a question gets leaked, we get an alert. We change the question for you & let you know.

How we design questions

These are just a small sample from our library of 10,000+ questions. The actual questions on this Data Analytics in Excel Test will be non-googleable.

🧐 Question

Medium

MATCH INDEX LOOKUP
Solve
Some friends live in adjacent apartments in a building in Central Perk, New York. We want to write a function to search the apartment number by name. Which of the following functions should we use?
 image

Medium

Organization data
Data transformation
Solve
We have two Excel files with organization data. One file has Organization ID and Organization Name fields, whereas the second file has Organization ID, Organization Name and Country fields. We wrote a query to retrieve the data from both files. Here’s a sample of the data retrieved:
 image
We want to ensure Organization ID field is unique. Which of the following is the ideal solution that ensures Organization ID field is unique while retaining Country data?

A: Select the Organization ID and Country columns, and then click Keep Duplicates.
B: Select the Organization ID and Country columns, and then click Remove Duplicates.
C: Use Group BY function to group the rows by Organization ID. Specify output columns for Organization Name and Country using MAX operation.
D: Select Organization ID column and then click Remove Duplicates. Then specify output columns for Country using MAX operation.

Medium

Student scores
Data formatting
Solve
Here’s a sample Excel data source:
 image
Here’s the expected data format: 
 image
Which of the following is the correct way to transform the data from the query editor to achieve the result?

A: Columns to Select: Student Only
B: Columns to Select: Student and Student ID
C: Columns to Select: Primary and Secondary
D: Command to Use: Pivot Column
E: Command to Use: Reverse Rows
F: Command to Use: Unpivot Columns

Medium

VLOOKUP blood donor
Solve
We are looking to find the contact number of the only blood donor with blood group O-. Which function should we use to look up the correct contact number? Here's the documentation for VLOOKUP: =VLOOKUP(lookup value, range containing the lookup value, the column number in the range containing the return value, Approximate match (TRUE) or Exact match (FALSE)).
 image
A: =VLOOKUP("O-", A1:E10, 3, TRUE)
B: =VLOOKUP("O-", A1:E10, 3, FALSE)
C: =VLOOKUP("O-", D1:D10, 4)
D: =VLOOKUP("O-", D1:D10, 3)
E: =VLOOKUP("O-", A1:E10, 4, TRUE)
F: =VLOOKUP("O-", A1:E10, 4, FALSE)
G: =VLOOKUP("Kane", A1:E10, 4)

Medium

Hiring Developer
Skewed Data
Graph
Solve
Two companies A and B hired developers from the year 2001 to 2005. The given bar graph shows the hiring details. 
 image
 image
Now select the statements that are true based on the given details.

A: The data given for Company A is skewed to the left.
B: The data given for Company B is skewed to the right.
C: The data given for Company A is skewed to the right.
D: For Company B, mean and mode are equal.
E: For Company B, mean is equal to median but less than mode.
F: For Company A, median is less than mode but greater than mean.

Medium

Negative correlation
Solve
Saffi, one of the popular schools in San Francisco did a school wide study of the students in middle school. The study found that there is a negative correlation between the time spent on Facebook per day by students and their academic achievement. How can we understand the results of this study?
A: An increase in time spent on Facebook per day causes a drop in the academic achievement of students at the middle school level.

B: There is an association between an increase in time spent on Facebook per day and the drop in the academic achievement of students at Saffi. 

C: An increase in the time spent on Facebook per day causes a drop in the academic achievement of students at Saffi. 

D: There is an association between an increase in time spent on Facebook per day and the drop in the academic achievement of students at the middle school level.
🧐 Question🔧 Skill

Medium

MATCH INDEX LOOKUP

2 mins

Excel
Solve

Medium

Organization data
Data transformation

3 mins

Excel
Solve

Medium

Student scores
Data formatting

2 mins

Excel
Solve

Medium

VLOOKUP blood donor

2 mins

Excel
Solve

Medium

Hiring Developer
Skewed Data
Graph

3 mins

Data Analysis
Solve

Medium

Negative correlation

2 mins

Data Analysis
Solve
🧐 Question🔧 Skill💪 Difficulty⌛ Time
MATCH INDEX LOOKUP
Excel
Medium2 mins
Solve
Organization data
Data transformation
Excel
Medium3 mins
Solve
Student scores
Data formatting
Excel
Medium2 mins
Solve
VLOOKUP blood donor
Excel
Medium2 mins
Solve
Hiring Developer
Skewed Data
Graph
Data Analysis
Medium3 mins
Solve
Negative correlation
Data Analysis
Medium2 mins
Solve
Reason #4

1200+ customers in 75 countries

customers in 75 countries
Brandon

With Adaface, we were able to optimise our initial screening process by upwards of 75%, freeing up precious time for both hiring managers and our talent acquisition team alike!


Brandon Lee, Head of People, Love, Bonito

Reason #5

Designed for elimination, not selection

The most important thing while implementing the pre-employment Data Analytics in Excel Test in your hiring process is that it is an elimination tool, not a selection tool. In other words: you want to use the test to eliminate the candidates who do poorly on the test, not to select the candidates who come out at the top. While they are super valuable, pre-employment tests do not paint the entire picture of a candidate’s abilities, knowledge, and motivations. Multiple easy questions are more predictive of a candidate's ability than fewer hard questions. Harder questions are often "trick" based questions, which do not provide any meaningful signal about the candidate's skillset.

Science behind Adaface tests
Reason #6

1 click candidate invites

Email invites: You can send candidates an email invite to the Data Analytics in Excel Test from your dashboard by entering their email address.

Public link: You can create a public link for each test that you can share with candidates.

API or integrations: You can invite candidates directly from your ATS by using our pre-built integrations with popular ATS systems or building a custom integration with your in-house ATS.

invite candidates
Reason #7

Detailed scorecards & benchmarks

View sample scorecard
Reason #8

High completion rate

Adaface tests are conversational, low-stress, and take just 25-40 mins to complete.

This is why Adaface has the highest test-completion rate (86%), which is more than 2x better than traditional assessments.

test completion rate
Reason #9

Advanced Proctoring


Learn more

About the Data Analytics in Excel Online Test

Why you should use Pre-employment Data Analytics in Excel Test?

The Data Analytics in Excel Test makes use of scenario-based questions to test for on-the-job skills as opposed to theoretical knowledge, ensuring that candidates who do well on this screening test have the relavant skills. The questions are designed to covered following on-the-job aspects:

  • Demonstrate proficiency in using Excel functions for data analysis
  • Create and format charts and graphs in Excel to visually represent data
  • Interpret data to identify trends, patterns, and insights
  • Apply data analysis fundamentals to solve business problems
  • Utilize advanced Excel features for data manipulation and cleansing
  • Demonstrate expertise in creating and sharing reports in Excel
  • Employ data visualization techniques to effectively communicate findings
  • Perform advanced data calculations using Excel formulas and functions
  • Apply statistical analysis methods to interpret data accurately
  • Demonstrate proficiency in using pivot tables for data analysis

Once the test is sent to a candidate, the candidate receives a link in email to take the test. For each candidate, you will receive a detailed report with skills breakdown and benchmarks to shortlist the top candidates from your pool.

What topics are covered in the Data Analytics in Excel Test?

  • Data Interpretation:

    Data interpretation involves analyzing and making sense of data to extract meaningful insights. This skill is crucial in today's data-driven world as it allows decision-makers to understand and derive valuable information from large datasets.

  • Excel functions:

    Excel functions refer to a wide range of built-in formulas that enable users to perform complex calculations, manipulate and transform data. Understanding and assessing this skill is important as it demonstrates a candidate's ability to effectively utilize Excel's functionality for data analysis and problem-solving.

  • Charts and Graphs in Excel:

    Creating charts and graphs in Excel helps visually represent data, making it easier to comprehend and analyze patterns, trends, and relationships. Testing this skill ensures that candidates possess the ability to present data in a visually appealing and informative manner.

  • Data Analysis fundamentals:

    Data analysis fundamentals encompass various techniques and methodologies employed to interpret and draw meaningful conclusions from data. Assessing this skill is important as it demonstrates a candidate's understanding of core data analysis techniques, such as summarizing, organizing, and visualizing data.

  • Creating and sharing reports:

    Creating and sharing reports involves compiling data, generating meaningful insights, and presenting them in a comprehensive manner. Evaluating this skill is crucial as it showcases a candidate's ability to communicate findings effectively and efficiently, enabling informed decision-making based on data-driven insights.

  • Full list of covered topics

    The actual topics of the questions in the final test will depend on your job description and requirements. However, here's a list of topics you can expect the questions for Data Analytics in Excel Test to be based on.

    Data validation
    Conditional formatting
    Pivot tables
    VLOOKUP function
    HLOOKUP function
    SUMIFS function
    COUNTIFS function
    Formulas and functions
    Chart types
    Trend analysis
    Slicers
    Data sorting
    Data filtering
    Power Query
    Statistical functions
    Histograms
    Histogram analysis
    Regression analysis
    Data visualization
    Data summarization
    Data interpretation
    Scenario analysis
    Data manipulation
    Data formatting
    Data aggregation
    Data modeling
    Data presentation
    Data sharing
    Report generation
    Report formatting

What roles can I use the Data Analytics in Excel Test for?

  • Data Analyst
  • Business Analyst
  • Financial Analyst
  • Business Intelligence Analyst
  • Data Scientist
  • Data Engineer
  • Data Architect
  • Business Consultant
  • Financial Consultant
  • Market Research Analyst

How is the Data Analytics in Excel Test customized for senior candidates?

For intermediate/ experienced candidates, we customize the assessment questions to include advanced topics and increase the difficulty level of the questions. This might include adding questions on topics like

  • Utilize advanced Excel features for automation and efficiency
  • Effectively use Excel's data validation and conditional formatting features
  • Apply data filtering techniques to extract relevant information
  • Demonstrate understanding of data cleaning and data transformation processes
  • Utilize Excel's data modeling capabilities to analyze complex datasets
  • Demonstrate expertise in using lookup functions for data analysis
  • Apply statistical functions in Excel to derive meaningful insights
  • Utilize Excel's regression analysis capabilities for data modeling
  • Demonstrate proficiency in using Excel's what-if analysis tools
  • Apply advanced data visualization techniques using Excel
Singapore government logo

The hiring managers felt that through the technical questions that they asked during the panel interviews, they were able to tell which candidates had better scores, and differentiated with those who did not score as well. They are highly satisfied with the quality of candidates shortlisted with the Adaface screening.


85%
reduction in screening time

Data Analytics in Excel Hiring Test FAQs

Can I combine multiple skills into one custom assessment?

Yes, absolutely. Custom assessments are set up based on your job description, and will include questions on all must-have skills you specify. Here's a quick guide on how you can request a custom test.

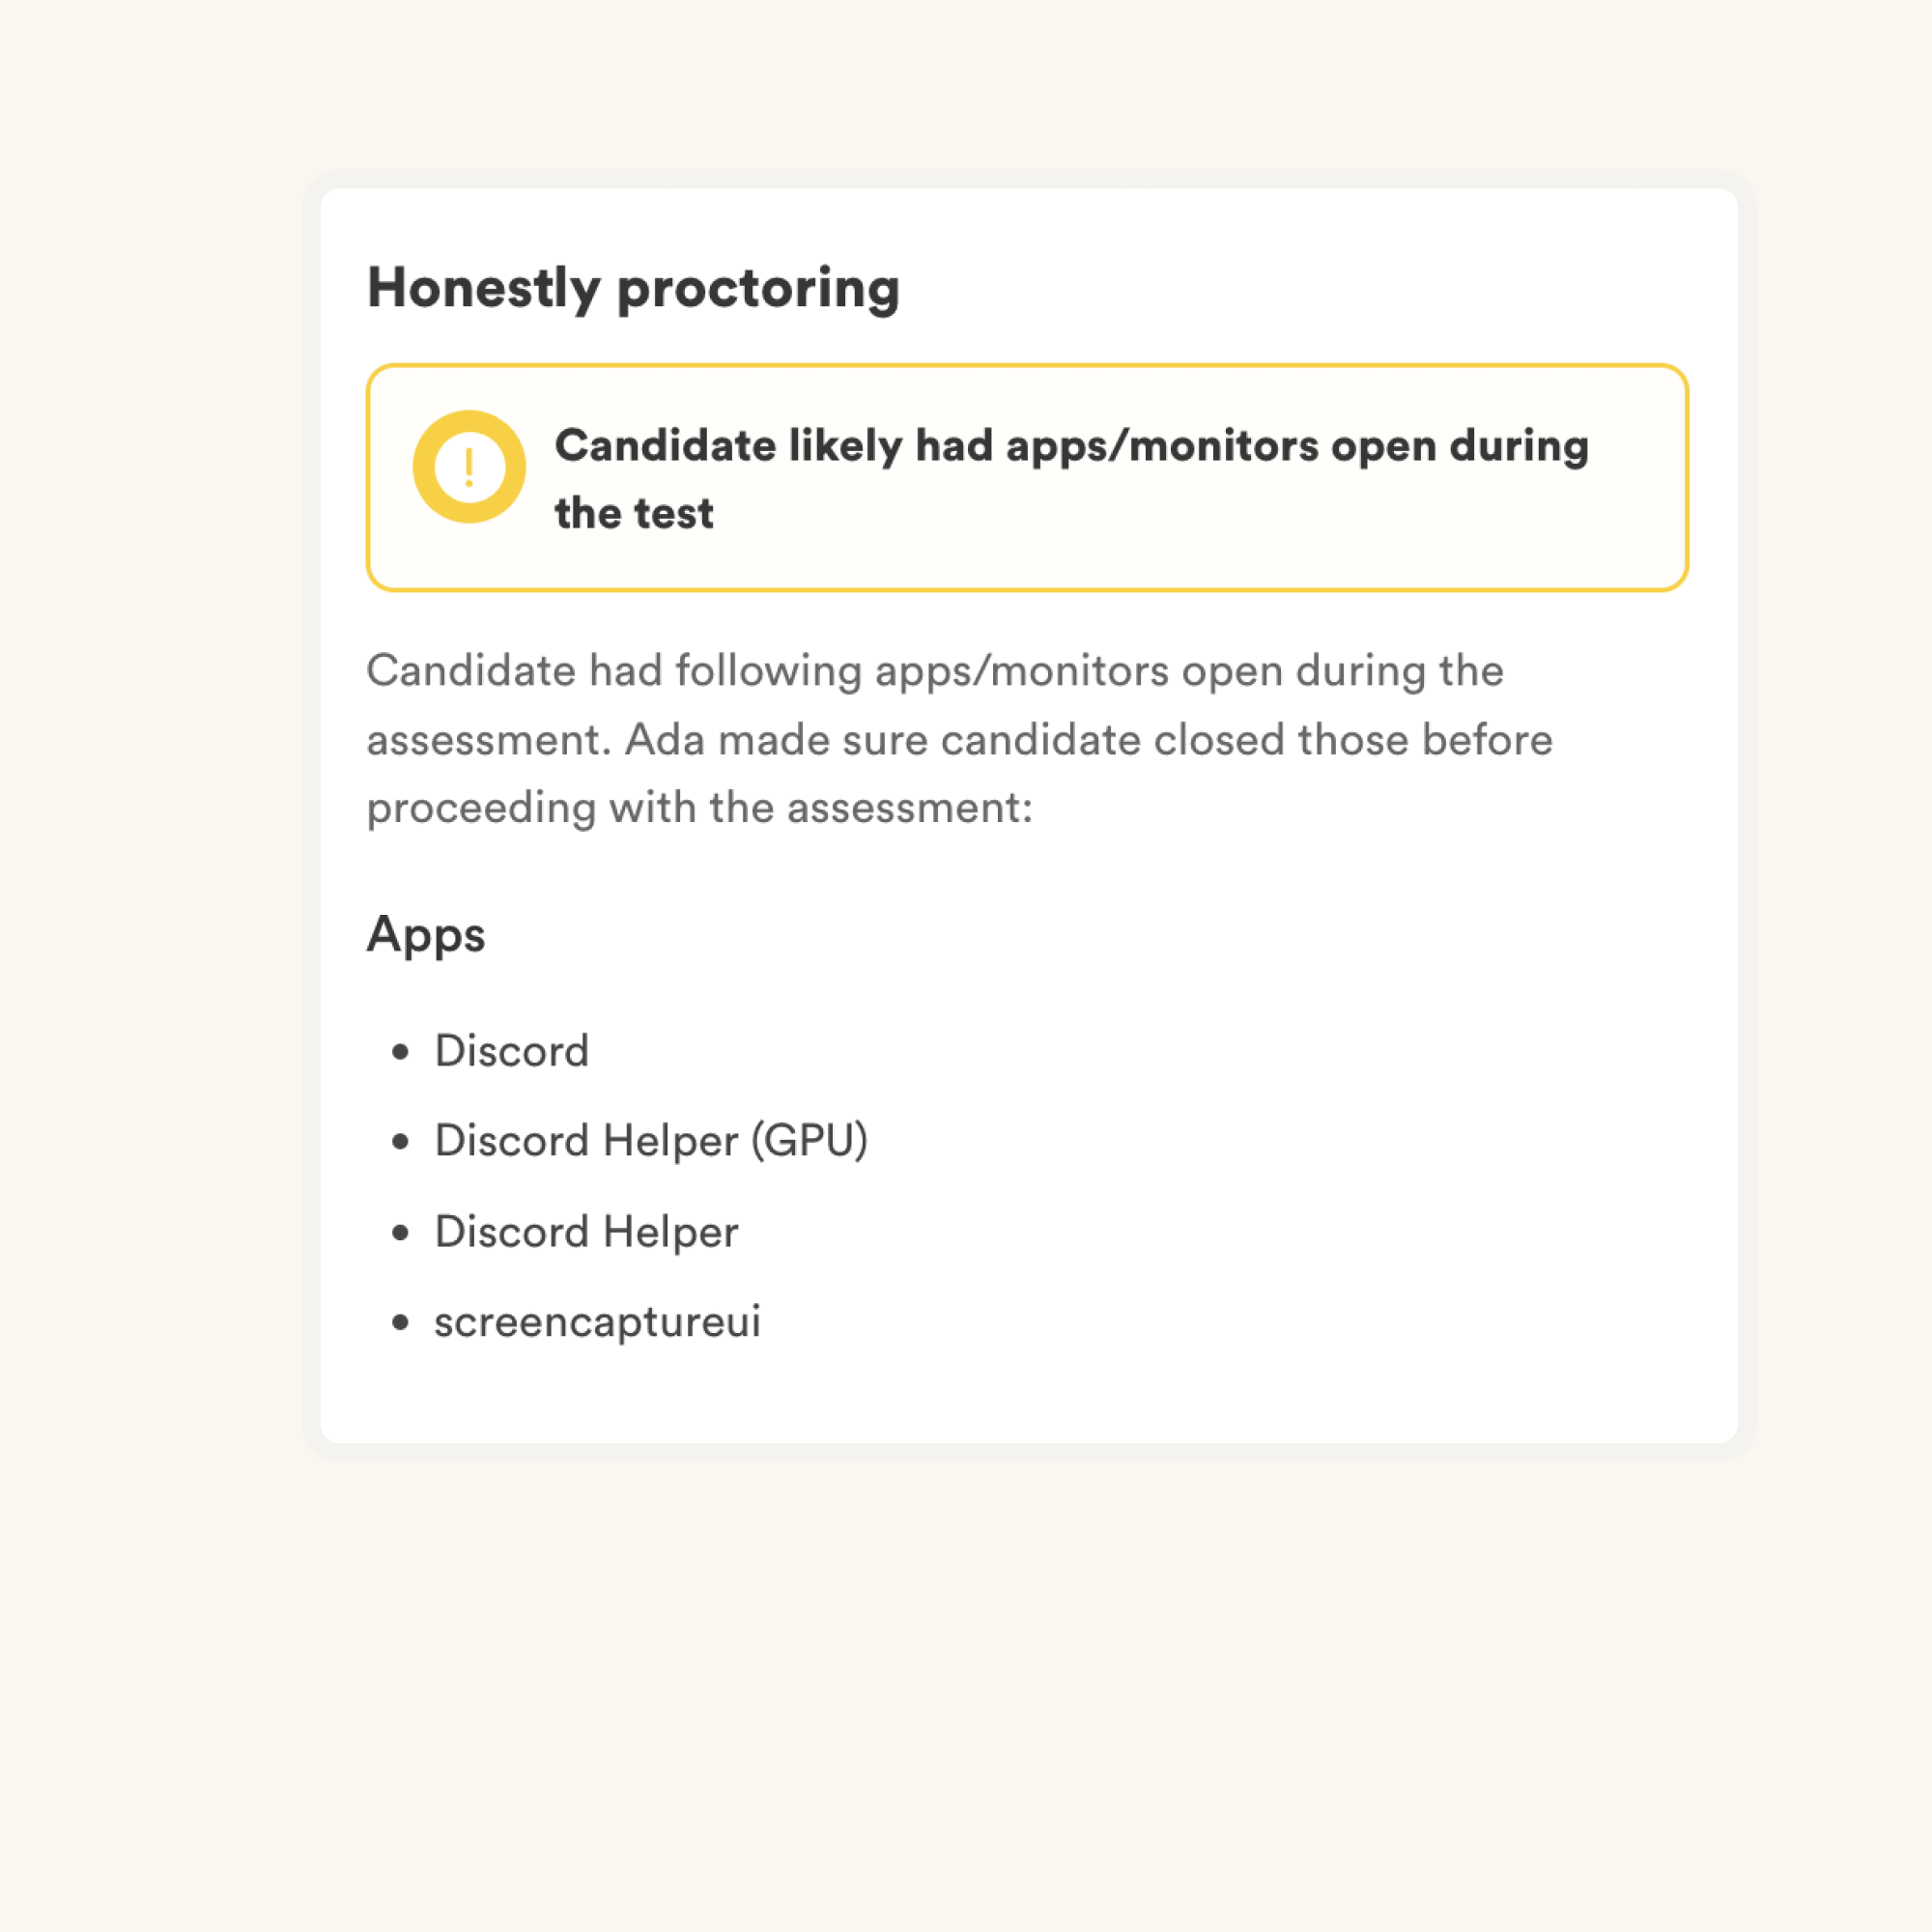
Do you have any anti-cheating or proctoring features in place?

We have the following anti-cheating features in place:

  • Non-googleable questions
  • IP proctoring
  • Screen proctoring
  • Web proctoring
  • Webcam proctoring
  • Plagiarism detection
  • Secure browser
  • Copy paste protection

Read more about the proctoring features.

How do I interpret test scores?

The primary thing to keep in mind is that an assessment is an elimination tool, not a selection tool. A skills assessment is optimized to help you eliminate candidates who are not technically qualified for the role, it is not optimized to help you find the best candidate for the role. So the ideal way to use an assessment is to decide a threshold score (typically 55%, we help you benchmark) and invite all candidates who score above the threshold for the next rounds of interview.

What experience level can I use this test for?

Each Adaface assessment is customized to your job description/ ideal candidate persona (our subject matter experts will pick the right questions for your assessment from our library of 10000+ questions). This assessment can be customized for any experience level.

Does every candidate get the same questions?

Yes, it makes it much easier for you to compare candidates. Options for MCQ questions and the order of questions are randomized. We have anti-cheating/ proctoring features in place. In our enterprise plan, we also have the option to create multiple versions of the same assessment with questions of similar difficulty levels.

I'm a candidate. Can I try a practice test?

No. Unfortunately, we do not support practice tests at the moment. However, you can use our sample questions for practice.

What is the cost of using this test?

You can check out our pricing plans.

Can I get a free trial?

Yes, you can sign up for free and preview this test.

I just moved to a paid plan. How can I request a custom assessment?

Here is a quick guide on how to request a custom assessment on Adaface.

customers across world
Join 1200+ companies in 75+ countries.
Try the most candidate friendly skills assessment tool today.
g2 badges
Ready to use the Adaface Data Analytics in Excel Test?
logo
40 min tests.
No trick questions.
Accurate shortlisting.
Terms Privacy Trust Guide

🌎 Pick your language

English Norsk Dansk Deutsche Nederlands Svenska Français Español Chinese (简体中文) Italiano Japanese (日本語) Polskie Português Russian (русский)
ada
Ada
● Online
Previous
Score: NA
Next
✖️